Executive-grade power bi financial reporting is not the same as building a colorful dashboard for analysts. CFOs, CEOs, and business unit leaders need a reporting layer that helps them assess performance quickly, understand what changed, identify where action is needed, and trust that the numbers are final enough to make decisions. The challenge is that most Power BI finance projects fail in one of three places: the KPI layer is too noisy, drill-down paths are unclear, or the monthly close process is disconnected from the final reported results.
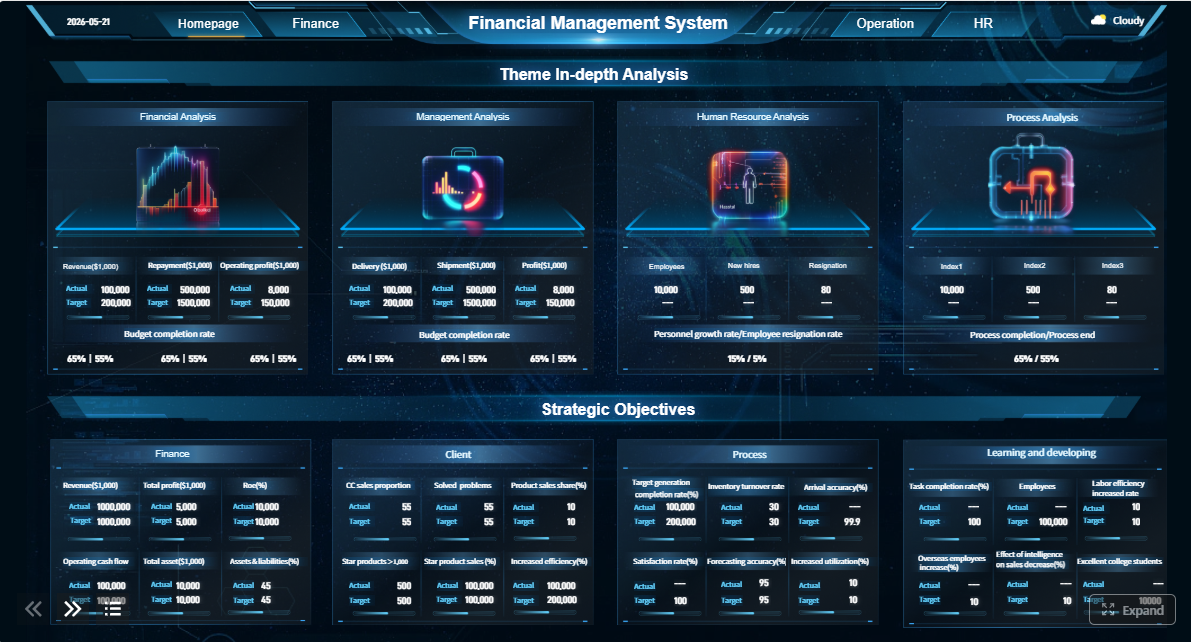 Click To Try The Dashboard
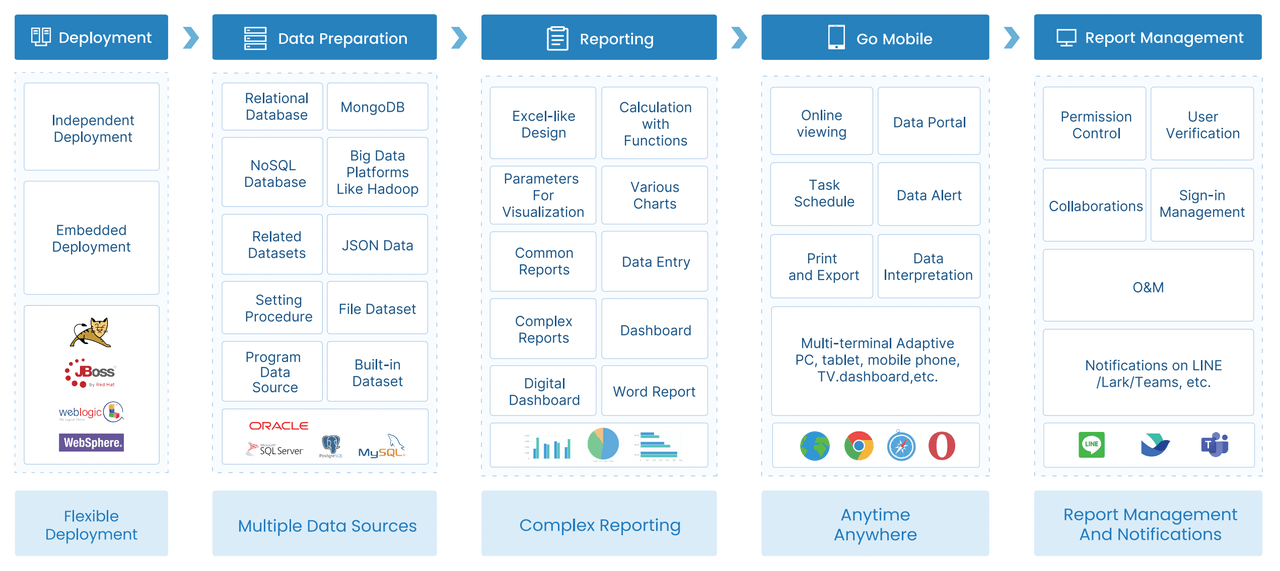
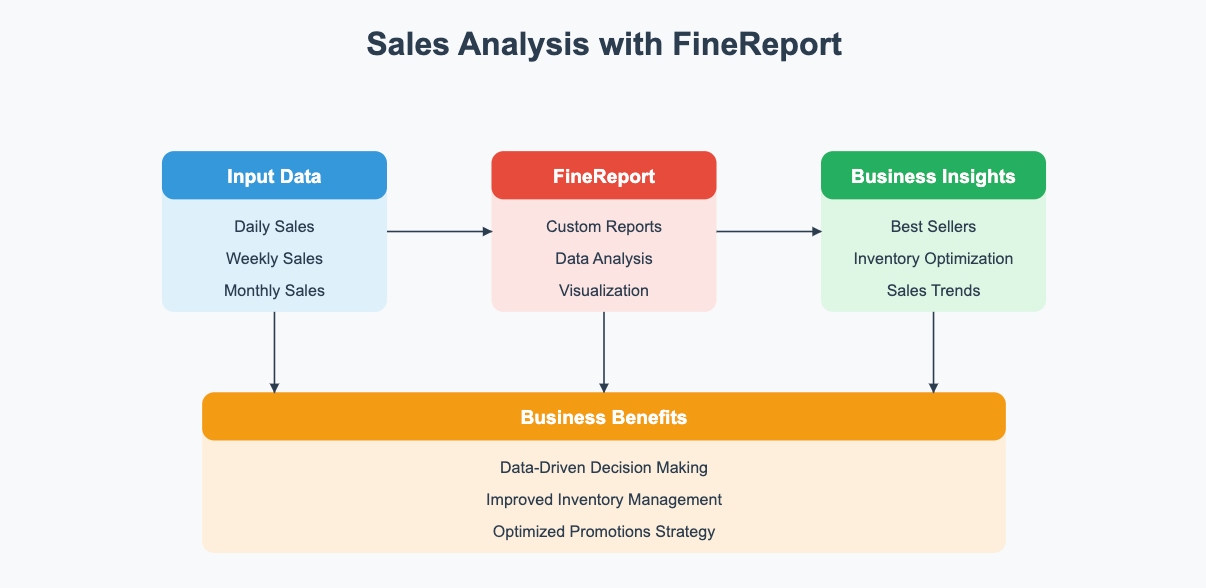
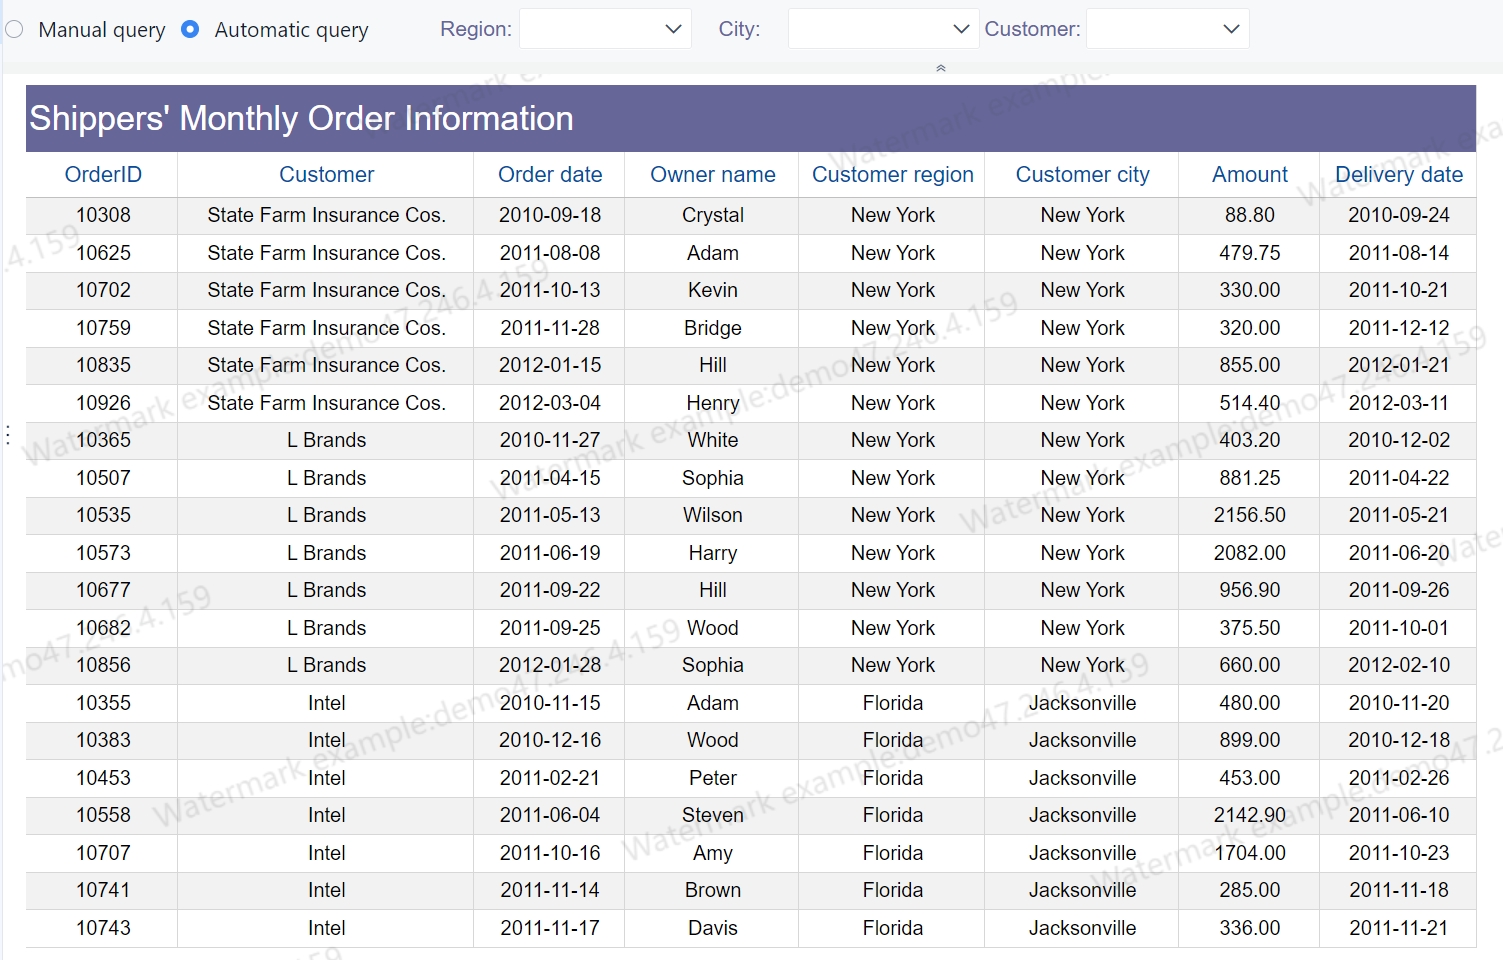
All reports in this article are built with FineReport
What executive stakeholders need from power bi financial reporting
Executives do not open reports to explore data for its own sake. They open reports to answer immediate business questions: Are we on plan? What is driving variance? Is cash tightening? Which entities are off-track? Can I trust this month’s numbers? Effective power bi financial reporting is designed around these decisions, not around available charts.
Daily, weekly, and monthly decisions executives make
At the executive level, reporting cadence shapes reporting design.
- Daily decisions: Monitor cash, major revenue shifts, unusual expense spikes, and operational exceptions that could affect the period outcome.
- Weekly decisions: Review trend movement, budget pacing, business unit performance, and whether intervention is needed before month-end.
- Monthly decisions: Validate financial outcomes, understand variance drivers, review forecast changes, and assess readiness for board, lender, or investor communication.
This is why executives need at-a-glance access to a compact set of numbers with context. They do not want twenty slicers and six pages of exploratory visuals before they can see what matters.
Operational dashboards vs executive financial reporting
A common mistake is treating executive finance reporting like an operations dashboard. They are related, but they serve different purposes.
Operational dashboards usually focus on activity volume, throughput, service levels, and short-cycle metrics. They help teams manage execution.
Executive financial reporting focuses on financial outcomes, material variance, capital efficiency, liquidity, profitability, and confidence in period-close integrity. It helps leadership allocate resources and make strategic decisions.
In practice, this means executive reporting should be:
- More selective
- More consistent in definitions
- More tightly governed
- More focused on exceptions and material movement
- More aligned to formal financial statements and close status
Core business outcomes of better executive reporting
When built correctly, executive finance reporting delivers three outcomes:
- Faster insight: Leaders can see period performance and outliers in minutes, not after multiple finance follow-ups.
- Clearer accountability: Variances are tied to business units, owners, and underlying transactions.
- Better visibility into performance: Results, close status, and adjustment activity are connected in one view.
Design the right KPI structure for an executive financial overview
The executive summary page is where most of the value is won or lost. If the KPI structure is wrong, users either lose confidence or stop using the report.
Choose the metrics that matter most
Start with the smallest KPI set that still supports executive action. For most organizations, the following metrics belong in the top layer of power bi financial reporting.
Key Metrics (KPIs)
- Revenue: Total recognized income for the selected period; the first signal of commercial performance.
- Gross Margin: Revenue minus direct costs; shows the quality of sales and pricing discipline.
- Operating Expense: Indirect costs required to run the business; critical for cost control analysis.
- EBITDA: Earnings before interest, taxes, depreciation, and amortization; a high-level view of operating profitability.
- Cash Position: Available cash and equivalents; essential for liquidity monitoring.
- Budget vs. Actuals: Difference between planned and realized financial performance; used for accountability and control.
- Forecast Variance: Gap between latest forecast and current actual or expected outcome; reveals planning accuracy.
- Accounts Receivable Aging or DSO: Indicates how quickly cash is collected from customers.
- Accounts Payable Timing or DPO: Shows how effectively the company is managing outbound payments.
- Working Capital: Current assets minus current liabilities; supports short-term financial health analysis.
- CapEx vs. Plan: Tracks investment pacing against approved capital expenditure.
- Close Status: Percent of entities, reconciliations, and reviews completed for the reporting cycle.
A strong KPI design also separates two categories:
- Leading indicators: Order trends, pipeline conversion, backlog, collection delays, open accrual exposure.
- Lagging indicators: Revenue, EBITDA, net income, finalized close totals.
This distinction matters because executives need both a rear-view mirror and an early warning system.
Build a financial overview page that is easy to scan
Executives scan before they analyze. Your overview page should support a 15-second read.
A practical page structure looks like this:
- Top scorecard row: Revenue, gross margin, EBITDA, cash, budget variance, forecast variance.
- Trend section: Small trend visuals for the last 12 to 18 periods.
- Variance section: Business unit, region, or product views showing what explains movement.
- Commentary zone: A short text area for finance-approved explanations.
- Close confidence section: Whether numbers are final, provisional, or pending review.
Group KPIs in a way that matches executive thinking:
- Profitability: Revenue, gross margin, EBITDA, net income
- Liquidity: Cash position, current ratio, working capital, receivables
- Efficiency: OpEx ratio, DSO, DPO, inventory days
- Growth: Revenue growth, forecast uplift, segment expansion
This grouping reduces cognitive load and gives the report a stable narrative structure month after month.
Set thresholds, variance logic, and executive alerts
Not every movement deserves executive attention. Finance teams need to define materiality logic before building visuals.
Use three layers of logic:
- Materiality thresholds: For example, only flag a variance if it exceeds both a percentage and a currency amount.
- Directional context: A higher expense is usually unfavorable, while a higher revenue result is favorable. The same color rule cannot apply to every metric.
- Exception rules: Repeated underperformance, delayed reconciliations, or significant late journals should trigger prominent alerts.
For example, a 3% increase in marketing expense may be acceptable, but a 3% decline in gross margin may be material. Good power bi financial reporting reflects business meaning, not just arithmetic change.
Build financial statements in Power BI that support drill-down analysis
Executive dashboards without formal financial statements create friction with finance leadership. The summary page may attract attention, but P&L, balance sheet, and cash flow views are where trust is earned.
Structure P&L, balance sheet, and cash flow views
Financial statement pages should look familiar. If finance leaders cannot validate layout quickly, adoption drops.
Use these design principles:
- Preserve standard statement order and terminology
- Maintain consistent sign conventions
- Align subtotal logic across all pages
- Reflect entity and account hierarchies accurately
- Use the same period selection logic throughout the report
The P&L should support review of revenue, cost of sales, gross profit, operating expenses, and EBITDA in a standard management reporting format.
The balance sheet should clearly separate current and non-current assets, liabilities, and equity while preserving roll-up integrity.
The cash flow statement should distinguish operating, investing, and financing flows and explain movement between opening and closing cash.
Add drill-downs from summary KPIs to transaction-level detail
Drill-down is where executive reporting shifts from visibility to action. But drill-down should not feel like a maze.
A useful drill path typically moves through these levels:
- Company
- Region or entity
- Business unit
- Department or cost center
- Account
- Journal or transaction detail
Each drill path should answer a specific question. For example:
- Why is EBITDA below plan?
- Which entity caused the cash decline?
- What explains the late-period expense increase?
- Which journals changed the final number after initial review?
The key is preserving context. If a user drills from EBITDA variance on the summary page, the next page should already reflect the selected entity, period, and variance context. Do not force executives to rebuild the filter state manually.
Keep report interactions intuitive and controlled
The best executive reports are interactive, but not overly flexible. Too much freedom creates confusion.
Use controlled interaction patterns such as:
- Filters for period, entity, currency, and scenario
- Bookmarks for switching between summary and detail perspectives
- Tooltips for additional context without page changes
- Drill-through pages for root-cause review
- Restricted slicers to avoid accidental misinterpretation
Avoid clutter. Executives should move from summary to root cause in a few clicks, not by navigating a self-service analytics playground.
Improve monthly close visibility with status tracking and reconciliation views
Many finance teams build polished performance dashboards and ignore the close process entirely. That is a strategic mistake. If leadership cannot see how complete, reviewed, and reconciled the numbers are, confidence in reported performance drops.
Show close progress in one place
A monthly close dashboard should consolidate the process status behind the numbers.
At minimum, track:
- Entity close readiness
- Account reconciliation completion
- Open exceptions
- Late journal entries
- Pending approvals
- Intercompany mismatch status
- Unresolved validation checks
- Sign-off progress by owner
This gives executives a real-time sense of reporting maturity. It also helps controllers and finance directors escalate bottlenecks earlier.
Connect close visibility to reported results
Close status should not live in a separate silo. Executives need to know whether KPI movement reflects business performance or closing adjustments.
Show where:
- Post-close adjustments changed revenue or margin
- Accruals altered operating expense
- Reclasses shifted departmental performance
- FX updates changed reported entity outcomes
- Late entries materially affected final EBITDA or cash metrics
A practical status framework is:
- Final: Fully closed, reconciled, and approved
- Provisional: Numbers available but still subject to limited review
- Pending review: Material steps still open or unresolved
- At risk: Close blockers may delay sign-off or reduce confidence
When linked to financial outcomes, this framework helps executives interpret reported performance correctly.
Support trust with audit-friendly detail
Trust in power bi financial reporting is built on traceability. Summary numbers must be explainable.
Add supporting detail such as:
- Timestamp of last refresh
- Owner of the reconciliation or adjustment
- Source system identifier
- Validation check result
- Journal reference or close task reference
- Status history where material changes occurred
This is especially important for board reporting, audit preparation, and multi-entity environments where numbers pass through several transformation steps before presentation.
Build a reporting model executives can trust and finance teams can maintain
A polished front end cannot compensate for a weak finance data model. If the model is inconsistent, every KPI discussion becomes a debate over definitions instead of a decision about action.
Prepare the data model for consistent reporting
Finance models must standardize the foundations first.
That includes:
- Chart of accounts structure
- Fiscal calendar logic
- Legal entity mapping
- Department and cost center hierarchies
- Scenario definitions for actuals, budget, and forecast
- Currency conversion rules
- Master data stewardship
You also need reusable measures for:
- Current actuals
- Budget
- Forecast
- Prior period
- Prior year
- Month-to-date, quarter-to-date, and year-to-date
- Variance amount
- Variance percentage
- Rolling 12-month analysis
This avoids the common problem of duplicate logic scattered across visuals and pages.
Decide when no-code approaches are enough
Not every finance team needs a complex enterprise BI build on day one. Smaller teams can often start with simpler self-service or low-code patterns, especially when entity structures are limited and reporting rules are stable.
A no-code or light-governance approach can work when:
- There are few source systems
- The chart of accounts is mature
- Reporting consumers are limited
- Security needs are straightforward
- Financial statement complexity is low
A more governed model becomes necessary when:
- Multiple entities report under different structures
- Intercompany activity is significant
- Auditability is mandatory
- Metric definitions vary by department
- Executive reporting is widely distributed
- Close and reporting workflows need automation
The right question is not whether to go fast or governed. It is how to balance speed, control, and long-term maintainability.
Establish governance, security, and refresh practices
Finance reporting requires operating discipline, not just technical capability.
Best-practice controls include:
- Row-level security: Restrict entity or departmental access appropriately.
- Refresh schedules: Align data updates with close timing and executive review windows.
- Certified datasets: Publish one trusted semantic layer for finance metrics.
- Version control: Prevent silent changes to KPI logic or statement structures.
- Definition ownership: Assign formal accountability for each metric and hierarchy.
- Change management: Log updates to formulas, mappings, and business rules.
Without governance, different teams will interpret the same metric differently, and executive trust will erode quickly.
Common mistakes to avoid when building executive financial reports in Power BI
Even mature finance teams make predictable design errors. Avoid these early.
1. Cramming too many visuals onto one page
A dense page may look comprehensive, but it reduces clarity. Executive reporting should guide attention through hierarchy: headline, trend, variance, and explanation.
2. Mixing incompatible financial definitions
If revenue, EBITDA, or forecast logic varies across teams or source systems, the report becomes politically risky. Standardize metric definitions before publishing.
3. Overusing drill-through and filters
Powerful interaction can become a usability problem. If executives need training just to navigate the report, the design is too complex.
4. Ignoring close-process visibility
A dashboard that shows results without showing how finalized those results are creates false confidence. Close transparency is part of executive reporting, not an optional appendix.
5. Treating the first release as final
The first version should be considered a working release. The best executive reporting environments improve through structured feedback cycles with finance leaders and business stakeholders.
Best practices for implementing executive power bi financial reporting
If I were advising a finance transformation team, I would recommend the following rollout sequence.
1. Start with executive decisions, not available data
Interview CFOs, controllers, and business leaders first. Identify the ten questions they ask every month, then design the report backward from those questions.
2. Lock metric definitions before visual design
Agree on revenue, margin, EBITDA, budget variance, forecast variance, and cash logic before anyone debates chart types. Definition disputes late in the project are expensive.
3. Prototype one overview page and one statement page first
Do not build the whole report suite at once. Validate the executive overview and one drillable P&L page with stakeholders, then expand.
4. Build close visibility in parallel with KPI reporting
Do not leave close tracking for phase two. Reporting confidence is part of the executive experience from the start.
5. Create a governance operating model early
Assign owners for metrics, data mappings, refresh schedules, security, and release changes. Executive reporting fails more often from ownership gaps than from visualization issues.
Building this manually is complex; use FineReport to automate the workflow
For many teams, building robust power bi financial reporting manually becomes difficult long before the reporting vision is complete. Financial statements need precise formatting. KPI logic must stay consistent. Close status has to connect with reported results. Drill-down paths must remain intuitive. Governance, refresh, permissions, and executive usability all need ongoing maintenance.
That is why many enterprises move toward a reporting platform that shortens delivery time and reduces maintenance overhead.
Building this manually is complex; use FineReport to utilize ready-made templates and automate this entire workflow. FineReport helps finance teams create executive dashboards, drillable financial statements, close-monitoring views, and governed enterprise reports faster. Instead of stitching together multiple manual steps, teams can standardize templates, accelerate delivery, and improve trust in the final output.

Get Ready-to-Use Dashboard Templates in Fine Gallery
FineReport is especially valuable when you need to:
- Build executive-ready dashboards quickly
- Standardize financial templates across entities
- Support drill-down from KPI to detail
- Add process visibility to close reporting
- Strengthen governance and reporting consistency
- Reduce dependence on heavy manual development
If your current reporting stack is slowing down finance, delaying executive decisions, or creating avoidable reconciliation work, now is the time to modernize the workflow.
FAQs
Focus on a small set of decision-making metrics such as revenue, gross margin, operating expense, EBITDA, cash position, budget versus actuals, forecast variance, and close status. These give leaders a fast view of performance, liquidity, and reporting confidence.
Executive financial reporting is designed for quick decisions, not open-ended exploration. It uses fewer visuals, tighter metric definitions, and stronger alignment with formal finance processes like monthly close and variance review.
Drill-downs help executives move from a headline KPI to the business unit, account, or transaction driving the change. This makes variance analysis faster and reduces the need for follow-up questions to finance teams.
Add close status metrics alongside financial results so leaders can see whether numbers are preliminary or final. This improves trust in the report and helps executives judge whether action can be taken immediately.
A strong overview page highlights the most material KPIs first, uses consistent layouts, and emphasizes exceptions rather than clutter. Executives should be able to understand performance and spot issues within seconds.


The Author
Yida Yin
FanRuan Industry Solutions Expert
Related Articles

ERP Reporting Explained: What It Is, How It Works, and Why Enterprise Teams Rely on It
ERP reporting is the process of turning data inside your enterprise resource planning system into usable business insight. For finance leaders, operations directors, supply chain managers, and IT teams, that matters beca
Yida Yin
Jun 25, 2026
8 Best Restaurant Reporting Software Tools for 2026: Compare FineReport, Toast, SpotOn & More
$1 is a highly customizable business intelligence and reporting platform that helps restaurants turn POS, labor, inventory, finance, and multi location data into real time dashboards and decision ready reports. 8 Best Re
Yida Yin
Jun 24, 2026

Database Reporting Architecture: When to Use a Reporting Database vs Your Operational System
$1 is not just about pulling data into a dashboard. It is an architecture decision that affects application performance, reporting speed, data trust, and how confidently your teams can make decisions. If you are an IT ma
Yida Yin
Jun 24, 2026