Executive reporting breaks down when every team uses a different format, different KPI definitions, and different update timing. Leaders waste time comparing reports instead of making decisions. A free KPI dashboard template helps create a common executive view, but the real value comes when that template is supported by trusted reporting workflows and an AI assistant that helps teams consume, summarize, and act on the data.
With FineReport + Dora, teams can ask for a report summary in chat, generate structured narratives from trusted report assets, receive scheduled briefings, and push exceptions to the right owner.
Click To Try The Dashboard
All reports in this article are built with FineReport
What a Free KPI Dashboard Template Solves in Executive Reporting
A free KPI dashboard template solves a common executive reporting problem: inconsistency. In many organizations, finance, sales, operations, and regional teams all submit updates in slightly different ways. Even when they report on similar performance areas, differences in layout, metric logic, date ranges, and commentary style make comparison difficult.
For executives, that creates three immediate problems:
Slower decisions because leaders must ask basic clarification questions before discussing action.
Lower trust because teams may define the same KPI differently.
Weaker accountability because owners, deadlines, and follow-up actions are not presented consistently.
A shared dashboard format improves executive reporting in several ways:
It creates comparability across business units and reporting periods.
It reduces review friction by showing the same core sections every time.
It supports reporting discipline by requiring teams to use the same KPI rules, status logic, and summary structure.
It gives IT and reporting teams a repeatable framework for automation and governance.
Still, a template cannot standardize everything on its own. It can standardize format, layout, reporting cadence, and presentation logic, but it cannot automatically fix:
Poor data quality
Undefined KPI ownership
Conflicting business definitions
Unclear action workflows
Weak report governance
This is where FineReport + Dora becomes practical for enterprise use. FineReport provides the trusted reporting and operational cockpit foundation. Dora adds the enterprise Data Agent layer, helping executives and managers consume those trusted reports through chat, structured summaries, alerts, and follow-up workflows.
How to Use a Free KPI Dashboard Template Step by Step
A free KPI dashboard template works best when it is tied to executive review scenarios, not just visual design. The process should start with decision needs, then move into metrics, definitions, ownership, and cadence.
Identify the metrics that matter most
Start with the executive audience. Weekly, monthly, and quarterly reviews are not all the same. Executives usually want a short list of indicators that show:
Current business health
Progress toward strategic goals
Areas of material risk
Topics requiring decisions or escalation
The best dashboards separate core KPIs from supporting context metrics.
Core KPIs are the few numbers executives should review every cycle.
Supporting context metrics explain why a KPI moved, but should not overwhelm the main view.
In FineReport, these KPIs can be structured into scorecards, trend views, and exception panels. Dora can then act as a Data Analystdigital employee, helping executives ask natural-language questions such as why a KPI changed, which region is underperforming, or what actions remain open.
This step is where many dashboard standardization efforts fail. Even a polished free KPI dashboard template becomes unreliable if teams calculate the same KPI differently.
KPI: Gross margin Definition: Revenue minus cost of goods sold, divided by revenue, for the approved monthly close period. Business value: Helps executives track profitability quality, not just top-line growth. AI use:Dora can summarize margin movement, explain unusual variance by business unit, and include it in a scheduled executive briefing.
KPI: On-time delivery rate Definition: Percentage of orders delivered within agreed customer delivery windows during the reporting period. Business value: Reflects service performance and operational reliability. AI use:Dora can identify which region or product line caused declines, generate a chart-based explanation, and push exceptions to responsible managers.
KPI: Customer churn rate Definition: Percentage of customers lost during the period relative to the active customer base at period start. Business value: Indicates retention health and possible revenue risk. AI use:Dora can compare churn with prior periods, summarize risk concentration, and prepare a management narrative for review.
FineReport supports this standardization by building governed report templates and a trusted semantic structure. Dora uses those trusted definitions to produce more controlled and auditable answers, rather than relying on raw prompt interpretation alone.
Create a consistent executive view
Executives should not need to relearn how to read the dashboard every month. The layout should remain stable so leaders can scan quickly and focus on meaning, not navigation.
Use the same structure in every cycle:
Executive summary at the top
KPI scorecards in a fixed order
Trend charts beneath each metric group
Risk and exception section
Actions and owner follow-up section
Also standardize visual logic:
The same status colors for all teams
The same trend periods
The same label conventions
The same reporting date format
The same summary note structure
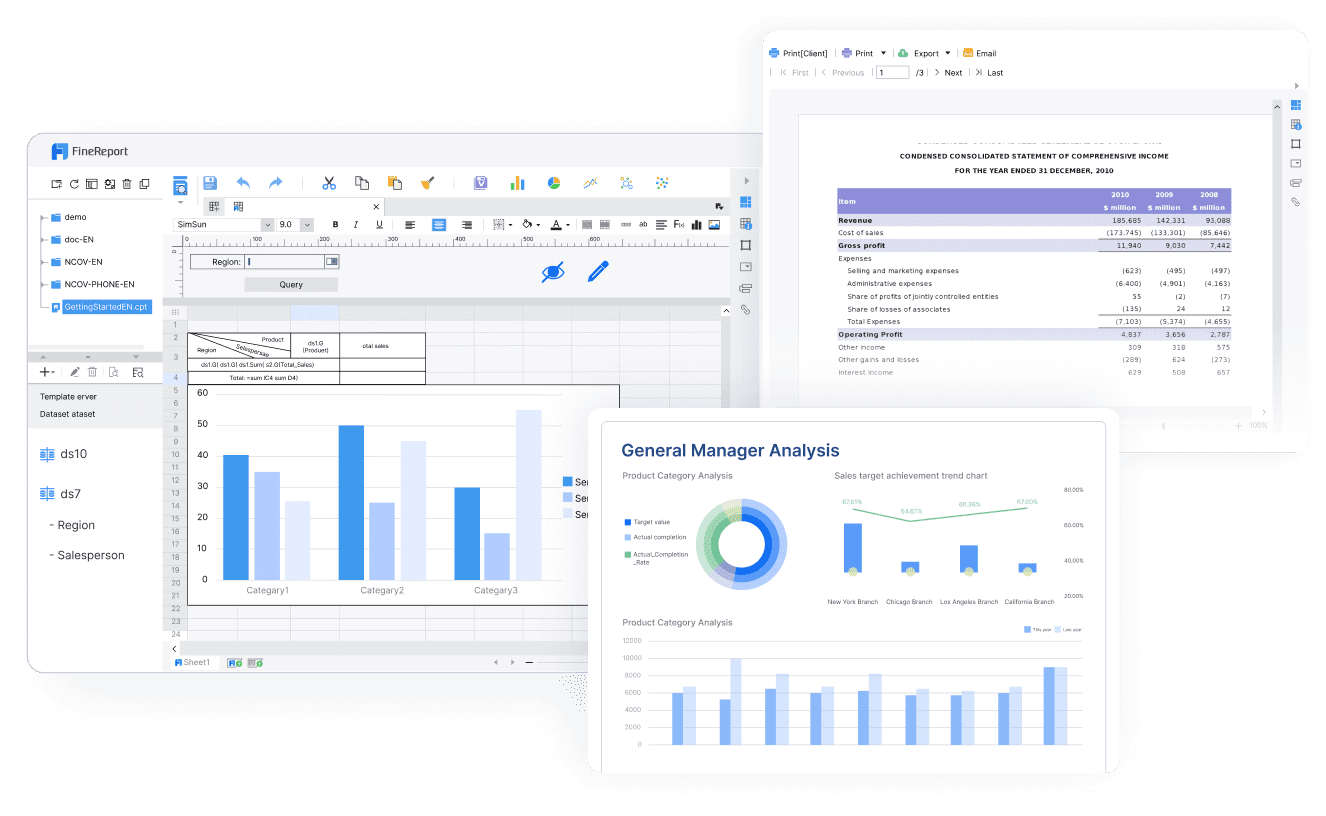
FineReport is especially strong here because it helps teams build formatted reports, complex reports, management reports, and operational cockpits that preserve consistency across departments. Dora then turns those report assets into an AI assistant layer that can explain, summarize, and push the same executive view in scheduled formats.
What to Include in a Standard Executive KPI Dashboard
A strong executive dashboard should be concise, comparable, and action-oriented. It should not try to replace detailed operational analysis. Instead, it should help leaders quickly answer three questions:
What is happening?
Why does it matter?
What needs action next?
Core sections every dashboard should have
Executive summary
This section should capture the few points leaders need before they look at the detailed metrics.
Include:
Top wins
Major risks
Significant variances
Decisions needed
Cross-functional dependencies
Business value: Reduces meeting time spent on basic orientation. AI use:Dora’s Report Researcher can generate a structured report summary from FineReport outputs, highlight important KPI movement, and create management-ready narrative drafts.
KPI scorecards
Every core KPI should show:
Current value
Target
Variance
Trend
Status
Business value: Makes performance scan-friendly and comparable across periods. AI use:Dora can explain the scorecard in plain language, answer chat-based questions, and summarize which KPIs need executive attention.
Trend visuals
Executives need to know whether a number is improving, declining, or volatile. Use line charts, bar comparisons, or period-over-period trend views.
Business value: Helps leaders distinguish isolated changes from sustained patterns. AI use:Dora can generate chart explanations such as why a KPI deviated from trend and which factor likely contributed most.
Action and accountability section
This section should state:
What follow-up is needed
Who owns it
Deadline
Escalation status
Business value: Converts reporting into execution. AI use:Dora’s Risk Alert Officer can monitor overdue items, detect threshold breaches, and push follow-up reminders to the right owner.
Business value: Prevents confusion about what period and business boundary the dashboard covers. AI use:Dora can answer clarification questions in chat using trusted KPI definitions stored in the reporting framework.
Optional elements for deeper context
Depending on the scenario, a dashboard may also include:
Benchmark comparisons
Forecast indicators
Budget versus actual views
Regional performance breakdowns
Commentary for unusual changes
These should remain secondary. Executive dashboards become less effective when optional details crowd out the decision layer.
How an AI Data Agent Automates Report Consumption
A free KPI dashboard template standardizes the reporting surface. But executives still spend time reading, asking follow-up questions, clarifying definitions, and chasing actions. This is where an enterprise Data Agent adds practical value.
With FineReport + Dora, the dashboard is not just a static report. FineReport provides the trusted reporting foundation, including KPI definitions, templates, permissions, charts, and operational cockpit views. Dora adds the AI assistant layer that helps users query, summarize, alert, and follow up within governed workflows.
The most relevant Doradigital employee for this scenario is the Daily Briefing Secretary, often supported by the Report Researcher and Risk Alert Officer.
A scenario-specific chat example might look like this:
“Summarize this month’s executive KPI dashboard, highlight any red-status metrics, explain the largest margin decline, and list the owners who need follow-up before Friday.”
Understand semantic rules and KPI definitions Dora references governed metric definitions, filters, ownership rules, and business terms so it interprets the dashboard correctly.
Generate a structured report summary Dora produces a concise executive narrative covering wins, risks, KPI changes, and exceptions in a management-friendly format.
Detect abnormalities and threshold breaches Dora identifies red-status metrics, unusual trend movement, overdue actions, or key variances that require attention.
Push briefings and alerts to the right people Dora sends scheduled summaries, periodic briefing notes, and exception alerts to executives or functional owners.
Track follow-up and prepare the next review Dora can support follow-up records, recurring briefing preparation, and owner reminders for the next weekly or monthly review.
This is a strong example of Agentic BI in practice. Dora is not positioned as a generic chatbot. It is an enterprise Data Agent designed to operate over trusted reporting assets with controlled Skills, governed query paths, and reusable workflows.
Executive reporting automation usually fails when AI is disconnected from governed reports. Raw prompt-based tools may produce plausible language, but enterprise reporting needs stronger control.
FineReport builds the trusted report foundation with templates, permissions, semantic consistency, and report governance.
Dora consumes those trusted assets instead of improvising from ungoverned data.
Skills-based execution gives more controllable and auditable workflows than feature-only agent demos.
Scheduled summaries and exception pushes fit recurring executive review cycles.
Permission boundaries help ensure the AI assistant respects enterprise access rules.
Better enterprise landing capability comes from combining data, governance, templates, and scenario design.
For executives, this means Dora is not an AI experiment. It is a practical AI digital employee for recurring reporting work such as monthly management summaries, performance reviews, risk alerts, and owner follow-up.
For IT teams, the role shifts from building every summary manually to improving data connections, semantic layers, report templates, KPI governance, and reusable agent Skills.
For business users, Dora lowers reporting friction by delivering timely report summaries, chart-based answers, scheduled briefings, and exception pushes without requiring them to search through multiple reports.
Common Mistakes That Undermine Standardization
Even a well-designed free KPI dashboard template can lose value if teams do not protect consistency.
The most common mistakes include:
Including too many metrics for executives to process quickly
Mixing operational detail with high-level decision metrics
Changing KPI definitions between periods
Using inconsistent visuals, thresholds, or date windows
Writing commentary in different styles across departments
Failing to assign owners for updates and follow-up
These mistakes create reporting noise rather than executive clarity.
Signs your dashboard is not executive-ready
You likely have a standardization problem if:
Leaders ask for the same clarifications in every review
Similar metrics appear in different formats across teams
Reports emphasize activity counts instead of outcome KPIs
Teams debate definitions rather than discussing action
Follow-up items disappear between reporting cycles
FineReport helps reduce these issues through standardized report templates and centralized reporting logic. Dora strengthens execution by surfacing the right summary, definitions, and exceptions in a more usable way.
Best Practices for Keeping Executive Reporting Consistent Over Time
Executive reporting consistency is not a one-time template exercise. It is an operating discipline. The organizations that succeed treat dashboard standardization as a governed process.
Review the dashboard periodically without changing the structure too often
The structure should remain stable enough for comparison across time. Review the dashboard every few cycles, but avoid unnecessary redesign.
Why it matters: Frequent layout changes break comparability and confuse contributors. AI/Data Agent value:Dora performs better when recurring report structures, KPI semantics, and summary expectations remain stable.
Assign clear ownership for data quality, updates, and commentary
Every KPI should have a business owner, a data owner, and an update expectation.
Why it matters: Without ownership, executives lose confidence in the report. AI/Data Agent value:Dora relies on trustworthy source assets. Strong data quality and ownership improve the usefulness of AI-generated summaries and exception alerts.
Archive past reports for trend and decision tracking
Historical reporting is essential for understanding performance patterns and reviewing prior decisions.
Why it matters: Executives need context, not just current-period snapshots. AI/Data Agent value:Dora can use prior report assets to support periodic summary comparisons and prepare meeting briefings.
Train contributors on how to use the template correctly
Do not assume a template alone creates standardization. Teams need guidance on metric logic, commentary expectations, and update timing.
Why it matters: Reporting discipline depends on contributor behavior. AI/Data Agent value: Human review remains important for AI-generated report narratives, especially during early rollout.
Preserve permissions and governance in AI workflows
AI should not bypass your reporting controls.
Why it matters: Executive dashboards often contain sensitive financial, operational, or strategic data. AI/Data Agent value:Dora is stronger in enterprise settings because it works with permissions, semantic rules, KPI governance, and report templates rather than ignoring them.
How to evolve the dashboard without losing consistency
A dashboard should evolve only when business priorities materially change.
Use these governance practices:
Update KPIs only when strategic direction changes
Version layout changes carefully
Communicate definition updates before the next reporting cycle
Require approval for new metrics or threshold changes
Maintain a KPI dictionary and reporting standard
These practices are especially important if you plan to use Dora as a Daily Briefing Secretary or Report Researcher, because AI workflows are more stable when report structures and business rules are governed.
A free KPI dashboard template should not be treated as a passive reporting document. Its real value appears when it becomes part of executive operating rhythm.
Use the dashboard as:
A decision support tool
A cross-functional alignment mechanism
A trigger for exception handling
A basis for owner accountability
A standard executive communication format
To get more value:
Pair KPI reviews with explicit decisions and next steps
Track actions tied to red-status or deteriorating metrics
Refine the template after several cycles of executive feedback
Roll the same reporting discipline across departments
Add AI-assisted summaries and alerts where repetitive review work exists
This is where FineReport + Dora creates practical leverage. FineReport standardizes the reporting asset. Dora helps people use it more effectively through natural-language query, structured report summaries, scheduled briefings, exception push, and follow-up support.
FineReport + Dora Solution Pitch
Building this manually is complex. FineReport helps teams standardize trusted reports, operational cockpits, templates, and reporting workflows. Dora turns those assets into an AI assistant that can answer report questions in chat, generate structured summaries, push scheduled briefings, monitor exceptions, and follow up with responsible owners.
For organizations using a free KPI dashboard template as the starting point, FineReport helps move from static formatting to governed enterprise reporting. Dora then helps move from manual report consumption to AI-supported report execution.
That matters because executive reporting is rarely just about display. It also involves:
Consistent KPI governance
Timely report delivery
Exception handling
Meeting preparation
Narrative generation
Ownership follow-up
FineReport + Dora is not only a reporting upgrade; it is a practical fourth-generation Agentic BI path.FineReport provides governed reports and operational cockpits. Dora provides the AI assistant layer for scenario execution, with more controlled Skills, lower token waste, faster execution paths, and more stable workflows than prompt-only agents.
Get Ready-to-Use Dashboard Templates in Fine Gallery
The strongest Dora pitch is scenario + product + service: FineReport provides the trusted reporting foundation, Dora provides the AI digital employee, and implementation service connects data, governance, semantic setup, Skills, report templates, permissions, and rollout.
If your goal is to standardize executive reporting with a free KPI dashboard template, start with a consistent reporting structure. Then build the governed reporting foundation underneath it. Finally, add an enterprise Data Agent that helps executives ask questions, receive structured briefings, and push action to the right owners.
It should include a small set of core KPIs, consistent metric definitions, reporting periods, status indicators, and clear ownership. The goal is to help leaders compare performance quickly and focus on decisions.
No. A template can standardize layout, cadence, and presentation, but it cannot solve poor data quality, unclear KPI definitions, or weak governance on its own.
Start with the decisions executives need to make, then select a short list of indicators tied to business health, strategic progress, and major risks. Supporting metrics should explain movement without cluttering the main view.
Without shared formulas, date ranges, and threshold rules, teams may report the same KPI differently and reduce trust in the dashboard. Standardized definitions make comparisons more reliable across departments and time periods.
FineReport provides the governed reporting foundation and structured dashboard views, while Dora helps users summarize reports, ask questions in chat, and route exceptions to the right owners. Together, they make executive reporting more consistent and actionable.
Product Trial
FineReport
Pixel-perfect reports · Interactive dashboards · Easy data entry · Digital twins