An open source KPI dashboard is a self-hosted or customizable dashboard environment used to track key performance indicators across business, product, operations, or technical teams without relying entirely on proprietary BI licensing. If you are searching for one, you are probably trying to answer a practical question: Which open source dashboard tool gives my team the right balance of flexibility, usability, cost, and long-term maintainability?
That question matters because KPI dashboards are not all built for the same job. Some tools are excellent for real-time operational metrics and infrastructure monitoring. Others are better for business reporting, SQL analysis, or executive dashboards. And while open source can reduce license costs, it can also increase the burden of setup, governance, support, and internal administration.
This guide compares seven relevant tools for 2026, with a focus on the most commonly shortlisted names: Grafana, Metabase, Apache Superset, and Redash, plus several additional contenders worth evaluating depending on your use case.
An open source KPI dashboard usually makes sense when your team wants one or more of the following:
More control over hosting and deployment
Lower licensing costs at scale
Greater extensibility for custom workflows
SQL-first or developer-friendly dashboarding
The ability to adapt the platform to internal data environments
It tends to be most attractive for engineering-led teams, startups, internal analytics teams, and organizations with strong technical ownership. It may be less ideal when business users need highly polished, governed, low-maintenance reporting with minimal internal support.
This comparison is intentionally balanced. None of these tools is the right answer for every KPI program. The best option depends on whether your dashboards are primarily for live monitoring, self-service business analysis, SQL exploration, embedded analytics, or governed enterprise reporting.
The 7 tools covered in this comparison and the selection criteria for 2026
The seven tools in this guide were chosen because they appear repeatedly in open source dashboard shortlists and represent different dashboarding styles:
Grafana
Metabase
Apache Superset
Redash
Lightdash
Evidence
Kibana
Some are broader BI platforms, while others are more specialized. That distinction matters. A team tracking service uptime and API latency has different needs from a finance team tracking margin, forecast variance, and monthly performance.
Quick view of who each tool is best for
Engineering teams: Grafana, Kibana
Business users: Metabase
Startups: Metabase, Redash
Data-heavy organizations: Superset, Lightdash
Developer-led embedded experiences: Evidence
SQL-centric collaboration: Redash, Superset
How we compared the 7 tools
Choosing an open source KPI dashboard is not just about chart variety. In real projects, teams succeed or fail based on how the platform fits their data skills, governance requirements, and reporting habits.
Evaluation criteria that matter in real KPI reporting
Ease of setup and maintenance
Open source tools differ sharply in operational overhead.
Metabase is generally one of the easiest to get running.
Grafana is straightforward for technical teams, especially in containerized environments.
Superset is more flexible, but usually requires more setup and admin effort.
Redash is relatively lightweight, but its long-term modernization pace is an important consideration.
Lightdash and Evidence are easier to appreciate if you already have a modern data stack.
Kibana works best when your data already lives in the Elastic ecosystem.
The hidden cost is often not installation, but ongoing ownership: user provisioning, upgrades, permissions, data modeling, dashboard quality control, and support.
Data source support and query flexibility
A KPI dashboard is only as useful as the data it can reliably access.
Look at:
Native connectors
SQL support
Semantic or modeling layers
API extensibility
Multi-source dashboard capability
Some tools shine with SQL databases. Others are optimized for time-series, logs, or modern warehouse environments.
Visualization quality and dashboard customization
A good KPI dashboard should help users see exceptions, trends, targets, and changes quickly. That means evaluating:
Chart variety
Layout flexibility
Drill-down support
Filters and parameter controls
The ability to build role-specific dashboards
Visualization depth is not the same as reporting depth. Some tools create interactive dashboards well but are weaker for structured, print-ready, recurring reports.
User permissions, sharing, and collaboration
For real KPI reporting, access control matters. Ask whether the tool supports:
Team and role-based permissions
Dashboard sharing
Embedded access
Row-level or object-level controls
Controlled collaboration across departments
This is especially important if your KPI dashboards move beyond internal analyst use and into wider business consumption.
Alerting, embedding, and automation
Dashboards are more useful when they trigger action.
Important capabilities include:
Threshold alerts
Scheduled delivery
Embedding into portals or applications
Snapshot sharing
Subscription workflows
Grafana is especially strong in alert-driven operational use cases. Business teams may care more about scheduled summaries and governed distribution.
Community activity, documentation, and long-term viability
With open source tools, community health matters almost as much as product features. Before committing, check:
Release cadence
Contributor activity
Documentation quality
Ecosystem maturity
Clarity of roadmap and maintenance
A tool can be attractive in a proof of concept but risky if momentum is slowing.
What to check before choosing a dashboard platform
Whether your team needs self-service analytics or developer-led dashboarding
This is often the most important question.
If non-technical users need to build and edit dashboards, Metabase is often easier.
If your team prefers SQL and engineering control, Superset, Redash, or Lightdash may fit better.
If the goal is observability and real-time monitoring, Grafana is usually the stronger candidate.
Hosting model, security requirements, and scalability expectations
Open source does not automatically mean simpler governance. You should define:
Grafana vs Metabase vs Superset vs Redash vs the other contenders
Grafana
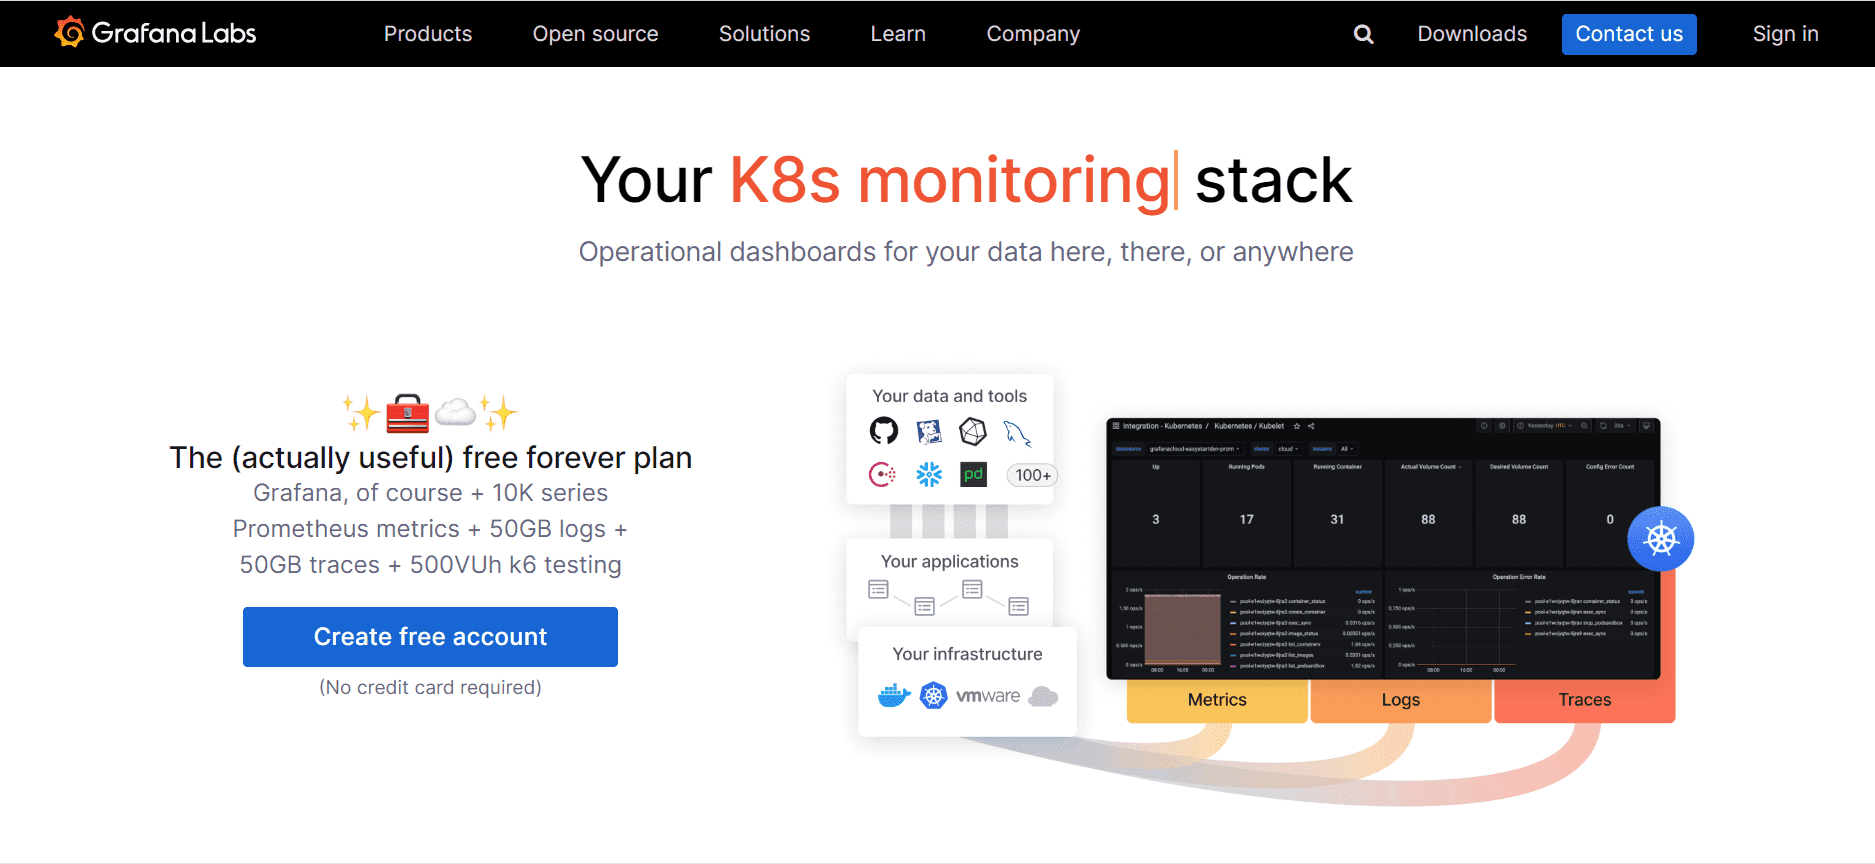
Grafana is one of the most widely used open source dashboard platforms for infrastructure, operational metrics, observability, and real-time monitoring. If your KPI dashboard needs to show fast-changing metrics, time-series trends, uptime, latency, error rates, or service health, Grafana is often the first tool considered.
Best for infrastructure, operational metrics, and real-time monitoring
Grafana is especially strong when KPIs are live and operational, such as:
API response time
System uptime
Queue depth
Throughput
Production line monitoring
Sensor or IoT metrics
Incident-oriented dashboards
Strengths in alerting, plugin ecosystem, and time-series visualization
Common advantages include:
Strong support for time-series data
Broad plugin and connector ecosystem
Flexible panel-based dashboards
Alerting capabilities for metric thresholds and incidents
Strong fit for technical operations environments
Trade-offs for business KPI storytelling and non-technical users
Grafana can certainly display business KPIs, but it is not always the easiest choice for executive or business-facing storytelling. Common trade-offs include:
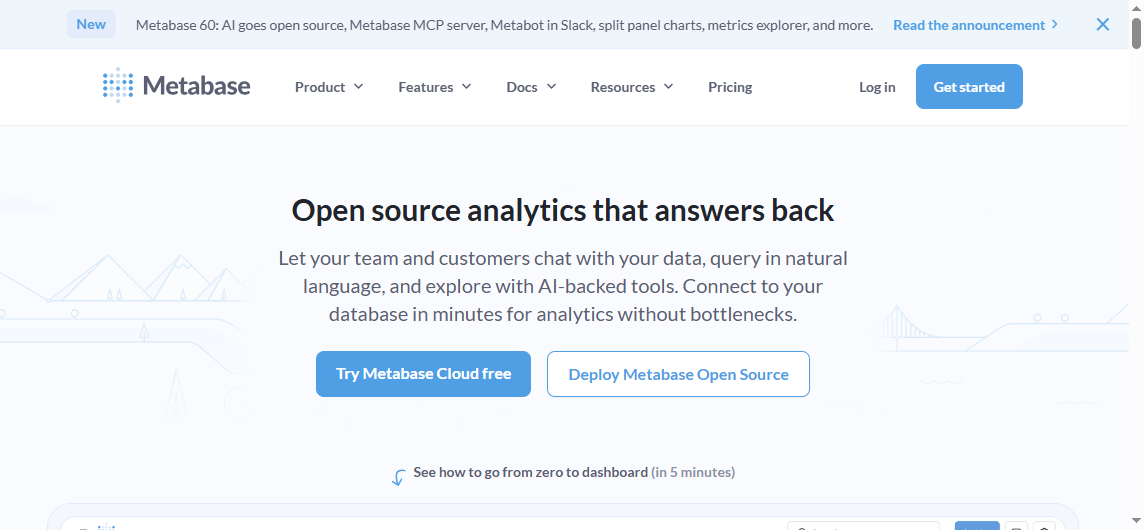
Metabase is often shortlisted by teams that want fast self-service dashboards without a heavy technical learning curve. It is widely appreciated for being approachable and relatively quick to launch.
Best for teams that want fast self-service dashboards with a gentle learning curve
Metabase is a strong fit for:
Startups
Small business analytics teams
Department dashboards
Teams with mixed technical ability
Organizations that want dashboards running quickly
Strengths in usability, query builder, and everyday business reporting
Key reasons teams like Metabase include:
Simple and clean interface
Friendly query builder for non-SQL users
Fast dashboard creation
Good support for routine business metrics
Easier adoption by non-technical stakeholders
This makes it well suited for dashboards around sales, marketing, customer success, and general operational KPIs.
Trade-offs in advanced customization and highly complex analytics workflows
Metabase can feel limiting when teams need:
Deeply customized dashboard behavior
Very advanced analytics workflows
Complex semantic modeling
Heavily engineered multi-layer governance
Rich developer extensibility compared with more technical platforms
For many organizations, that is an acceptable trade-off in exchange for speed and simplicity.
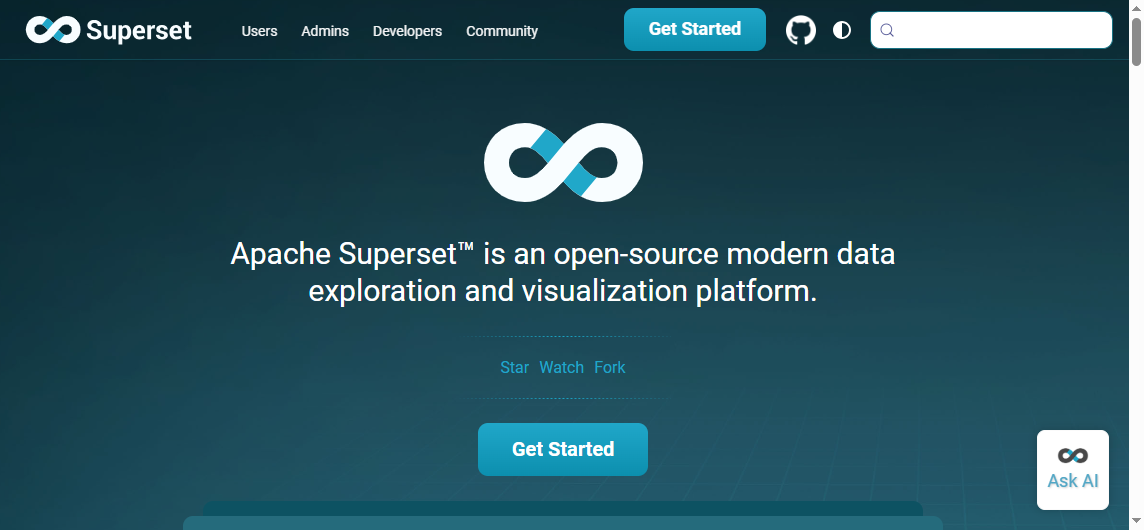
Apache Superset is often viewed as one of the most capable open source BI and dashboarding platforms for organizations that need flexibility, scale, and SQL-centric exploration.
Best for organizations needing flexible open source data visualization and dashboarding at scale
Superset is attractive when you need:
Broad chart variety
Warehouse-based analytics
SQL exploration
More advanced dashboarding flexibility
Open source BI with room to scale
Strengths in SQL-centric exploration, chart variety, and extensibility
Its strengths usually include:
Strong SQL orientation
Broad visualization options
Extensible architecture
Good fit for analytics teams
Suitable for larger and more complex data environments
Trade-offs in setup complexity and admin overhead
The main caution with Superset is operational complexity. Compared with simpler tools, it often requires:
More setup work
More tuning and administration
Stronger technical ownership
More deliberate governance to support wider business adoption
Superset can be powerful, but it is rarely the lightest-weight option.
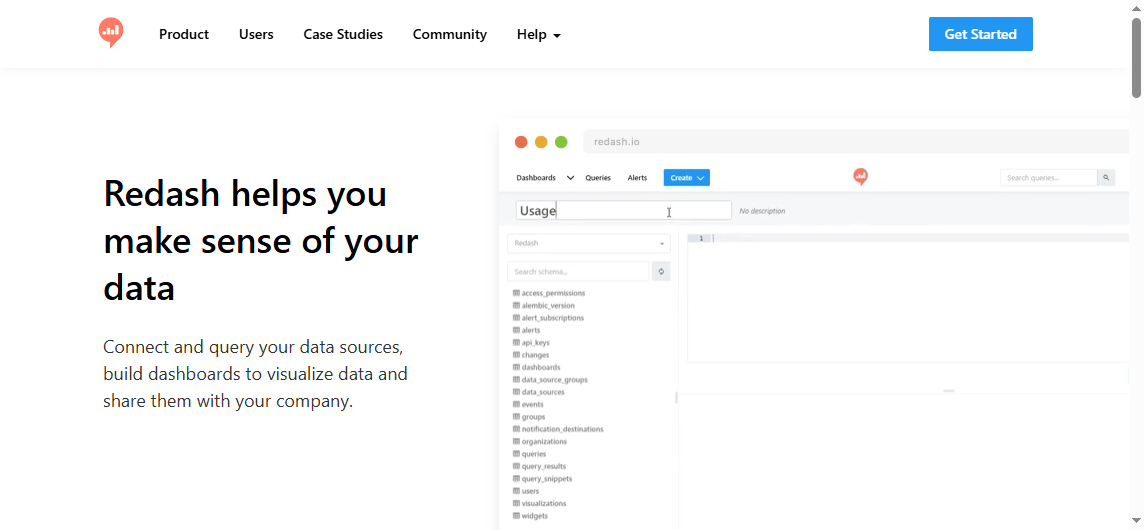
Redash
Redash became popular for a straightforward reason: it makes SQL querying and dashboard sharing relatively simple for teams that prefer lightweight analytics tooling.
Best for SQL-savvy teams that want lightweight dashboarding and query sharing
Redash fits best when your team wants:
Direct SQL-based analysis
Quick visualizations
Shared query workflows
Lightweight internal dashboards
Multi-source access without a heavy BI footprint
Strengths in simplicity, collaborative querying, and multi-source access
Redash is often appreciated for:
A simple query-first workflow
Easy sharing of SQL and dashboard outputs
Practical dashboarding for analyst-led teams
Relatively low friction for small internal use cases
Trade-offs in modernization pace and broader BI depth
Compared with more actively evolving platforms, Redash may feel less future-facing for some buyers. It can also be less suitable when teams need:
Beyond the four most compared tools, three additional options deserve attention in 2026.
Lightdash
Lightdash is especially relevant for teams that already use dbt and want a dashboard layer aligned to a modern analytics engineering workflow. It is less universal than Metabase or Grafana, but very relevant in warehouse-first environments.
Best fit:
dbt-centric teams
Analytics engineering workflows
Organizations that want metrics defined closer to transformation logic
Evidence
Evidence is a good option for code-first analytics and embedded storytelling. It is less about drag-and-drop dashboarding for broad business users and more about creating tailored, developer-controlled analytical experiences.
Kibana remains relevant for organizations already invested in Elasticsearch and focused on logs, events, security analysis, and operational analytics. It is useful, but not as general-purpose for KPI dashboarding across business functions.
Best fit:
Elastic-centric environments
Log analytics
Security and event monitoring
Operational search-driven dashboards
Where simpler KPI dashboard app templates or niche tools may fit better than full BI platforms
Not every team needs a full BI environment. In some cases, simpler tools or templates are enough for:
TV dashboards
Single-team scoreboards
Basic KPI displays
Public internal wallboards
One-domain operational tracking
If your use case is narrow and low-risk, a lighter tool may be easier to maintain than a broad BI platform.
Best open source KPI solutions in 2026 by use case
Best for startups and small teams
For startups and smaller teams, the biggest priorities are usually:
Fast setup
Low maintenance
Usable dashboards without a large BI team
Affordable scaling
Best fit: Metabase Runner-up: Redash
Metabase is usually the stronger option when business users want to build and consume dashboards quickly. Redash can work well when the team is more SQL-driven and wants a lighter workflow.
Best for product, operations, and engineering dashboards
For live metrics, technical observability, and operational alerting, the requirements are different. You need:
Real-time updates
Time-series visualization
Alerting
Technical integrations
Fast incident visibility
Best fit: Grafana Runner-up: Kibana for Elastic-specific environments
Grafana is the clearest choice when the dashboard is part of an operational workflow, not just a management summary.
Best for business intelligence and cross-functional reporting
When KPI dashboards are used by executives, analysts, and non-technical stakeholders, usability and broad business readability matter more.
Best fit: Metabase for simplicity Runner-up: Apache Superset for flexibility and scale
Metabase wins on accessibility. Superset wins when organizations need more depth and can support the complexity.
Best for customization and embedded analytics
If your goal is not just internal dashboards but tailored, productized, or embedded analytical experiences, developer control becomes more important.
Best fit: Evidence Runner-up: Superset or Lightdash depending on stack and team model
These tools are stronger when a technical team is actively shaping the end-user experience.
Pros, cons, and final recommendation
Pros and cons summary table
Tool
Pros
Cons
Ideal team fit
Grafana
Excellent for real-time KPIs, strong alerting, broad integrations
Less intuitive for non-technical business users, weaker for formal reporting
DevOps, ops, engineering, live metrics teams
Metabase
Easy to use, fast to deploy, good for self-service dashboards
Less flexible for highly complex analytics or advanced customization
Startups, SMBs, business teams, general analytics
Apache Superset
Powerful, extensible, broad visualization options
Higher setup complexity, more admin overhead
Larger data teams, technical BI environments
Redash
Simple SQL workflow, lightweight, practical for analysts
Narrower BI depth, long-term fit should be evaluated carefully
SQL-savvy teams, internal analytics users
Lightdash
Good fit for dbt workflows, modern analytics stack alignment
Separate monitoring dashboards from management reporting.
A tool that works well for live engineering KPIs may not be the best choice for executive reporting.
Map dashboard ownership before selecting a platform.
If business users need self-service, favor usability. If developers own the stack, flexibility may matter more.
Test one real KPI workflow, not just sample charts.
Build an actual dashboard with your permissions, filters, refresh needs, and stakeholder audience.
Evaluate distribution needs early.
Ask whether your users just view dashboards or also need scheduled reports, printable outputs, or embedded portal access.
Plan for governance from the beginning.
Even small KPI programs become hard to manage when teams create duplicated metrics and inconsistent definitions.
This is where the conversation often shifts from pure open source dashboarding to broader reporting architecture.
Where FineReport fits for KPI reporting and enterprise reporting workflows
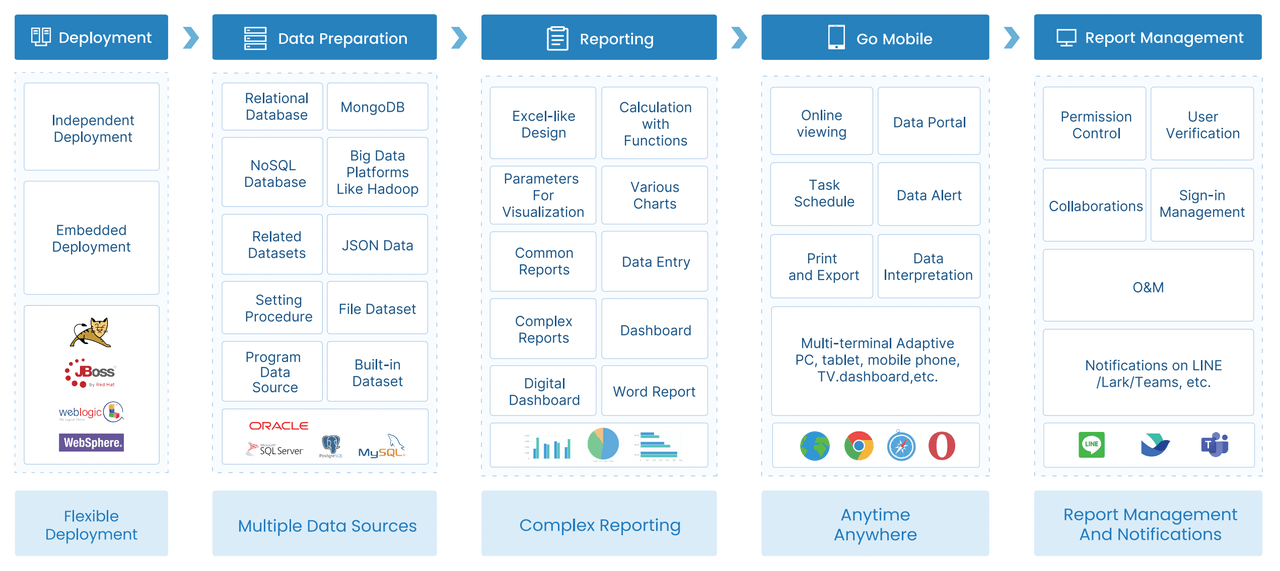
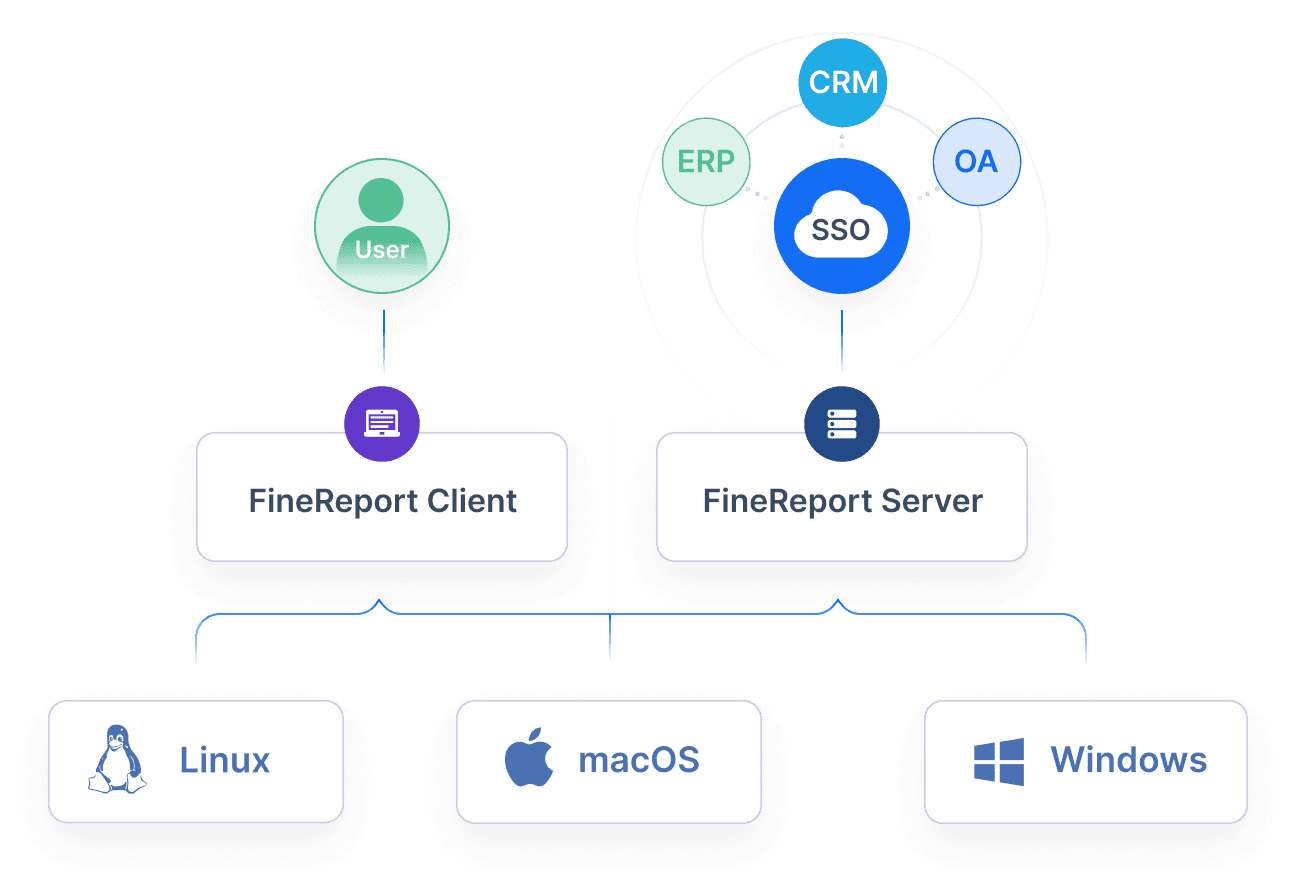
Tools like Grafana, Metabase, Superset, and Redash are widely used for dashboards, visualization, and technical or analyst-led KPI tracking. But teams with complex reporting workflows may also need a dedicated enterprise reporting platform like FineReport.
FineReport is especially relevant when KPI dashboards are only one part of the reporting process and the organization also needs:
That makes it a practical option for organizations that need not just KPI visibility, but also operational reporting for finance, manufacturing, logistics, sales, and management teams.
For example, an organization may use dashboards for KPI monitoring but still require:
or workflow-style forms for data collection and approvals.
Those needs are often outside the core strengths of open source dashboard tools.
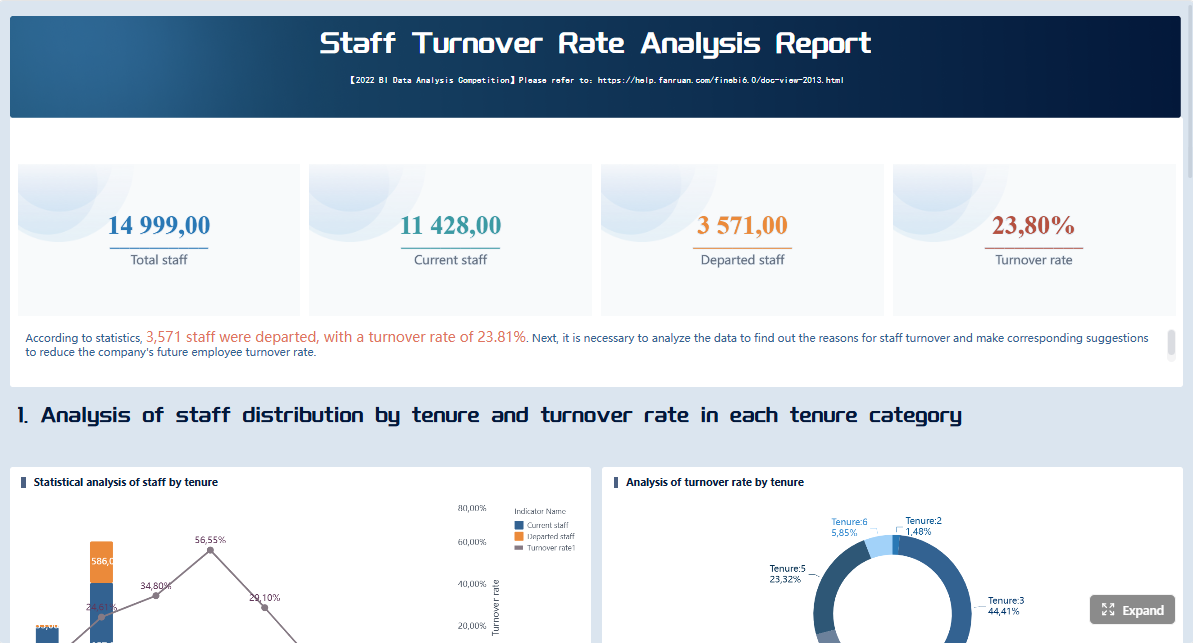
Get Ready-to-Use Dashboard and Report Templates in Fine Gallery
If your team is comparing open source KPI dashboards primarily for visualization, one of the tools above may be enough. If you are also trying to standardize recurring reports, automate distribution, support parameter-based query reports, or unify dashboards with operational reporting, FineReport is worth evaluating alongside them.
Final verdict
There is no single winner for every open source KPI dashboard use case in 2026.
Which tool wins for ease of use?
Metabase is the strongest choice for teams that want quick adoption, approachable self-service, and lower setup friction.
Which tool wins for flexibility?
Apache Superset offers the broadest open source BI flexibility in this group, especially for technical teams willing to manage more complexity.
Which tool wins for real-time operational KPI visibility?
Grafana remains the leading choice for live metrics, technical observability, and alert-driven dashboards.
Which is the best all-around choice in 2026?
For a broad mix of business KPI dashboard needs, Metabase is often the most practical all-around starting point because it balances usability and speed well. But that answer changes quickly if your needs lean toward observability, heavy SQL exploration, or enterprise reporting workflows.
The best decision is to choose the tool that matches your team skills, KPI style, reporting cadence, and governance needs, not the one with the loudest community buzz.
And if your KPI initiative is expanding beyond dashboards into structured operational reporting, pixel-perfect outputs, or enterprise-wide distribution, it is wise to evaluate a dedicated reporting platform such as FineReport in parallel.
There is no single best option for every team. Grafana is strongest for real-time monitoring, Metabase is usually easiest for business users, Superset fits larger analytics-heavy environments, and Redash works best for lightweight SQL-driven dashboards.
Start with your primary use case and user type. Choose Grafana for operational metrics, Metabase for self-service business reporting, Superset for flexible BI at scale, and Redash for simple SQL querying and dashboard sharing.
The software may be free to license, but deployment, maintenance, security, and admin work still create real costs. Open source is often cheaper at scale, but it usually requires more internal technical ownership.
Metabase is generally the most approachable for non-technical teams because it has a simpler interface and faster setup. Superset and Grafana offer more flexibility, but they usually require more technical skill to manage well.
They can support enterprise dashboards, but many open source tools are better at interactive dashboards than pixel-perfect or paginated reporting. Organizations with strict governance, formatted reports, or low-maintenance requirements may need to evaluate those gaps carefully.
Product Trial
FineReport
Pixel-perfect reports · Interactive dashboards · Easy data entry · Digital twins


 Grafana is one of the most widely used open source dashboard platforms for infrastructure, operational metrics, observability, and real-time monitoring. If your
 Metabase is often shortlisted by teams that want fast self-service dashboards without a heavy technical learning curve. It is widely appreciated for being approachable and relatively quick to launch.
 Apache Superset is often viewed as one of the most capable open source BI and dashboarding platforms for organizations that need flexibility, scale, and SQL-centric exploration.