Writing a report doesn’t have to feel overwhelming. By using a clear guide, you can simplify the process and stay on track. You only need to follow specific steps to create a professional document that meets its purpose. Whether you’re summarizing data or presenting findings, understanding how to write a report helps you communicate clearly and effectively.
Tip: Start by focusing on who will read your report. Tailoring your writing to their needs makes it more impactful.
Defining the purpose of your report is the first and most critical step in report writing. It acts as the guiding principle for the entire document, shaping its structure, content, and tone. Without a clear purpose, your report risks becoming unfocused and failing to meet its objectives.
Here’s why identifying the purpose is essential:
Research highlights that every professional report relies on key components to fulfill its purpose. These include:
| Key Component | Description |
|---|---|
| Introduction | Outlines the research problem, objectives, and significance, guiding the reader through the report. |
| Methodology | Details the research methods used, adding credibility to the findings. |
| Results | Presents data clearly, often using visual aids for better comprehension. |
| Discussion | Interprets findings in relation to research questions and broader context. |
| Conclusion | Summarizes key insights and proposes recommendations, reinforcing the report's purpose. |
By focusing on these elements, you can ensure your report delivers value and achieves its intended goals.
To align your report’s purpose with its objectives, you need a structured approach. Start by identifying what the report aims to achieve. Is it meant to inform, persuade, or analyze? Once you know this, you can tailor your content accordingly.
Follow these strategies to ensure alignment:
For example, if your goal is to analyze risks, you might assess their likelihood and impact on organizational goals. This ensures your report remains focused and actionable.
By defining the purpose and aligning it with objectives, you create a roadmap for success. This step lays the foundation for the remaining steps in how to write a report effectively.
Understanding your audience in Malaysia is a cornerstone of effective report writing. When you know who will read your report, you can tailor its content, tone, and structure to meet their expectations. This ensures your message resonates and achieves its intended purpose.
Studies show that audience characteristics significantly impact the quality of data and insights presented. For example:
| Audience Characteristic | Impact on Data Quality |
|---|---|
| Mobile Survey-Taking | Respondents using mobile devices were nearly one-third more likely to provide lower quality data. |
| Education Level | A bell-shaped curve was observed; least and most educated individuals provided the lowest quality data. |
| Political Leanings | Extremely liberal or conservative respondents were 19% less likely to provide quality answers. |
By analyzing your audience in Malaysia, you can avoid these pitfalls and create a report that is both relevant and impactful. Tailoring your message to their needs also enhances clarity and engagement, making your report more effective.
Adapting your tone and content ensures your report appeals to diverse readership profiles. Different audiences in Malaysia have unique preferences, and aligning your writing with these preferences improves comprehension and engagement.
| Audience Category | Characteristics | Preferred Tone/Content |
|---|---|---|
| Lay | No special knowledge; connects with human interest; needs background information | More descriptive, engaging, and visual content |
| Managerial | May have some knowledge; needs information for decision-making | Factual, statistical, and advisory content |
| Expert | Demanding in knowledge and presentation; requires technical details | Elaborate, technical, and well-cited content |
To adapt effectively, gather data about your audience’s demographics, preferences, and expectations. Use tools like sign-up forms or website analytics to understand their interests. This helps you craft a message that resonates with their unique needs.
For example, if your audience in Malaysia includes managers, focus on actionable insights and concise summaries. If they are experts, provide detailed analysis and technical depth. By aligning tone and content with audience expectations, you ensure your report remains relevant and impactful.
Gathering and organizing information is a critical step in report writing. It ensures your report is accurate, comprehensive, and well-structured. By using effective research techniques and leveraging advanced tools, you can streamline this process and create a solid foundation for your report.
To collect reliable data, you need to adopt proven research methodologies. These techniques help ensure the accuracy and relevance of the information you gather. Here are some effective methods:
For example, longitudinal designs track changes over time, while cross-sectional studies provide quick snapshots of a population. Both methods offer unique insights depending on your report’s objectives. By combining these techniques, you can gather data that serves as a strong foundation for informed decision-making.
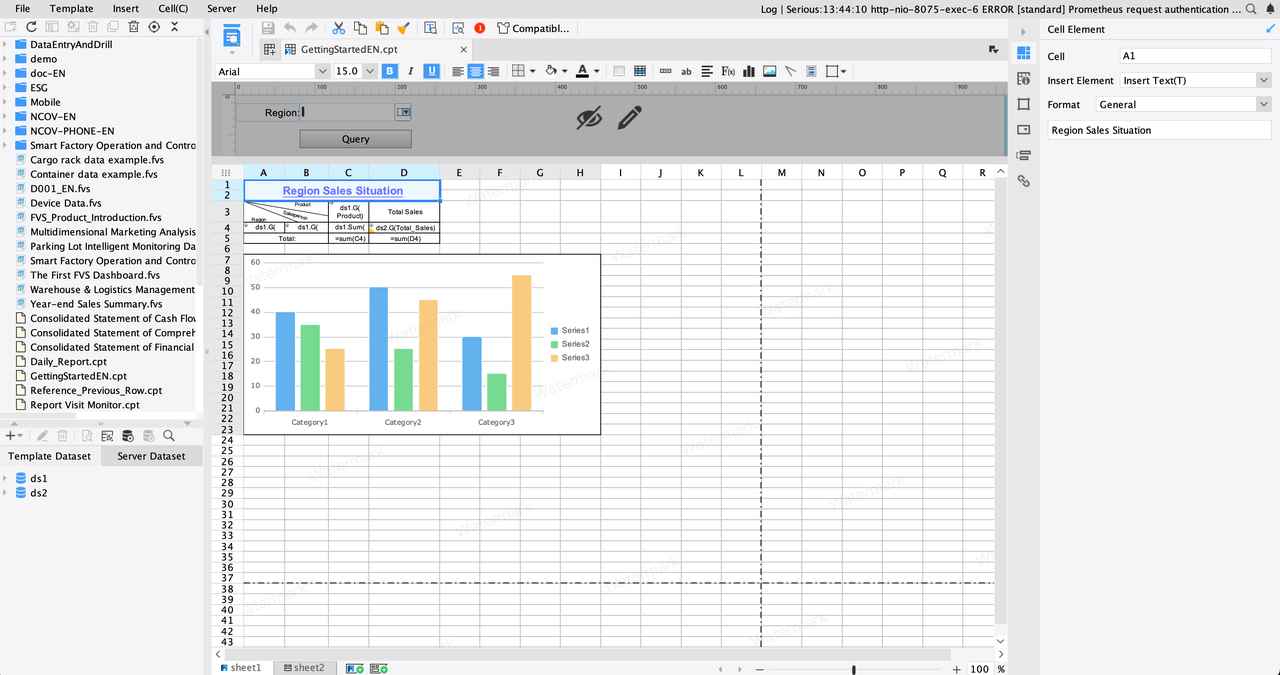
Once you’ve collected your data, organizing it effectively is the next step. Tools like FineReport simplify this process by offering advanced features for data integration and visualization. FineReport connects to multiple data sources, allowing you to manage information seamlessly.
For instance, FineReport has been used in real-world scenarios to address challenges like synchronizing data across departments. It simplifies data preprocessing and enables API integration for quick sharing. Additionally, its self-service business intelligence platform transforms raw data into actionable insights, making it easier to analyze trends and patterns.
By using tools like FineReport, you can automate repetitive tasks, reduce errors, and focus on interpreting your findings. This ensures your report remains professional and impactful, aligning with your objectives.

A structured outline is the backbone of effective report writing. It ensures your ideas flow logically, making it easier for readers to follow and understand your message. Think of the outline as a roadmap that guides both you and your audience in Malaysia through the report.
To create a clear and concise outline, follow these steps:
Here’s a simple template to help you get started:
| Step | Description |
|---|---|
| 1 | Identify the objective of the report, defining what you wish to convey. |
| 2 | Gather relevant data and insights from various sources. |
| 3 | Analyze the data to identify key themes and trends. |
| 4 | Present findings clearly and offer actionable insights based on evidence. |
By refining your outline, you can enhance clarity and ensure your report flows seamlessly. This approach improves readability and keeps your audience in Malaysia engaged.
Every comprehensive report follows a standard structure to maintain professionalism and clarity. Including these key sections ensures your report meets its purpose and addresses your audience’s needs in Malaysia:
| Section | Description |
|---|---|
| Title Page | Includes the report’s title, author, submission date, and client name for a professional introduction. |
| Table of Contents | Lists all sections and page numbers for easy navigation. |
| Executive Summary | Summarizes key findings, methodologies, and recommendations for a quick overview. |
| Introduction | Explains the analysis purpose, background, and objectives. |
| Data Collection | Describes data sources, gathering methods, and limitations for transparency. |
| Methodology | Outlines techniques and tools used for analysis, including reasoning behind choices. |
| Data Analysis | Presents results with charts/graphs to illustrate trends and patterns. |
| Findings and Insights | Interprets results in context, focusing on implications for decision-making. |
| Recommendations | Provides actionable steps based on analysis findings. |
| Conclusion | Summarizes the report and emphasizes the significance of findings. |
| Appendices | Includes additional supporting information not in the main body. |
| References | Lists all data sources and citations for credibility. |
Including these sections ensures your report is comprehensive and professional. A structured outline not only improves clarity but also enhances the overall flow of your report, making it more impactful.
The introduction sets the stage for your report. It provides context, outlines objectives, and grabs the reader's attention. A strong introduction ensures your audience in Malaysia stays engaged and understands the purpose of your analysis.
To craft an engaging introduction:
A well-structured introduction guides your audience in Malaysia through the findings logically. For example, you can use storytelling with data to make the content relatable. By contextualizing your analysis, you help readers understand its relevance. This approach not only enhances engagement but also ensures clarity from the start.
The main body is where you present your findings and support them with evidence. To make your arguments logical and compelling, structure this section carefully.
Follow these steps to draft the content effectively:
For example, a classic story arc can help you organize your narrative. Start with the problem, present the data, and conclude with actionable insights. Relatable examples or case studies can also appeal to emotions and make your report more impactful.
The conclusion is your final opportunity to leave a lasting impression. It should summarize the key findings and emphasize their significance.
To write an effective conclusion:
Keep your conclusion concise and avoid introducing new information. Instead, focus on reinforcing the main points. A well-crafted conclusion ties everything together and ensures your report achieves its purpose.
Interpreting data is a critical step in ensuring your report achieves its purpose. This process involves analyzing the information you’ve gathered and connecting it to the objectives of your report. By doing so, you provide meaningful insights that guide decision-making and add value to your findings.
To interpret data effectively, consider using both qualitative and quantitative methods. These approaches help you uncover patterns, trends, and relationships within your data. For example:
| Method Type | Description |
|---|---|
| Qualitative | Analyzes non-numerical data to identify themes and patterns. Examples include thematic and content analysis. |
| Quantitative | Focuses on numerical data to uncover statistical patterns. Examples include descriptive and inferential statistics. |
You can also follow these steps to ensure your analysis supports your report’s purpose:

For instance, thematic analysis can help you identify recurring themes in customer feedback, while descriptive statistics can highlight sales trends over time. These methods ensure your findings remain relevant and actionable.
Tip: Always choose statistical techniques that align with your report’s objectives. Misusing methods can lead to inaccurate conclusions and undermine your report’s credibility.
Summarizing insights is the final step in drafting the content of your report. This involves condensing your findings into clear, concise statements that highlight their significance. A well-written summary ensures your audience in Malaysia understands the key takeaways without feeling overwhelmed by details.
To summarize effectively, focus on these elements:
| Statistical Measure | Description |
|---|---|
| Measures of Central Tendency | Summarizes a variable’s key characteristics, such as mean or median. |
| Measures of Variability | Describes data spread, including range and standard deviation. |
| Graphical Representations | Visual tools like histograms or line graphs to depict trends clearly. |
For example, a box plot can reveal data distribution, while a line graph can show performance trends over time. Combining these tools with concise language ensures your summary remains impactful.
Note: Always pair numerical summaries with visual aids. This combination makes your insights easier to understand and more engaging for your audience in Malaysia.
By interpreting data thoughtfully and summarizing insights effectively, you ensure your report delivers value and achieves its purpose.
Editing and proofreading are essential steps in creating a polished and professional report. These processes help eliminate errors, improve clarity, and ensure your document meets its objectives. By focusing on common mistakes and leveraging advanced tools, you can refine your report and enhance its impact.
Even the most experienced writers can overlook errors during the editing process. Studies show that professional proofreaders catch about 95% of mistakes on a first pass, leaving room for improvement. For example, in a 300-page report, approximately 80 errors might remain uncorrected. This highlights the importance of thorough proofreading to minimize inaccuracies.
Here are some common errors to watch for:
Proofreading multiple times and using tools to catch overlooked errors ensures your report remains accurate and professional.
Formatting consistency plays a crucial role in making your report visually appealing and easy to read. Tools like FineReport simplify this process by offering advanced features that streamline editing and formatting tasks.
FineReport provides several functionalities to enhance formatting consistency:
| Metric Description | Evidence |
|---|---|
| Style Editing | FineReport's style editing resembles Excel, enabling complex report formatting. |
| Data Validity Check | Supports backfill data validity checks to ensure data consistency. |
| Batch Cell Editing | Allows batch setting of cell elements, reducing modification costs. |
| Easy Access to Format Settings | Format settings are easily accessible, improving user experience. |
| Duplicate Name Detection | Detects duplicate or empty component names to prevent errors during template replacement. |
These features help you maintain uniformity across your report, saving time and reducing errors. For instance, batch cell editing allows you to update multiple elements simultaneously, ensuring consistent formatting throughout the document. Additionally, FineReport’s ability to detect duplicate names prevents template errors, enhancing overall accuracy.
By using tools like FineReport, you can focus on refining your content while ensuring your report looks professional and cohesive.
Finalizing your report involves refining its presentation to ensure it looks professional and communicates effectively. A polished format engages your audience in Malaysia and enhances the clarity of your message. To achieve this, follow these evidence-based design principles:
These practices help your report stand out while promoting equity and inclusivity. A well-formatted report also invites feedback, allowing you to improve as a presenter and researcher.
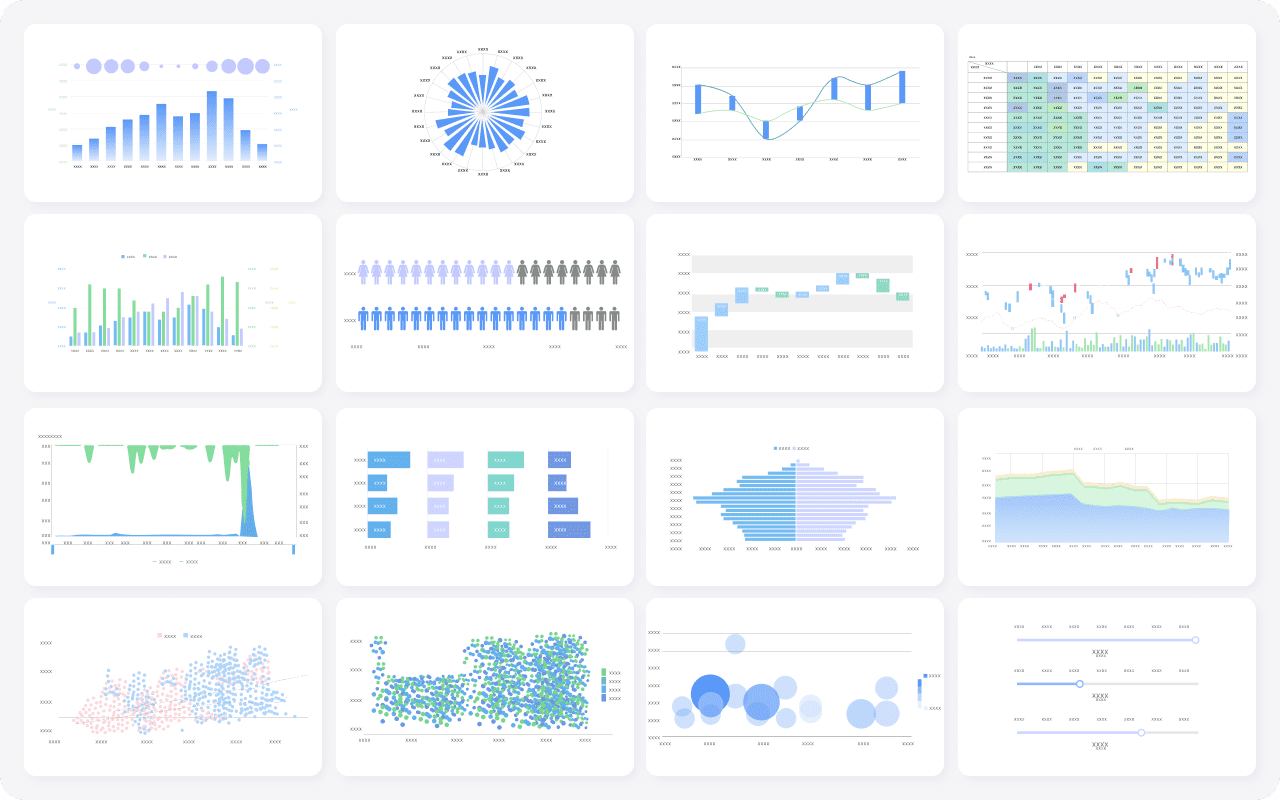
When formatting, focus on consistency. Align text, use uniform spacing, and ensure charts and tables complement the narrative. Visual aids like graphs and infographics simplify complex data, making it easier for your audience in Malaysia to retain key information.
Tip: Keep your formatting simple and clean. Overloading your report with decorative elements can distract readers from the core message.
FineReport offers advanced features that elevate your report’s presentation to a professional level. Its pixel-perfect reporting capabilities ensure every detail is accurately represented, which is essential for maintaining data integrity.
| Feature | Description |
|---|---|
| Fixed-format reports | Maintains consistent layouts across different outputs. |
| Pixel-perfect documents | Provides precise control over report design for accuracy. |
| Enhanced data visualization | Improves clarity and effectiveness of data representation. |
| Data entry forms | Facilitates user interaction with data, enhancing reporting capabilities. |
| Mobile reporting | Enables access to reports on various devices, increasing usability. |
FineReport simplifies formatting with tools like batch cell editing and style customization. These features save time and ensure uniformity across your report. For example, its ability to detect duplicate names prevents errors during template replacement, enhancing overall accuracy.
Launched in 2006, FineReport addressed limitations of traditional reporting methods like Excel. It introduced pixel-perfect designs to meet the demand for high-precision reporting. This innovation ensures your report not only looks professional but also delivers actionable insights effectively.

By leveraging FineReport, you can create visually appealing reports that resonate with your audience in Malaysia and meet professional standards.
Writing a report becomes easier when you follow a structured approach. These 8 steps guide you from defining your purpose to finalizing your document. By focusing on your audience in Malaysia and using tools like FineReport, you can create professional and impactful reports. Start applying these steps today to master how to write a report. Each report you complete will enhance your skills and boost your confidence.
Tip: Practice regularly to refine your writing and make your reports even more effective.
Click the banner below to try FineReport for free and empower your enterprise to transform data into productivity!

The Author
Lewis
Senior Data Analyst at FanRuan
Related Articles

Top 10 Best Automation Reporting Tool Picks for Businesses
Compare the top 10 best automation reporting tool options to streamline business data, automate reports, and boost decision-making efficiency.
Lewis
Jan 03, 2026

Top 10 Reporting Systems and Tools for Businesses
See the top 10 reporting systems that help businesses automate data, build dashboards, and improve decision-making with real-time analytics.
Lewis
Jan 03, 2026

What is integrated reporting and why is it important
Integrated reporting combines financial and non-financial data, offering a full view of value creation, transparency, and stakeholder trust.
Lewis
Dec 12, 2025