You will see four main types of financial statements. These are the balance sheet, income statement, cash flow statement, and statement of changes in equity. If you know how to read these reports, you can understand a company’s financial health. The table below shows that each statement has its own job:
Lists cash coming in and going out, showing how well the company handles money.
When you look at financial statements examples, you can make smarter choices and notice patterns. Tools like FineReport help everyone with reporting and analysis.
Almost every business uses financial statements. These reports show how a company handles money. The financial statements definition is easy to understand. They are papers that sum up what a company does with its money. You can see things like assets, debts, income, and cash flow in these papers. Each statement shows a different part of the company’s finances. When you look at all types of financial statements, you see how a business works.
Tip: If you want to know about a company’s financial health, learn what financial statements mean first. This makes reading and comparing reports much easier.
Why Financial Statements Matter
Financial statements are important in business. You use them to check money coming in and going out. They help you see if a company earns or loses money. These reports also show how much cash a company has and how it spends money. When you look at financial statements, you can find patterns and make smarter choices.
Here are some main jobs of financial statements in business:
You use them to make smart choices about investing and lending.
You need to look at several financial statements together to really know a company’s financial health.
Modern tools like FineReport help you manage and study financial data. You can make reports fast and see results right away. This helps you stay organized and make decisions quickly.
Who Uses Financial Statements
Lots of people use financial statements. Managers, investors, and lenders all look at these reports. Managers use them to plan budgets and check progress. Investors use financial statements to decide if they should buy shares. Lenders check them before giving loans. Government agencies also use these reports to make sure companies follow rules.
You can use digital tools like FineReport to share financial statements with your team. This makes it easy for everyone to see the same information. When you use these tools, you help your team talk better and help your business grow.
Types of Financial Statements Examples
Balance Sheet Overview
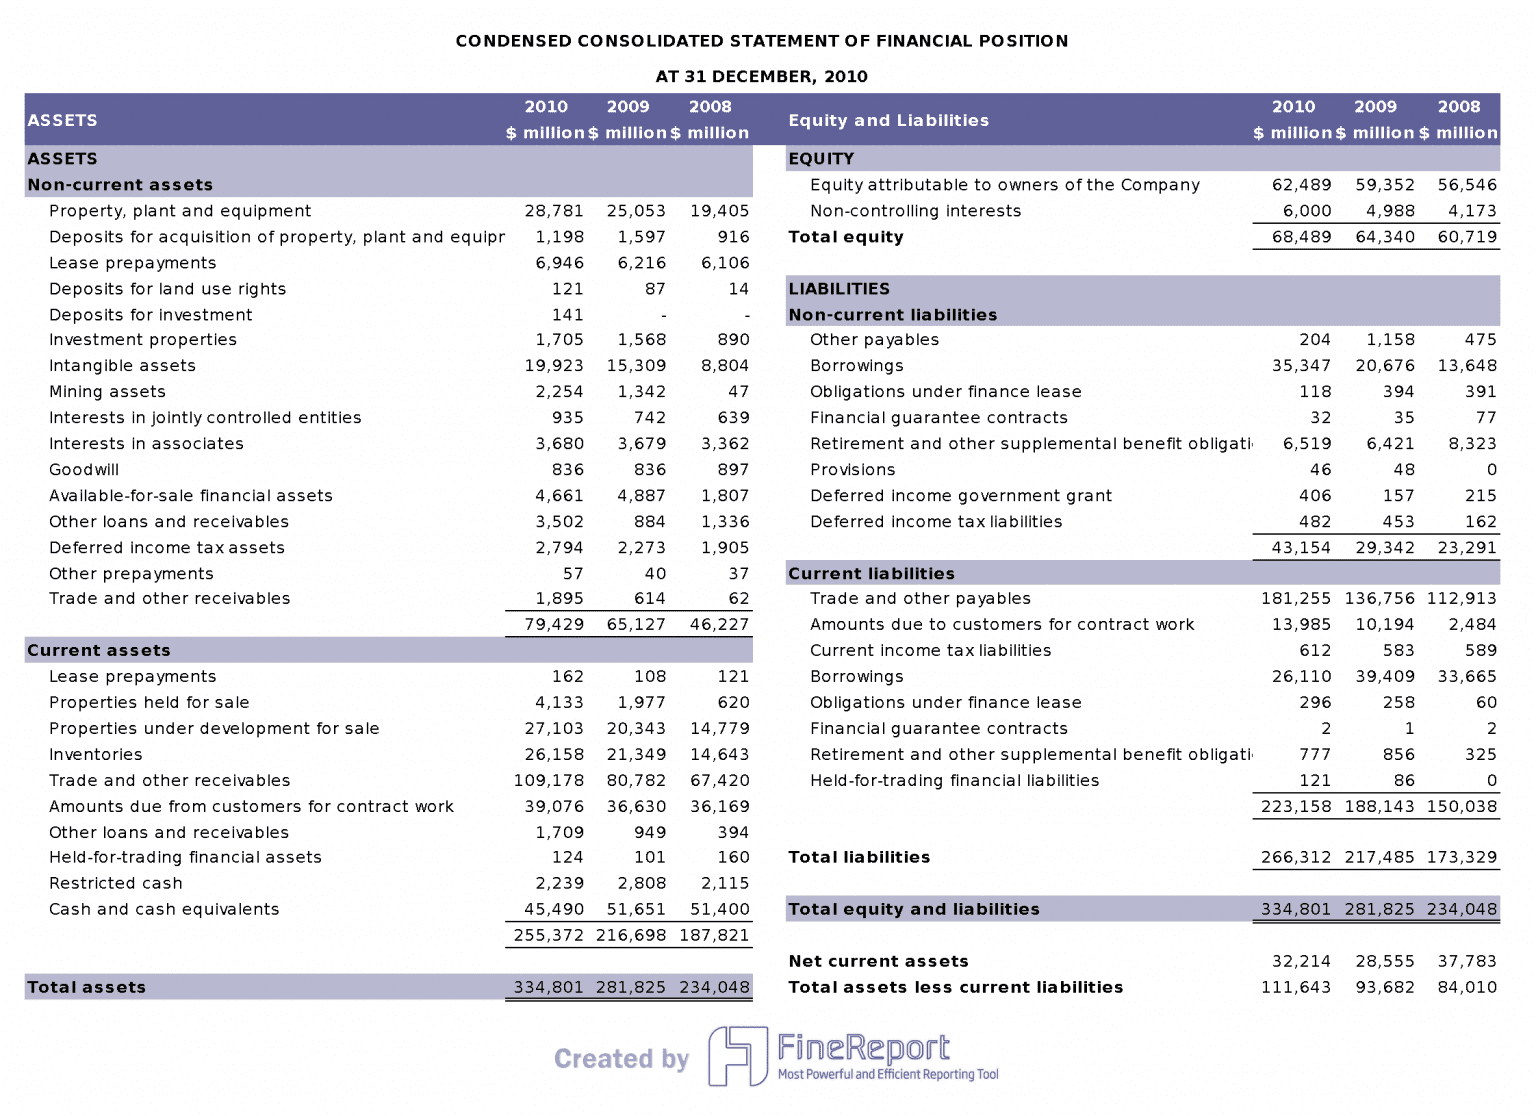
A balance sheet shows what a company owns and owes at one time. This report helps you see the company’s financial position. The balance sheet uses a formula: assets equal liabilities plus shareholders’ equity. Assets come first. They are split into current assets and non-current assets. Current assets are cash and things that turn into cash fast. Non-current assets are things like equipment and property.
Next, you see liabilities. These are the company’s debts and things it must pay. Liabilities are split into current and non-current types. Current liabilities must be paid in a year. Non-current liabilities are due after a year. The last part is shareholders’ equity. This shows what is left after paying debts. It is the company’s net worth.
Note: The balance sheet gives a quick look at the company’s financial health. You can check if the business has enough assets to pay its debts.
Here is a simple breakdown of the balance sheet structure:
Section
What It Shows
Assets
What the company owns (current and non-current)
Liabilities
What the company owes (current and non-current)
Shareholders' Equity
Net worth after debts are paid
When you look at financial statements examples, you see how companies set up their balance sheets. This helps you compare businesses and find trends in their financial statements.
Income Statement Overview
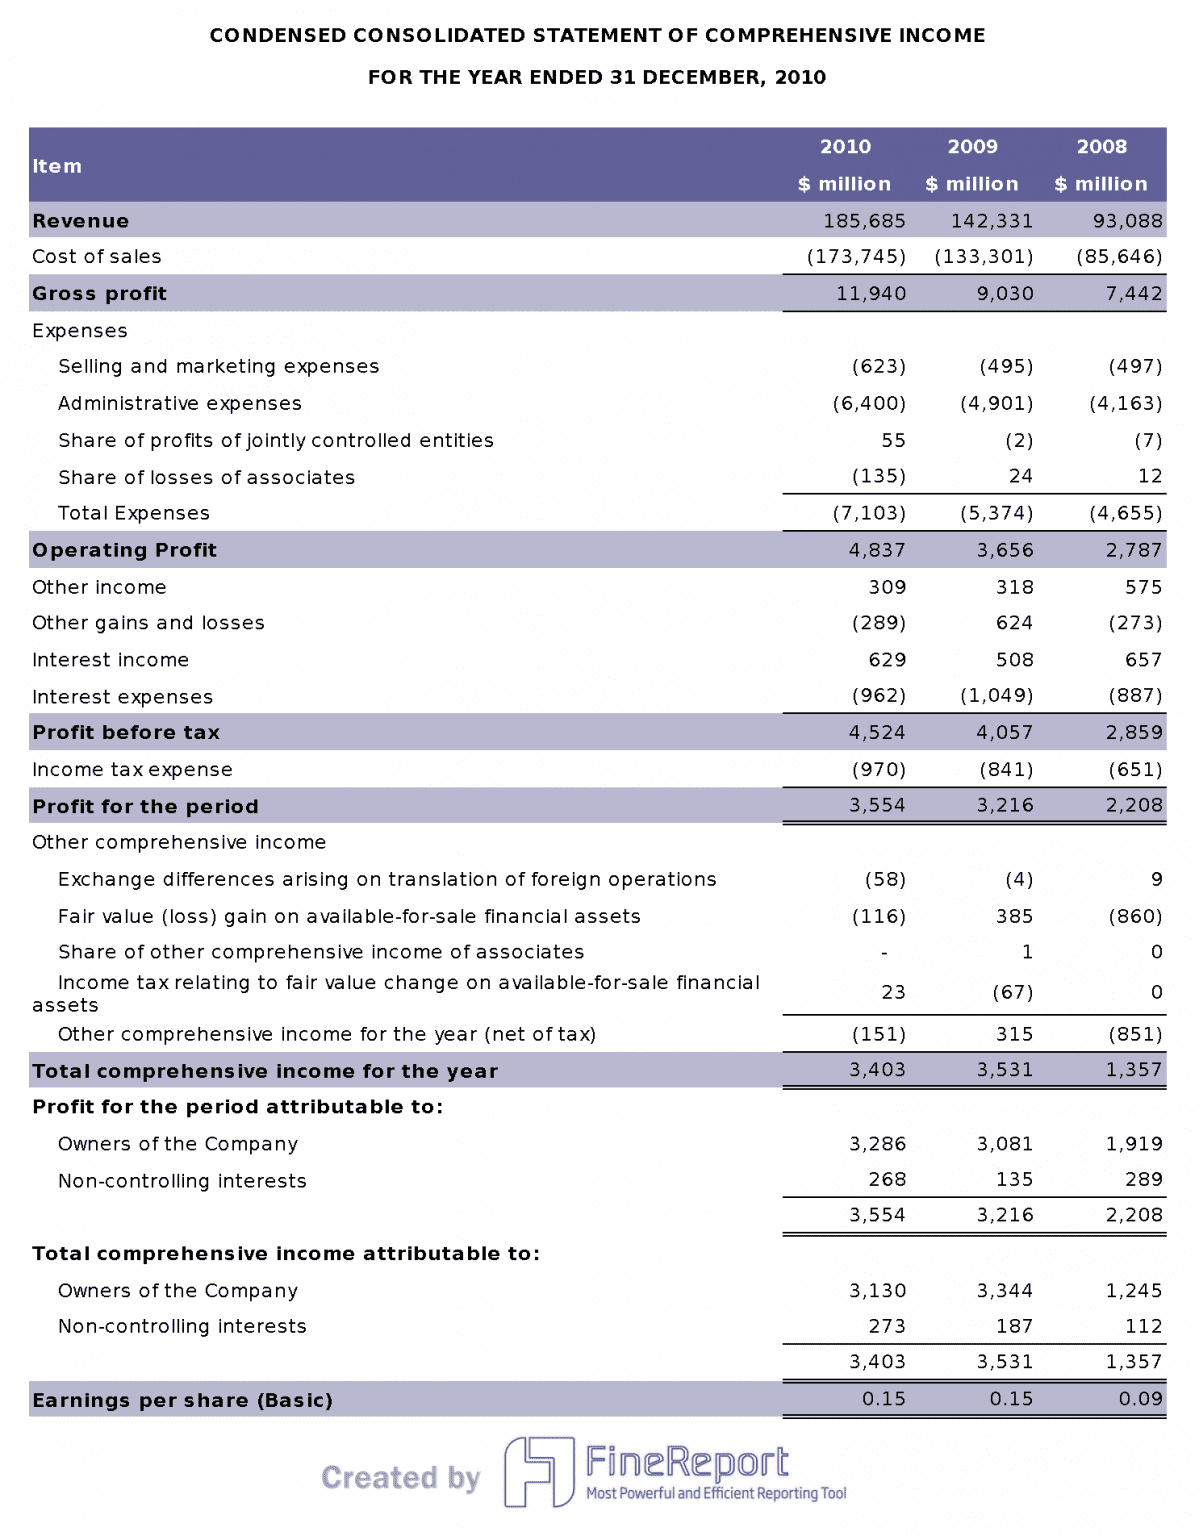
The income statement shows how much money a company makes and spends. You use this report to see if the company earns a profit. It starts with revenue, which is money from sales. Then, you see the cost of goods sold. This is the money spent to make or buy what is sold.
When you take away the cost of goods sold from revenue, you get gross profit. The income statement also lists operating expenses like salaries and rent. Depreciation and amortization show how assets lose value. Operating income, or EBIT, is what is left after these costs. You might also see non-operating revenues and expenses. These are not part of the main business.
Tip: The income statement helps you see if the company makes more money than it spends.
Financial statements examples show how companies use income statements to find trends in profits. You can use these reports to compare how a company does each year.
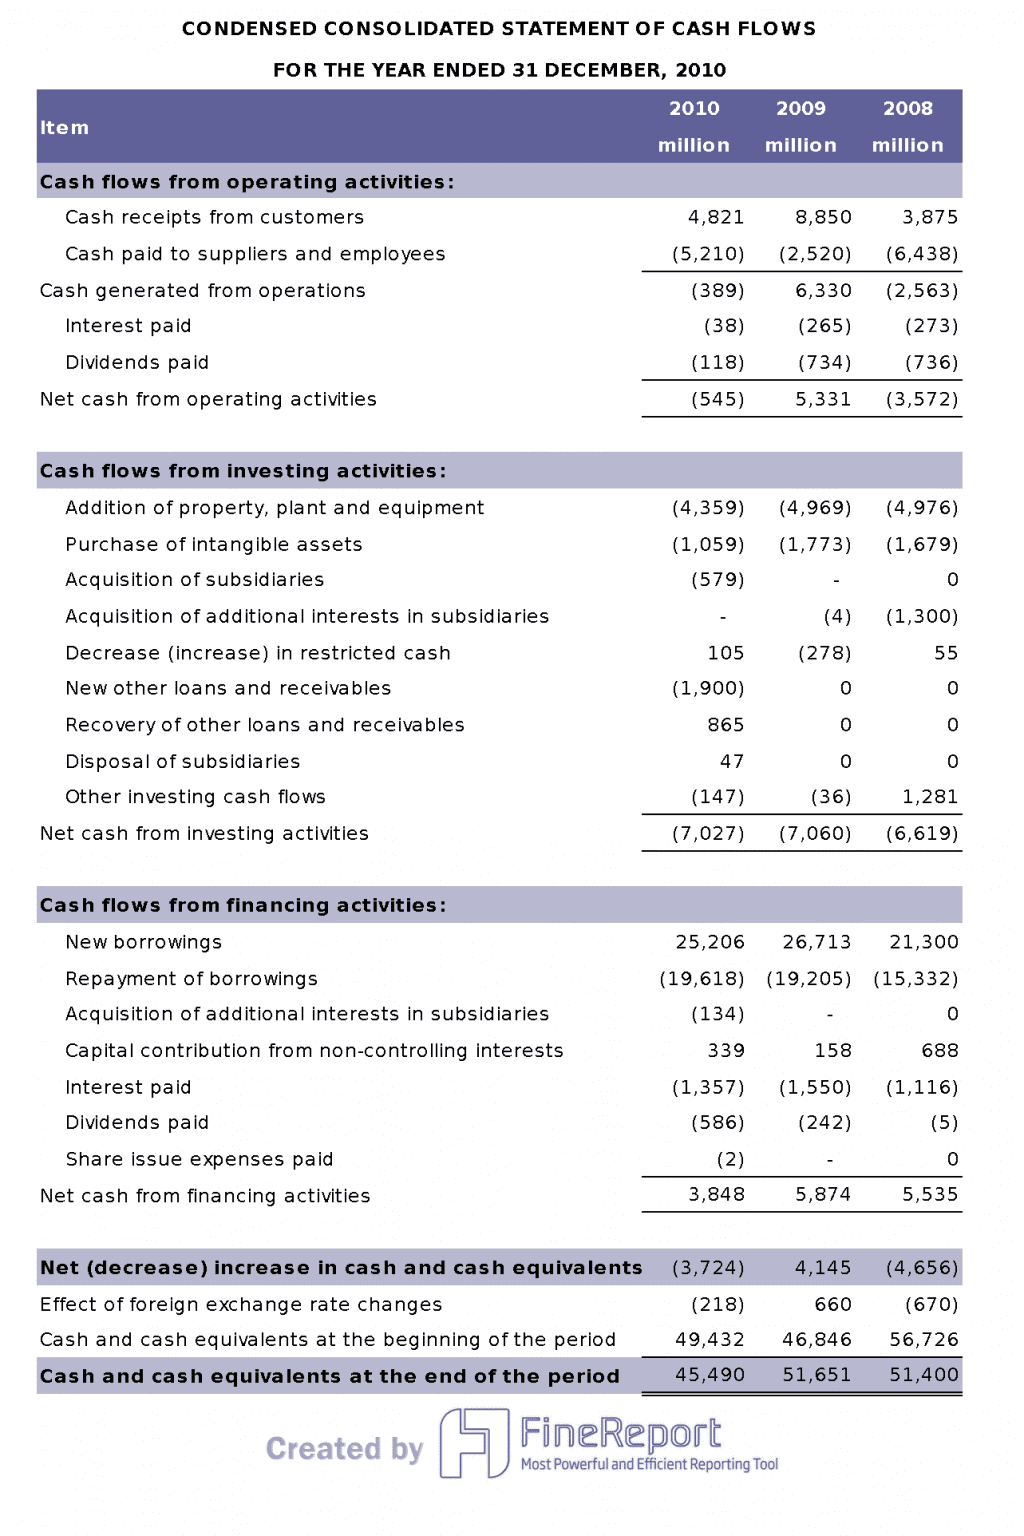
Operating activities include cash from sales, interest, taxes, and expenses. Investing activities are about buying or selling assets and making loans. Financing activities show cash from debt, equity, and dividends.
Callout: The cash flow statement helps you see if the company manages its money well. You can check if the business has enough cash to stay strong.
Here is a simple list of the cash flow statement’s main elements:
Operating activities: Cash from sales, interest, taxes, and expenses.
Investing activities: Cash from buying or selling assets and loans.
Financing activities: Cash from debt/equity financing and dividends.
When you look at financial statements examples, you see how companies use cash flow statements to check if they have enough cash and run well. These reports help you make better choices about investing or lending.
You can use all types of financial statements to get a full view of a company’s finances. Each statement has a special job in managing money and making decisions. The balance sheet shows financial health. The income statement tracks profits. The cash flow statement shows how well the company handles money. When you study financial statements examples, you learn how to compare and understand businesses.
Statement of Changes in Equity
You can use the statement of changes in equity to see how a company’s value changes over time. This report shows how the company’s equity moves during a set time. It helps you know what makes the owners’ share go up or down.
The statement of changes in equity lists all the main parts of equity. You can see how each part changes from the start to the end. This statement is important because it tells you why the company’s equity rises or falls. You can use it to follow profits, losses, and other things that change the owners’ share.
Here are the main items you will find in a statement of changes in equity:
Common stock: This shows who owns the company and who can vote.
Preferred stock: This kind of stock gets more claim to money and assets than common stock.
Retained earnings: These are the company’s total earnings after paying out dividends.
Treasury stock: These are shares the company bought back, which lowers the total equity.
Unrealized gains and losses: These show changes in the value of investments the company still owns.
Additional paid-up capital: This is extra money investors paid above the stock’s face value.
Note: The statement of changes in equity helps you see how profits, losses, and other events change the company’s net worth. You can use this to make better choices about investing or running the business.
When you look at all four main financial statements together, you get a full picture of a company’s financial health. The statement of changes in equity works with the balance sheet, income statement, and cash flow statement to show how a business grows and changes.
Financial Statements Examples
Balance Sheet Example
A balance sheet shows what a company owns and owes on a certain day. Here is a simple example for a small business:
Assets
Amount ($)
Liabilities and Equity
Amount ($)
Cash
10,000
Accounts Payable
5,000
Accounts Receivable
8,000
Bank Loan
7,000
Inventory
12,000
Shareholders’ Equity
18,000
Equipment
5,000
Total Assets
35,000
Total Liabilities and Equity
30,000
Note: The total assets must match the total of liabilities and equity. This keeps the balance sheet balanced.
You can look at real examples from companies like Tesla or Apple. Tesla’s 2019 balance sheet and Apple’s 2023 balance sheet show assets, liabilities, and shareholders’ equity. These reports help you compare companies and see how they handle money.
FineReport lets you make your own balance sheet. You can connect your data, set up the layout, and update numbers fast. This makes it easy to build a financial report that fits your business.
Income Statement Example
An income statement shows how much money a company earns and spends in a year. Here is a simple income statement for one year:
Tip: This statement helps you check if your business makes money or loses money.
You can make an income statement by listing all your revenues and taking away costs and expenses. FineReport helps you do this by connecting to your accounting app, loading your data, and showing trends with charts. You can track monthly revenue, compare profits and losses, and update your dashboard with new data. This makes your financial statements easy to read and share.
Cash Flow Statement Example
A cash flow statement shows how cash moves in and out of your business. Here is a simple example:
Operating Activities:
Cash from sales: $40,000
Cash paid to suppliers: ($15,000)
Cash paid for salaries: ($10,000)
Net cash from operating activities: $15,000
Investing Activities:
Cash spent on equipment: ($5,000)
Net cash from investing activities: ($5,000)
Financing Activities:
Cash from bank loan: $7,000
Dividends paid: ($2,000)
Net cash from financing activities: $5,000
Net Increase in Cash: $15,000
Callout: The cash flow statement helps you see if your business has enough cash to pay bills and grow.
You can use FineReport to make a cash flow statement by importing your data and setting up categories for each activity. The tool lets you update numbers quickly and see your cash position with clear charts. This helps you manage your money and make smart choices.
Equity Statement Example
You can use an equity statement to see how ownership changes. This report shows how equity moves up or down over time. It includes profits, losses, dividends, and other events. These things change the owners’ share in the company. When you look at an equity statement, you see how each part of equity gets bigger or smaller during the year.
Here is a simple equity statement example for a small business:
Item
Beginning ($)
Change ($)
Ending ($)
Common Stock
10,000
2,000
12,000
Retained Earnings
8,000
3,500
11,500
Treasury Stock
(1,000)
(500)
(1,500)
Additional Paid-In Capital
4,000
1,000
5,000
Unrealized Gains
500
200
700
Total Equity
21,500
6,200
27,700
Note: The “Change” column tells you how each item moved this year. You can see increases from new stock, profits, and extra capital. You also see decreases from treasury stock and other events.
To make your own equity statement, list each part of equity. Start with the beginning balance for each item. Add or subtract changes like profits, losses, dividends, and stock deals. End with the closing balance for every part.
FineReport makes this job easy. You can connect your accounting data and use a template for your equity statement. The drag-and-drop designer helps you put each item in a clear table. You can update numbers fast and see changes with charts or dashboards. FineReport helps you track equity changes in real time and share your report with your team.
Tip: Use FineReport’s dashboard tools to show important changes in equity. You can add charts that show trends in retained earnings or new stock. This helps you see what makes your company’s value go up or down.
When you use an equity statement, you get a clear view of how your business grows. You can spot patterns in profits, losses, and capital changes. This report helps you make smart choices about investing, paying dividends, or buying back shares. FineReport gives you the tools to create, update, and share your equity statement easily.
FineReport for Financial Statements Examples
Automating Financial Statements
You can save time and make fewer mistakes by automating your financial statements. FineReport has tools that make this easy. You do not need to know how to code or spend a long time making reports. FineReport lets you use a drag-and-drop tool to build your reports. You just choose the data you want and put it where you need.
FineReport also lets you set up reports to run on a schedule. You can make your balance sheet, income statement, or cash flow statement run every day, week, or month. The system will make and send these reports by itself. This means you always get the newest numbers without extra work.
You can change dashboards to fit your needs and see important data quickly.
Drag-and-Drop Interface
You can make reports easily by moving things on the screen.
Automate and Schedule Reports
You can set reports to run and send themselves when you want.
Tip: Automation lets you spend more time understanding your numbers instead of just collecting them.
Data Integration and Visualization
You often need to get data from many places. FineReport connects to databases, Excel files, and other sources. You can bring all your financial data together in one spot. This makes your reports full and correct.
You can also use FineReport to turn numbers into charts and graphs. Dashboards help you see trends and find problems fast. You can use bar charts to compare income, pie charts to show costs, or line graphs to track cash flow. You can even look at your reports on your phone or tablet.
Note: When you see your data in a chart, you can understand it faster and share it with your team.
Real-World Use Cases
Many companies use FineReport to make their financial reporting better. For example, Founder Securities is a big financial company. They wanted to make better choices and work faster. They used FineReport to connect all their data and automate their reports. Now, their teams can get the numbers they need right away. They do not have to wait for someone to make a report by hand.
You can use FineReport for many jobs. You can track budgets, check cash flow, or watch how your equity changes. You can set up forms for your team to add new numbers. You can build dashboards that show key performance indicators (KPIs) for your business.
FineReport helps you work smarter. You get clear and up-to-date financial statements. You can share these reports with your team or managers. This makes it easier for everyone to understand the company’s financial health and make good choices.
Making financial statements can be hard for many reasons. Getting data from different places takes a lot of time. Some software does not do what you need. Using Excel can cause mistakes and make reports less trustworthy. Making charts and graphs can be slow and tricky. You want to see your numbers fast, but it is not always easy.
It is hard to gather and combine data from many places.
Software Limitations
Using Excel can cause mistakes in your reports.
Presentation Issues
It takes a long time to make and understand charts.
You need a tool that helps you get data, make reports, and share them with your team. You want to do better at work and make smart choices.
FineReport Solutions for Finance Teams
FineReport gives you ways to fix these problems. You can make reports automatically and have fewer mistakes. Dashboards and charts help you spot trends and patterns. Checking and fixing data helps keep your numbers right. You can set rules so everyone reports the same way. FineReport has templates that make it simple to build reports.
FineReport connects to databases, Excel, and other places. This helps you put all your data in one spot. You can update reports fast and share them with your team.
Tip: When you use automation and connect your data, you can spend more time learning from your numbers.
Benefits for Decision-Makers
FineReport gives you many good things. You can work with your team safely and share reports easily. FineReport can handle lots of data and gives you answers right away. You get help from local support when you need it. You can enter data on a computer or phone. Checks help you keep your data right.
You can work together safely with special team features.
Optimized for Large Datasets
FineReport works well with big data and gives fast answers.
Dedicated Local Support
You get help from people close to you when you need it.
Robust Data Entry
You can add or change data on any device, and checks keep it correct.
FineReport helps you make better financial statements and smarter choices. You can see how your business is doing and use reports to help you decide what to do next.
Notes to Financial Statements
Purpose of Notes
You often see notes at the end of financial statements. These notes help you understand the numbers and details in the reports. Notes explain how a company made its calculations. They show important facts that do not fit in the main tables. You use notes to learn about accounting methods, special events, or risks. If you want to know why a company’s numbers changed, you check the notes.
Tip: Notes give you extra information that helps you make better decisions. You should always read them when you look at financial statements.
Common Types of Notes
You find many types of notes in financial statements. Each note covers a different topic. Here are some common types:
Accounting Policies: You learn how the company records income, expenses, and assets.
Inventory Details: You see how the company values its stock and goods.
Debt Information: You find out about loans, interest rates, and payment terms.
Contingent Liabilities: You read about possible risks or lawsuits.
Related Party Transactions: You see deals between the company and its owners or managers.
Events After the Reporting Period: You learn about important changes that happened after the report date.
You use these notes to get a full picture of the company’s finances. If you skip the notes, you might miss key facts.
When you know about the main types of financial statements, you can see your company’s money clearly. FineReport helps you make and look at reports by yourself. It works like Excel and makes it easy to collect and show data. This tool helps you work faster and make fewer mistakes. Digital tools give many good things to people who work with money:
Access a wealth of case studies, industry insights, and solution guides to accelerate digital transformation.
FAQ
What are the four main types of financial statements?
There are four main types.Balance Sheet,Income Statement,Cash Flow Statement and Statement of Changes in EquityEach one shows a different part of a company’s finances.
Why do you need all four financial statements?
Each statement tells you something special about the business. You need all four to see the whole picture. You can find patterns, check cash flow, and see changes in profits and equity.
Who uses financial statements?
Managers, investors, lenders, and government agencies use these reports. People use them to make smart choices, track progress, and follow rules.
How does FineReport help with financial statements?
FineReport lets you make, change, and share reports fast. You can connect data from many places, use templates, and see results in charts or dashboards.
Can you make financial statements without Excel?
Yes! You can use tools like FineReport. You bring in data, build reports with drag-and-drop, and set updates to run automatically. This saves time and helps stop mistakes.
What is a note to financial statements?
A note explains details that do not fit in the main tables. You use notes to learn about accounting methods, special events, or risks. Always read the notes to get the full story.
How often should you update financial statements?
You should update them at least once a month. Some companies do it every week or even every day. Regular updates help you find problems early and make better choices.