MySQL reporting tools are systems that automatically collect, organize, and present data from your databases as clear reports and dashboards to help your team find useful information and make work easier. Here are nine top MySQL reporting tools in 2026 that will help you make accurate decisions:
MySQL reporting tools help you change raw sql data into clear information. These tools connect to your MySQL database. You can make reports, dashboards, and visualizations with them. They help you find patterns and see how things are going. You can also share what you learn with your team. Many mysql reporting tools have drag-and-drop features. You do not need to write hard sql code. This makes it faster and easier for everyone to use.
Here is a table that lists some main things popular mysql reporting tools can do:
Tool
Primary Functions
Integrate.io
Supports ETL and ELT processes, change data capture for accurate reporting.
Datadog
Provides real-time analytics, customizable dashboards, and promotes collaborative data analysis.
Tableau
Offers easy-to-use data visualizations and AI-driven statistical modeling for deep data insights.
Knowi
Combines business intelligence with collaboration tools for easy data access and sharing.
When you use these tools, you get many good things. You can turn raw data into useful ideas. Live dashboards help you decide things quickly. Both tech and non-tech team members can understand the results. Teams can work toward the same goals and react faster to changes.
Why Teams Need Reporting Tools
Teams need reporting tools to work better and faster. These tools let anyone build queries and look at data. You do not have to be a data analyst. You get real-time answers, so reporting is always up to date. With one click, you can set up and start using the tools fast.
Easy interfaces help everyone make reports.
All team members can see how the team is doing.
Good communication helps teams work together.
Using data helps your team make smart choices.
Automation saves time and cuts down on manual work.
With mysql reporting tools, your team can handle hard queries and share results easily. You can focus on what matters most. These tools help with business intelligence and turn sql data into clear reports. You can create, share, and use insights to help your business grow.
Key Criteria for MySQL Reporting Tools
When you pick mysql reporting tools, you want them to help your team work together. They should connect with your other systems. The tools should also grow as your needs change. Here are the main things to look for when choosing reporting tools.
Collaboration Features
You need tools that let your team share reports and dashboards easily. Look for features like editing in real time, comments, and access based on roles. These features help everyone stay on track. Multi-tenant user support lets many people use the same platform without mixing up data. Role-based access makes sure each person only sees the data they need. This keeps your information safe and neat.
Integration Capabilities
Your reporting tools should connect with other business systems you use every day. Many mysql reporting tools have connectors for databases, cloud services, and popular apps. Here is a table that shows how some top tools handle integration:
Tool
Integration Features
Connectors
Ideal Users
Tableau
Advanced visualization, storytelling dashboards
Many connectors (databases, SaaS)
Data analysts needing rich visualizations
Microsoft Power BI
Seamless with Microsoft ecosystem, strong visuals
100+ connectors, Azure-native
MS-heavy environments needing affordable BI
Sisense
Strong for embedding analytics, custom app integration
You want a tool that works with both sql and no-sql databases. This makes it easy to bring all your data together for better reports.
Usability and Learning Curve
Pick a tool your team can learn fast. Some tools, like Power BI, feel familiar if you use Excel. Others, like Looker, ask you to learn new things like LookML. If you want everyone to use reporting, choose a tool with a simple drag-and-drop interface. This helps both tech and non-tech users build reports without writing sql code.
Tip: Try the tool with a small group first. See how quickly they can make and share a report.
Scalability and Performance
As your team grows, your reporting tools should keep up. Look for features that help with big teams and lots of data. Here are some important ones:
Feature
Benefit
Multi-tenant user support
Lets many users and teams work together easily.
Role-based access
Keeps your data safe by showing only what each user needs.
Asynchronous query execution
Keeps dashboards fast, even with lots of data.
Configurable caching layers
Makes reporting faster by storing data smartly.
You want your reports to load quickly, even with lots of sql data.
Pricing and Value
Think about how much you want to spend. Some mysql reporting tools use a per-user price, while others charge by how much you use them. Here is a quick look at common pricing models:
Tool
Pricing Model
Estimated Cost
Domo
Consumption-based pricing (credits)
$50,000–75,000/year (Standard)
Tableau
Per-user license
$115/user/month (Creator)
Looker
Annual subscription
$36,000–60,000/year (starting)
Looker Studio
Free or $9/user/month (Pro)
You should match the price to your team size and how much reporting you need. Open-source options can be good for small teams, but paid tools often give you more support and features.
Note: Always check if the tool fits your budget and has the reporting features you need.
By focusing on these key criteria, you can find mysql reporting tools that help your team work better, connect your data, and grow with your business.
Best MySQL Reporting Tools for Teams
FineReport Overview and Features
You want a tool that helps your team work better. FineReport is special because it has strong features for big business needs. You can make reports that look perfect for printing and sharing. FineReport makes charts and graphs easy to read. You can connect FineReport to many systems. This lets your team use data from different places without problems.
Here is why FineReport is a great pick for teams:
You get good tools for making charts and graphs.
FineReport lets you print reports that look very nice.
You can connect to lots of databases and business systems.
The tool helps your team work together with access controls.
You can set up reports to send out automatically for real-time updates.
FineReport works with both sql and no-sql data, so it is flexible.
You can use FineReport for dashboards, forms, and even on phones. Your team can see reports anywhere and anytime. This makes FineReport a strong choice for teams that want to grow and stay fast.
Tableau Overview and Features
Tableau is one of the most used reporting tools for teams. You can use Tableau to make dashboards that you can click and explore. Tableau Next gives your team a place to build and manage analytics together. You can share dashboards and models easily. This helps everyone stay updated.
Feature
Description
Tableau Next: Workspaces
Central place for making analytics, helping teams work together.
Sharing of Analytics Assets
Safe sharing of dashboards and models, helping teams give feedback.
Tableau Pulse: Threshold Tracking
Watch important numbers in real-time, so teams can react fast.
Tableau Pulse: Manage Metric Followers
Manage who follows metrics on phones, making updates easy to share.
Tableau Pulse: Off-Cycle Email Alert
Sends alerts for important numbers, keeping teams informed outside normal times.
System Event Notifications
Alerts for big events, helping teams stay engaged and work together.
Tableau App for Google Workspace
Puts charts in documents, helping teams use data to make choices.
You can use Tableau for real-time reports and advanced charts. Your team can stay informed and act fast.
Power BI Overview and Features
Power BI helps your team bring all your data together. You can connect to MySQL and other databases. Power BI makes it simple to build custom reports and dashboards. You can look at data with interactive charts and share what you find with your team.
Lets you make interactive charts and custom reports for real-time answers.
Captivating Data Visualization
Shows hard data in a way that is easy to understand and use for choices.
Informed Business Decisions
Gives you real-time data, so you can make smart choices fast.
Power BI works well with Microsoft tools. You can use it for business intelligence and reporting across your company.
Looker Overview and Features
Looker is a modern tool that works well with MySQL data. You can connect Looker to your databases and see your data right away. Looker uses LookML, a modeling language, to help you build advanced analytics and custom reports.
Connects easily to SQL databases, including MySQL, for better data access.
Real-time Data Access
Lets your team see data as it happens, helping you make quick decisions.
Advanced Analytics Features
Uses LookML for complex data analysis and custom reporting.
You can use Looker to share dashboards and reports with your team. This helps everyone stay updated and work together.
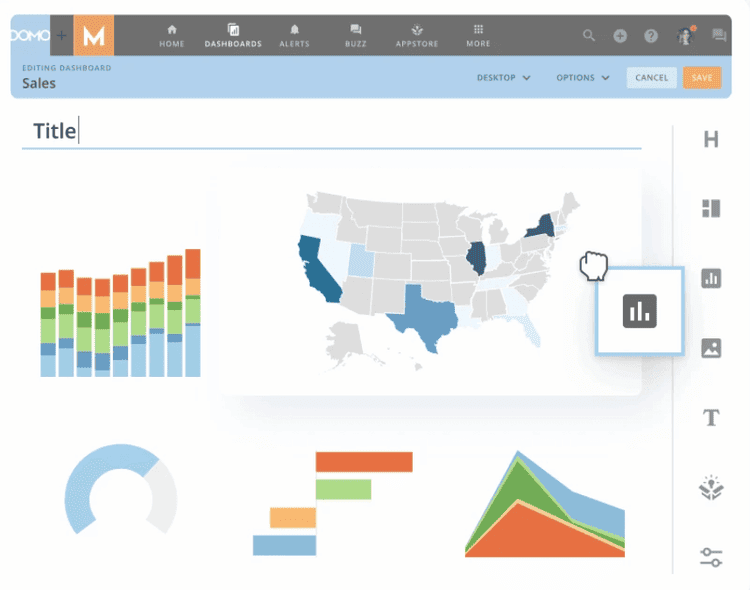
Domo Overview and Features
Domo is a cloud platform that helps teams work together with data. You can connect Domo to your MySQL database and see changes right away. Domo lets your team talk about data, assign tasks, and take action inside the platform. You can set up the Report Scheduler to send reports to your team on a schedule.
You can make progress and status reports to keep everyone on track.
The platform makes it easy to share information with your team.
Automated report creation saves time and cuts down on manual work.
Data visualization features help your team understand MySQL reporting data together.
Domo helps your team stay connected and informed with real-time reports.
Redash Overview and Features
Redash is liked by teams that enjoy writing sql queries. You can use Redash to connect to MySQL and many other data sources. The tool gives you a strong query editor with features like syntax highlighting and auto-complete. You can turn your data into charts and dashboards for easy sharing.
Syntax highlighting, auto-complete, and parameterized queries for SQL-savvy teams.
Broad Data Source Connectivity
Connects to many data sources, including MySQL, for flexible reporting.
Visualization Capabilities
Turns data into charts and dashboards for better understanding.
Sharing and Collaboration Features
Shareable links and embedded dashboards make teamwork simple.
Alerts and Scheduling
Schedule queries and set alerts for proactive monitoring.
Redash helps your team manage reports and work on data projects easily.
Comparison Table of MySQL Reporting Tools
You want to find the best reporting tool for your team. The table below shows how each tool helps with teamwork, connecting data, ease of use, speed, and price. This makes picking the right tool for your team easier.
FineReport is great for teams that want to build reports easily and work together. You can connect to lots of data sources. Real-time reporting keeps your team updated. You can manage who sees what with user roles. The drag-and-drop feature lets you make reports without writing sql. You can also set up reports to send out on a schedule.
Metabase is good if your team knows sql. Toucan is best for teams who want simple, no-code reports and easy charts. Sisense works well for SaaS teams that need built-in analytics and real-time data.
When you look at these mysql reporting tools, think about what your team needs most. Choose tools that help you work together, connect your data, and grow as your business changes.
Choosing the Right Reporting Tool for Your Team
Matching Features to Team Needs
You want a reporting tool that fits your team’s work. First, look at what your team does each day. Some teams need simple dashboards. Others need advanced analytics or business intelligence. Use the table below to compare what matters most:
Criteria
Explanation
Ease of Use and Learning Curve
Drag-and-drop dashboards and guided setup help your team get started fast.
Native MySQL Integration
Real-time sync and full support for MySQL data types keep your reports accurate.
Real-time Data Access
Live query execution and scheduled refreshes give you up-to-date insights.
Dashboard and Charting
Many chart types and interactive filters make visualization easy.
Collaboration and Sharing
Team workspaces and role-based access controls help everyone stay on the same page.
Pricing and Licensing
Choose a plan that fits your team size and budget.
FineReport works for many team needs. If you work in finance, you can use its Excel-like interface for fast reports. Developers can connect to different sql databases and build custom dashboards. You can set up real-time reporting and automate delivery to keep everyone updated.
Different teams use reporting tools in their own ways. Here are some examples:
A sales team checks daily results with real-time dashboards.
An HR team uses forms to manage employee records and onboarding.
Project managers track progress with dashboards and scheduled reports.
IT teams use FineReport to connect to many sql sources and manage data from one place.
FineReport lets you build dashboards, forms, and reports for any situation. You can make custom workflows, set permissions, and share insights with your team. This flexibility helps you handle both simple and hard reporting needs.
Implementation and Onboarding Tips
When you start using new mysql reporting tools, include your whole team. This helps everyone learn the process and make better choices. Focus on these best practices:
Get everyone to use the reporting tools for better clarity.
Focus on visual hierarchy
Highlight key information in your reports.
Tell a story
Make your reports engaging and easy to follow.
Consider your audience
Adjust your reports for who will read them.
Strive to improve
Ask for feedback and keep making your reporting better.
Tip: Begin with a small project. Let your team try the tool and share feedback. This makes onboarding easier and helps you find problems early.
FineReport makes onboarding easy with its user-friendly design. You can import data, set up dashboards, and automate reporting without much training. This helps your team get value from reporting tools right away.
You can pick from many good mysql reporting tools for your team. The table below shows some top tools and what they do best:
Tool
Advantages
FineReport
Fast integration, better decision-making, easy data connection.
ClicData
Quick dashboards, teamwork through sharing.
Knowi
Machine learning, predictive analytics.
Grow
Real-time insights, custom dashboards.
Dundas BI
Self-service analytics, mobile access.
Choose a reporting tool that matches how your team works. This helps you do tasks faster and cuts down on manual work. It also makes reporting quicker. Try free trials with your team to find the best fit. Think about sql skills, what your team needs, and bi features. Start by making queries better, setting up automated reports, and checking results. These steps help your team get more from reporting.
Product Trial
FineReport
Pixel-perfect reports · Interactive dashboards · Easy data entry · Digital twins
Access a wealth of case studies, industry insights, and solution guides to accelerate digital transformation.
FAQ
What is a MySQL reporting tool?
A MySQL reporting tool helps you turn raw data from your MySQL database into clear reports and dashboards. You can use these tools to see trends, share results, and make better decisions.
Can you use FineReport without coding skills?
Yes, you can. FineReport uses a drag-and-drop interface. You do not need to write code to build reports or dashboards. This makes it easy for everyone on your team to use.
How do you share reports with your team?
You can share reports by sending links, exporting files, or setting up scheduled emails. Some tools, like FineReport, let you control who can see or edit each report.
Which devices can you use to view reports?
You can view reports on computers, tablets, and smartphones. FineReport supports mobile access, so you stay updated anywhere.
How do you connect MySQL data to a reporting tool?
Most tools let you connect by entering your MySQL server details. You often use a simple setup wizard. After connecting, you can start building reports with your data.