A performance dashboard serves as a powerful tool for visualizing and tracking key metrics. As a comprehensive business performance dashboard solution, it transforms raw data into actionable insights. Modern performance dashboards enable real-time monitoring and strategic decision-making. It acts as a centralized hub where you can monitor key performance indicators (KPIs) and performance metrics in real time. By presenting data in a clear and organized way, it helps you make data-driven decisions that reduce guesswork and improve business performance.
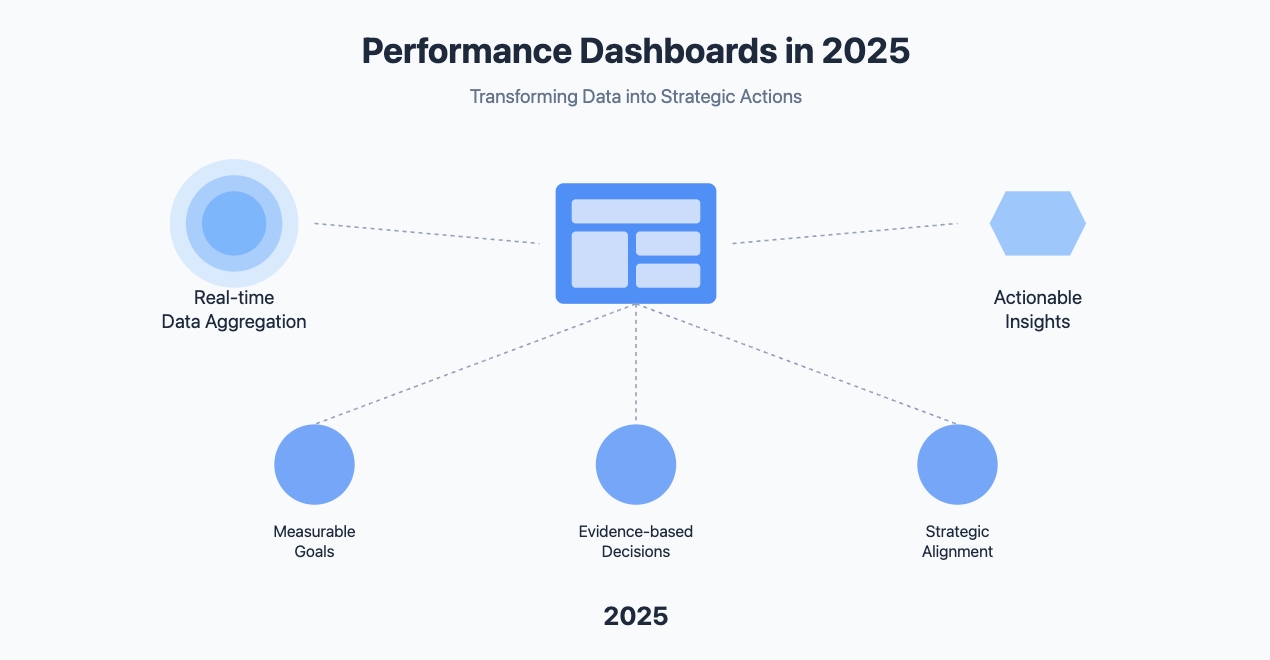
In 2026, an effective performance dashboard becomes even more essential. It aggregates data instantly, giving you actionable insights to align strategies with measurable goals and ensure every decision is backed by evidence.
What is a Performance Dashboard?
A performance dashboard is a visual display that tracks, analyzes, and displays key business metrics and data points in real-time. Think of it as your business's control panel - similar to a car's dashboard that shows speed, fuel level, and engine status.
FineReport, as a leading business intelligence platform, provides powerful dashboard capabilities that transform your data into intuitive visual displays. With its user-friendly design and robust features, FineReport makes it easy to build and customize dashboards that perfectly match your business needs.
Types of Performance Dashboards
Choosing the right performance dashboard is crucial for business success. Different types of performance dashboards serve various organizational needs, from operational monitoring to strategic planning. Performance dashboards come in various types, each designed to meet specific business needs. Understanding these types helps you choose the right one for your goals.
Operational Dashboards
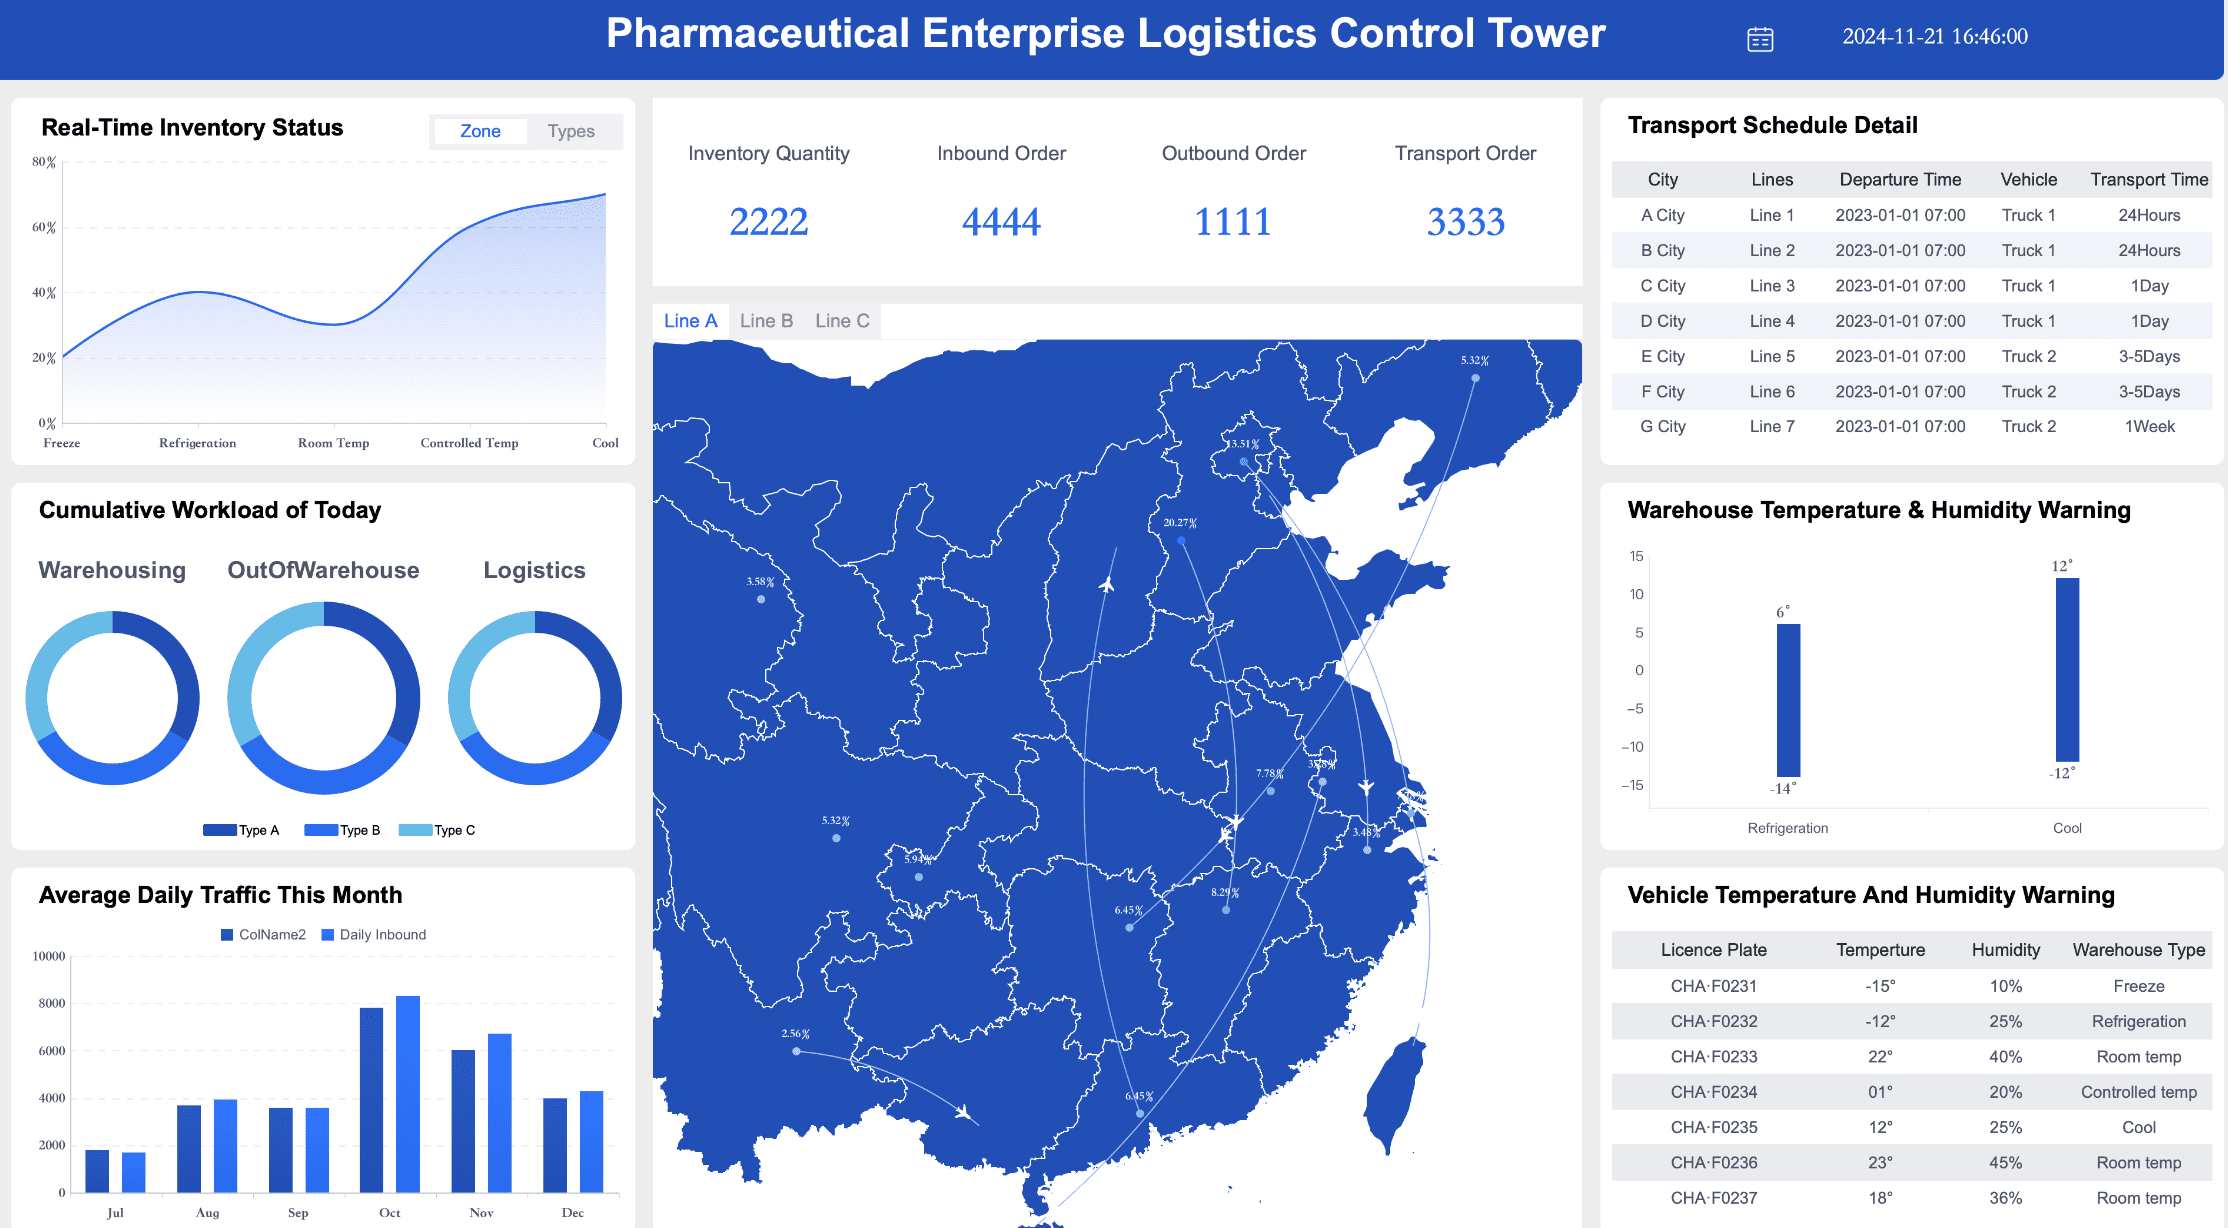
Operational dashboards focus on real-time performance. They help you monitor daily operations and track short-term goals. These dashboards are ideal for industries that require constant updates, such as logistics or manufacturing. For example, a warehouse dashboard can display inventory levels, while a shipping dashboard tracks delivery statuses.
- These dashboards emphasize immediate action.
- They provide insights into ongoing processes.
If your business relies on quick decision-making, operational dashboards are essential.
Strategic Dashboards
Strategic dashboards take a broader view. They monitor long-term strategies and align them with high-level metrics. Unlike operational dashboards, these focus on overall company performance rather than daily tasks. For instance, a conversion rate dashboard can show how well your marketing campaigns perform over time. Similarly, a social media metrics dashboard tracks engagement trends to guide your strategy.
- These dashboards help you measure progress toward strategic goals.
- They ensure your team stays aligned with the company’s vision.
Strategic dashboards are perfect for executives and managers who need to focus on the big picture.
Analytical Dashboards
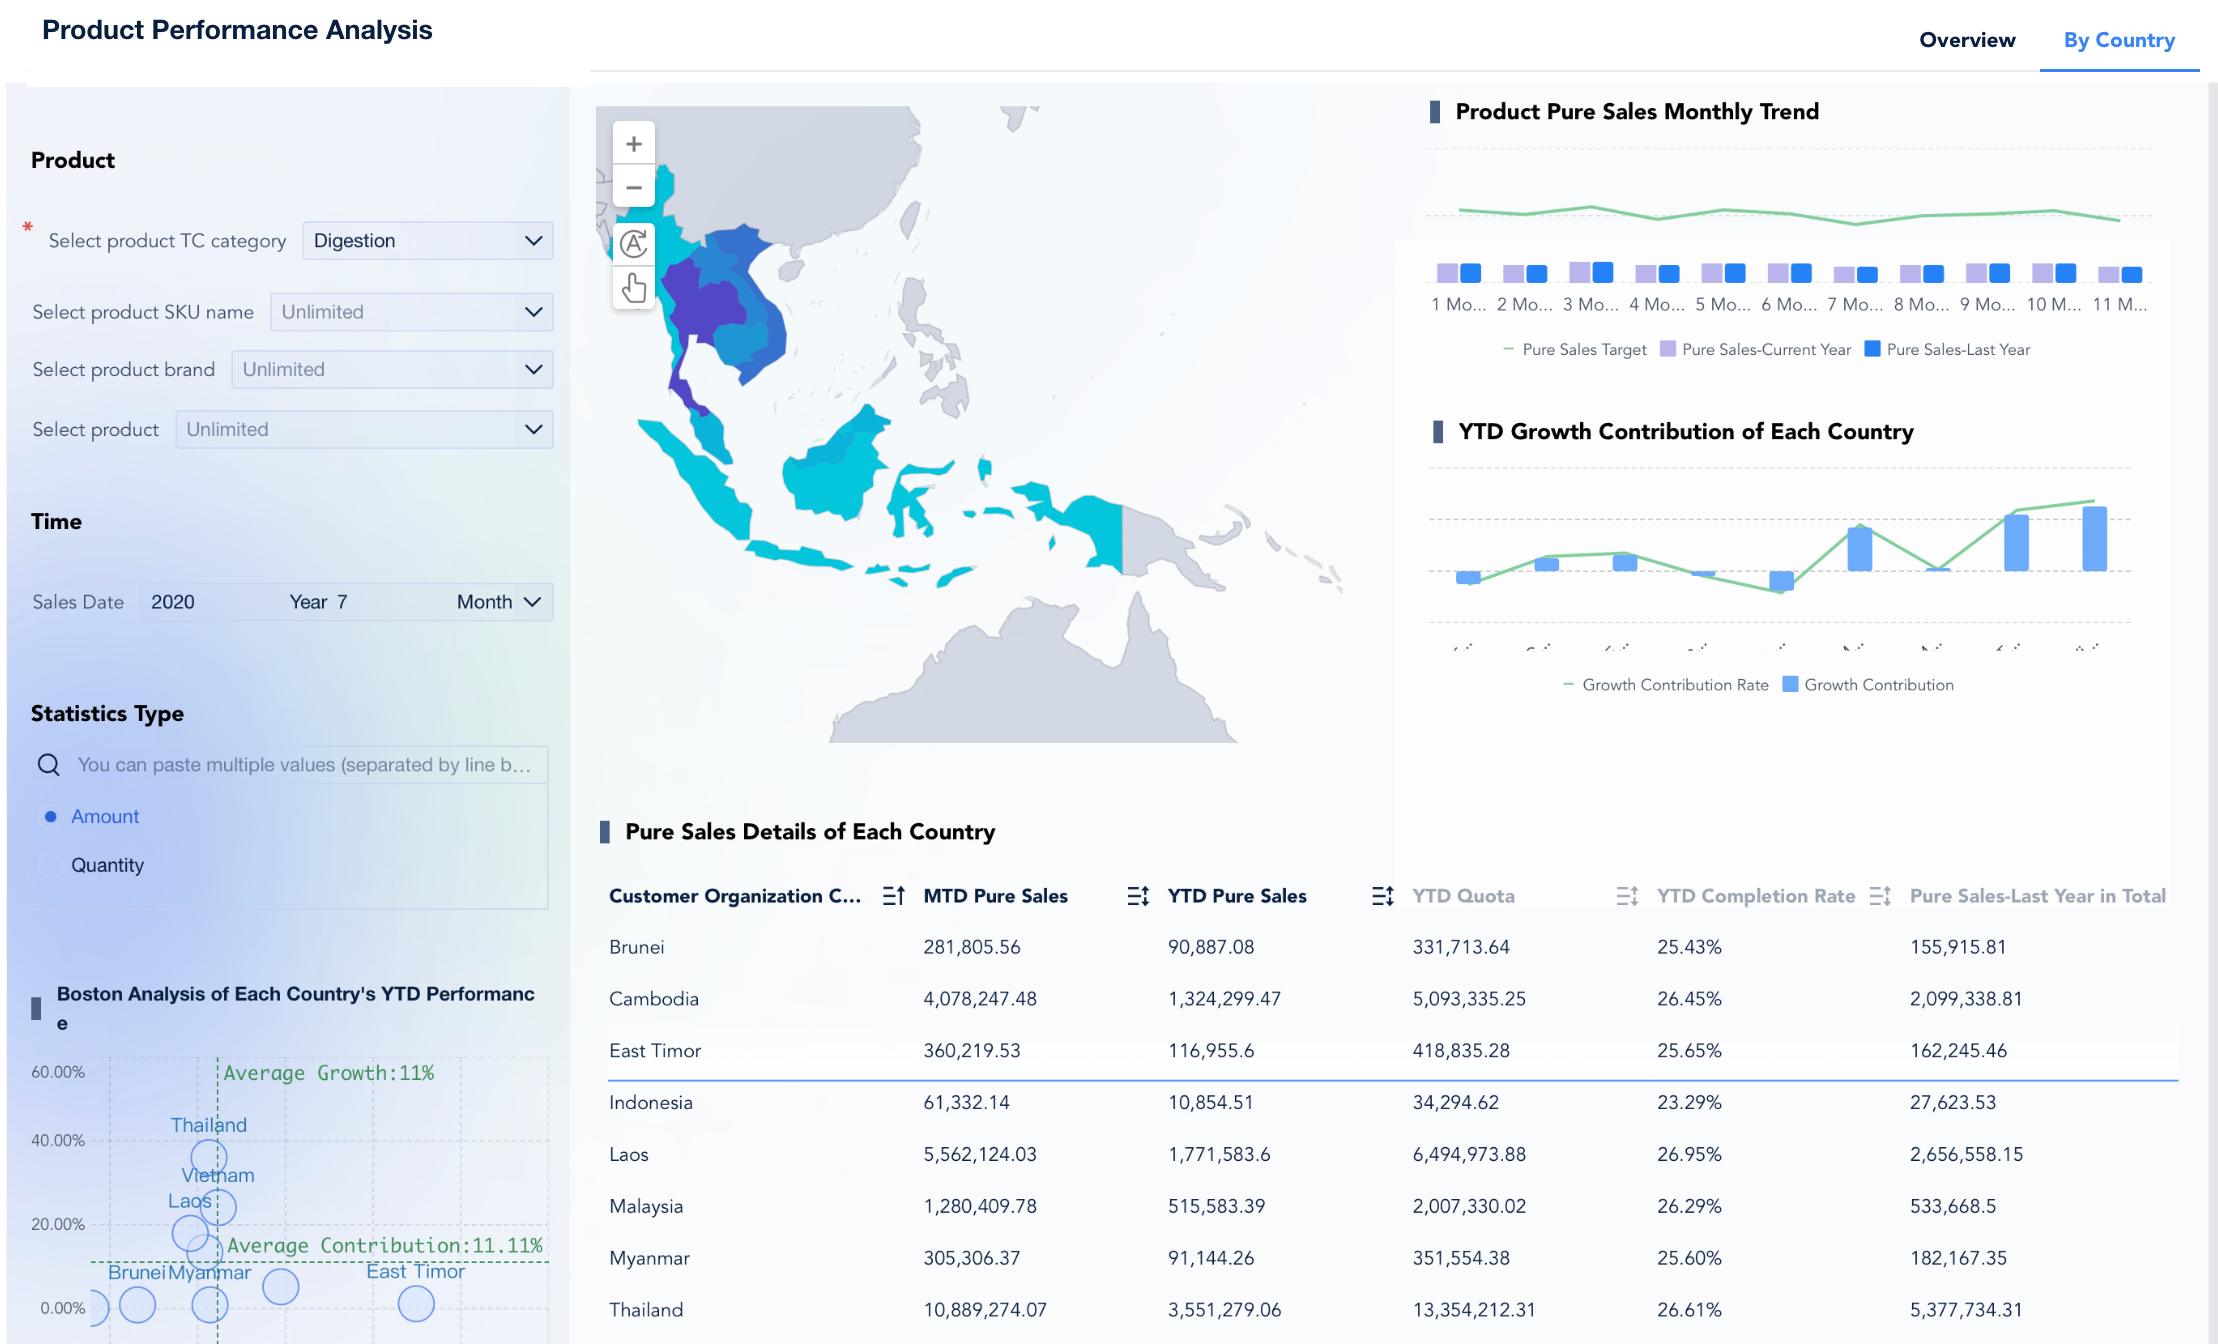
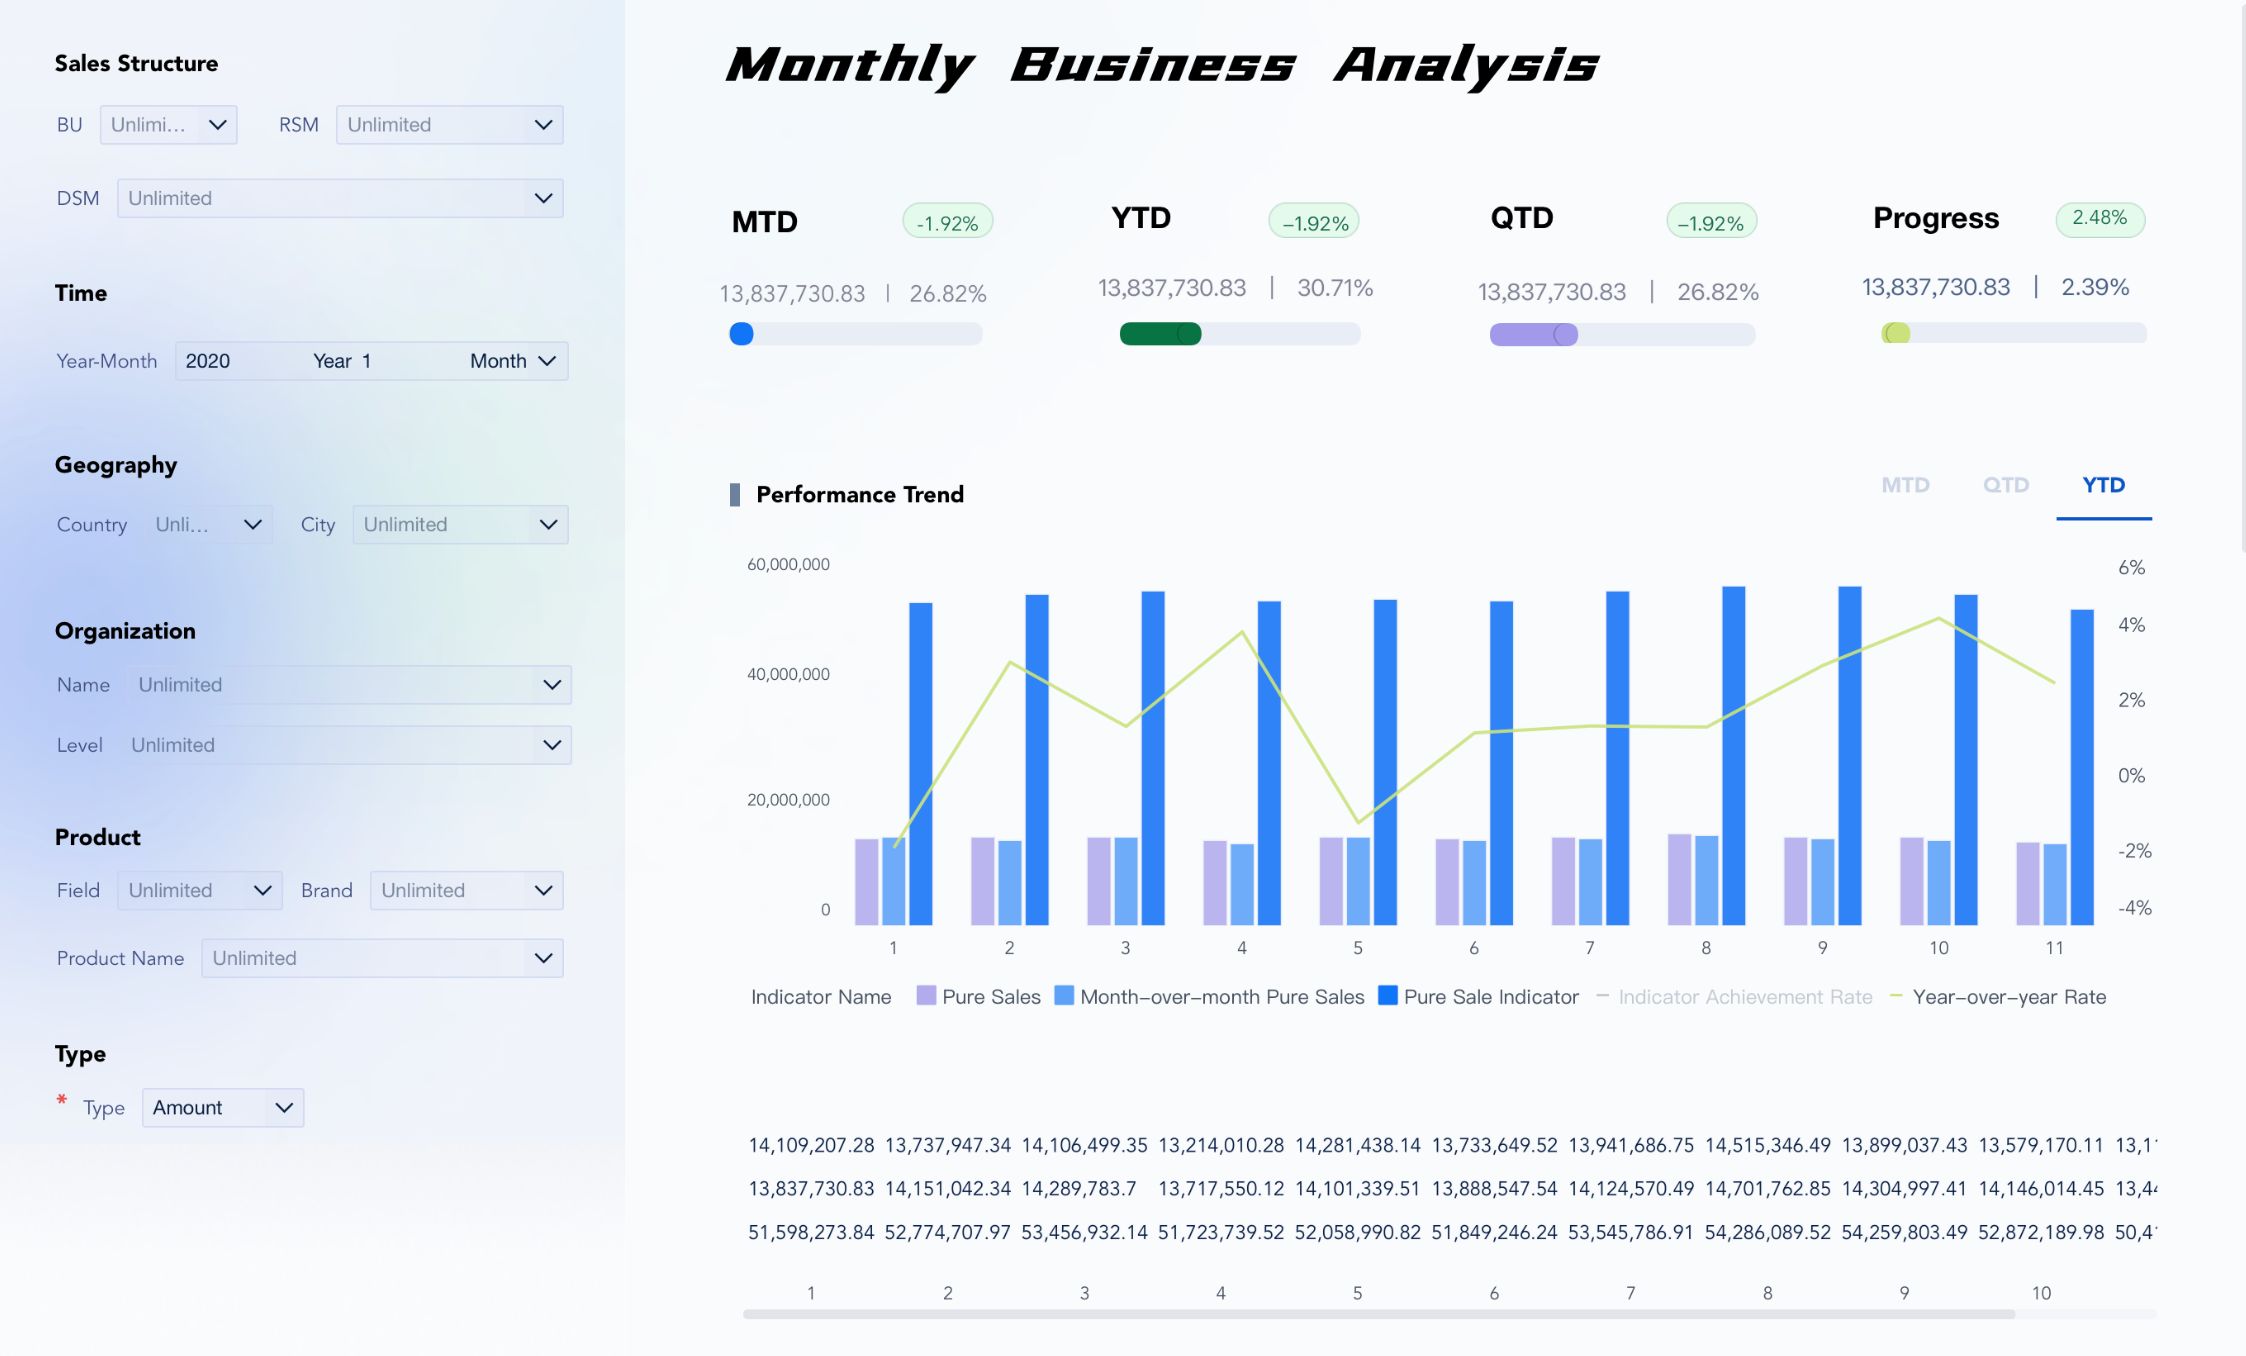
Analytical dashboards dive deep into complex datasets. They help you identify trends and patterns that might not be obvious at first glance. These dashboards are particularly useful in industries like finance, retail, and travel. For example, a sales performance dashboard can reveal seasonal trends, while a marketing dashboard analyzes customer behavior.
- These dashboards support data-driven decisions.
- They uncover insights that drive innovation.
If your business relies on detailed analysis, an analytical dashboard is a powerful tool.

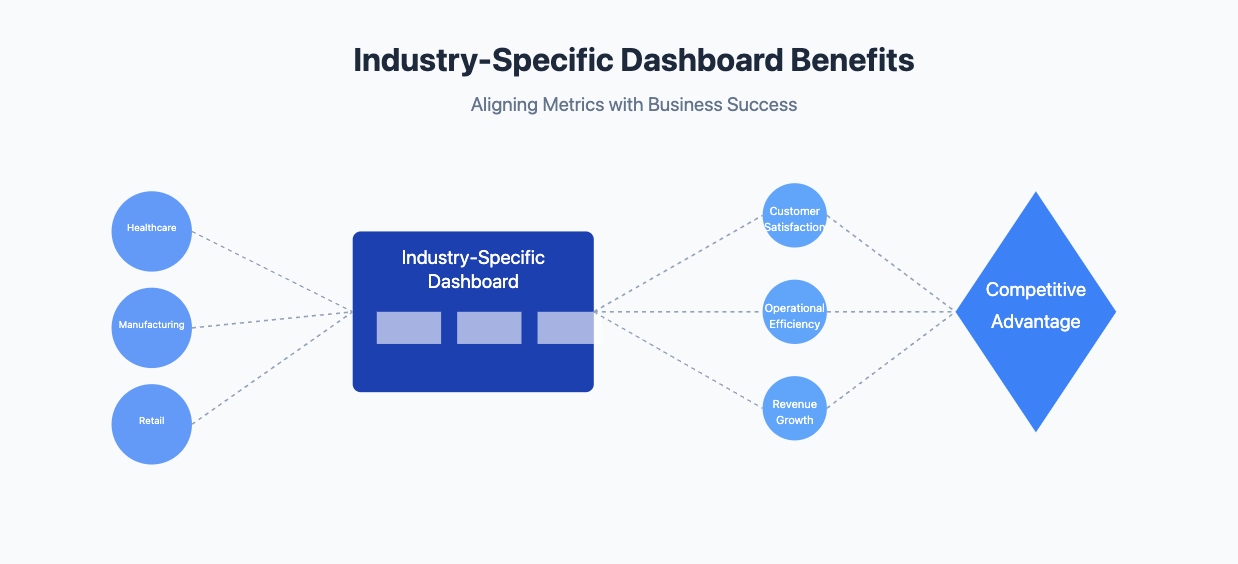
Industry-Specific Dashboards
Industry-specific dashboards are tailored to meet the unique needs of different sectors. These dashboards focus on metrics and data that are most relevant to your industry. By using them, you can gain insights that directly impact your business performance.
Tip: Choosing a dashboard designed for your industry ensures you track the right metrics and avoid unnecessary data clutter.
Examples of Industry-Specific Dashboards
- Healthcare Dashboards
In healthcare, dashboards monitor patient care, staff performance, and resource allocation. For example, a hospital dashboard might display patient wait times, bed occupancy rates, and staff schedules. These insights help you improve efficiency and enhance patient outcomes. - Retail Dashboards
Retail dashboards track sales, inventory, and customer behavior. A store manager might use a dashboard to monitor daily sales trends, identify best-selling products, and manage stock levels. This helps you make better decisions about promotions and inventory planning. - Education Dashboards
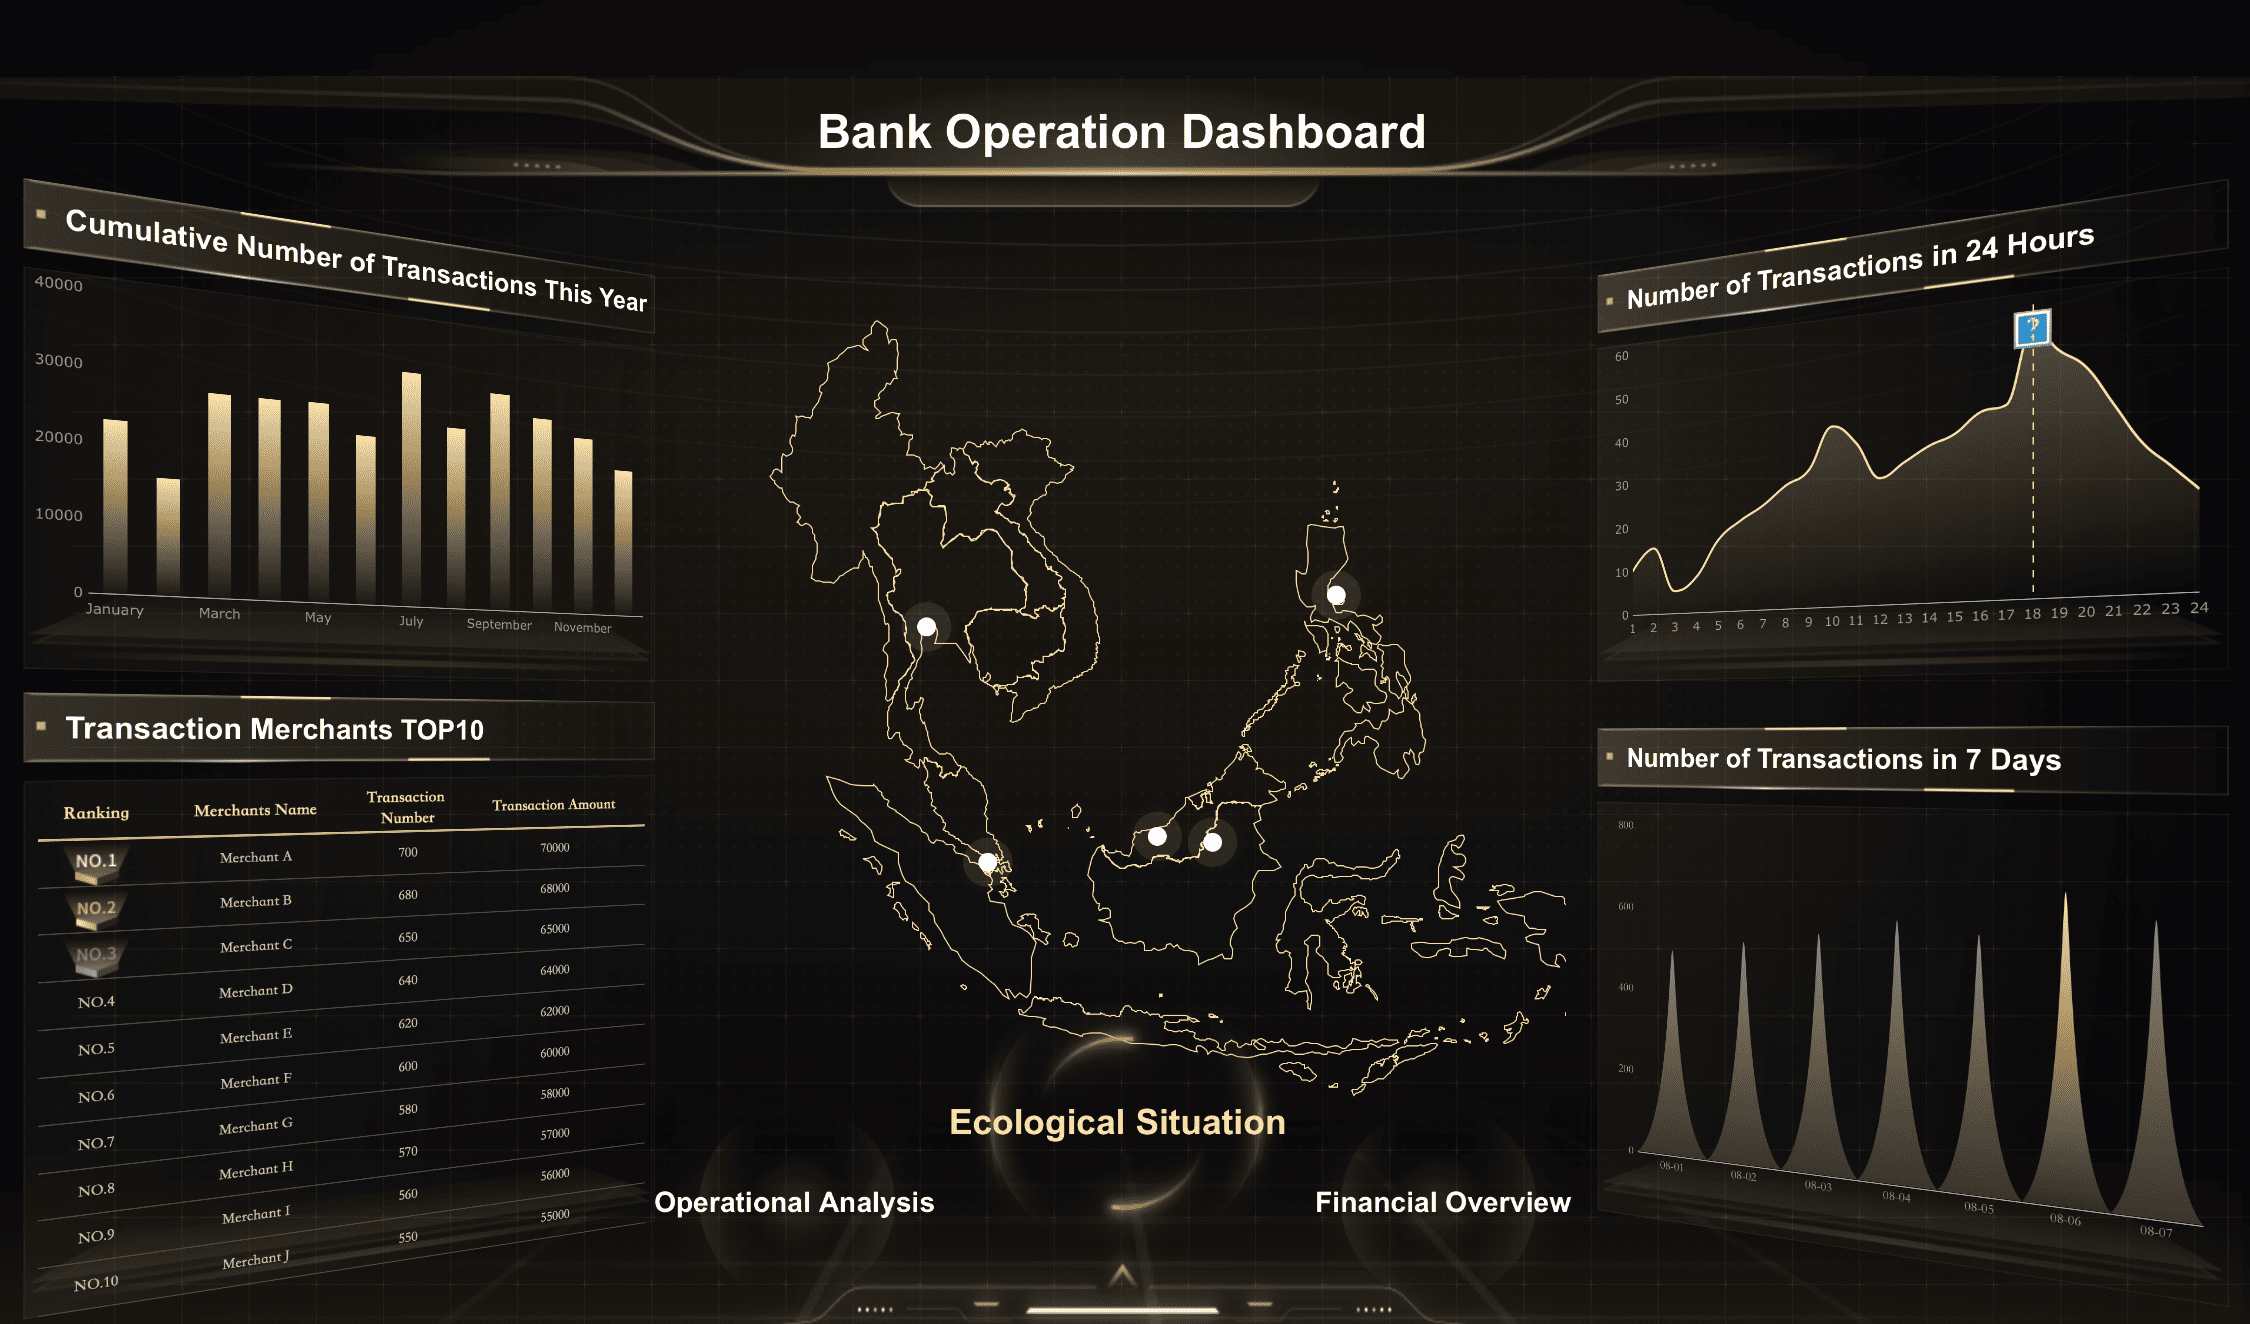
Educational institutions use dashboards to track student performance, attendance, and resource usage. For instance, a school dashboard might show test scores, dropout rates, and teacher performance metrics. These tools help you identify areas for improvement and ensure better learning outcomes. - Finance Dashboards
Financial dashboards focus on revenue, expenses, and investment performance. A financial advisor might use a dashboard to analyze portfolio trends, track cash flow, and forecast future earnings. This allows you to make informed financial decisions.
Benefits of Industry-Specific Dashboards
| Feature | Benefit |
| Tailored Metrics | Focus on what matters most to you. |
| Improved Decision-Making | Gain actionable insights quickly. |
| Enhanced Efficiency | Save time by automating data tracking. |
By using an industry-specific dashboard, you can align your goals with the metrics that matter most in your field. This ensures you stay competitive and achieve better results.
Essential Components of a Performance Dashboard
The effectiveness of a performance dashboard depends on its core components. Building a robust performance dashboard requires careful consideration of these essential elements. A performance dashboard is only as effective as the components it includes. Each element plays a vital role in ensuring the dashboard delivers actionable insights and supports your decision-making process. Let’s explore the key components that make these dashboards indispensable.
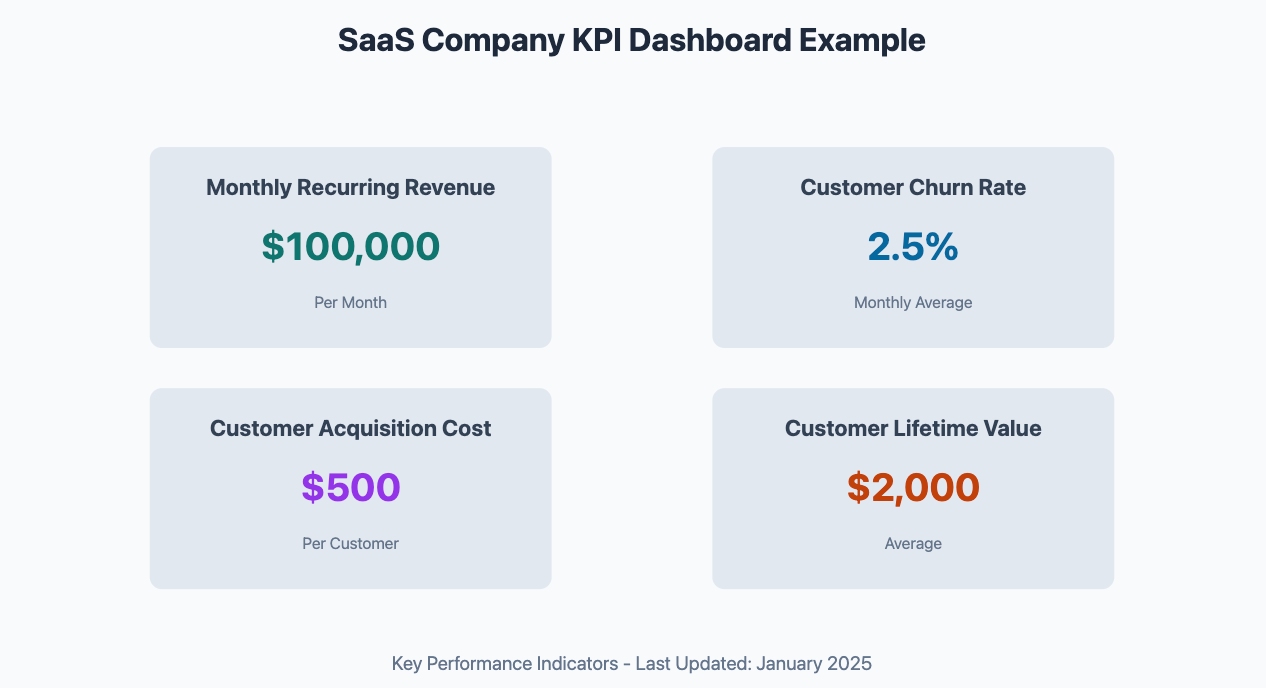
Key Performance Indicators (KPIs)
Key performance indicators are the backbone of any performance dashboard. These metrics help you measure success and track progress toward your goals. Selecting the right KPIs ensures your dashboard remains focused and relevant. For example, financial KPIs like net profit or liquidity ratios provide insights into your company’s financial health. Customer experience KPIs, such as average resolution time or satisfaction ratings, reveal how well you’re meeting customer expectations.
To make the most of your KPIs:
- Choose metrics that align with your business objectives.
- Focus on actionable data that drives decisions.
- Avoid cluttering your dashboard with too many indicators.
By prioritizing meaningful KPIs, you can monitor performance metrics that truly matter.
Data Visualization Features
Performance dashboard visualization tools transform complex datasets into meaningful insights. FineVis, a cutting-edge visualization engine, offers hundreds of chart types and customization options to create stunning and informative data presentations. Its dynamic interaction capabilities and smooth animations enhance the user experience while making complex data more accessible.
Advanced performance dashboard features include customizable charts, real-time monitoring widgets, and interactive data displays. Charts, graphs, and interactive elements make it easier to identify trends and patterns. In 2026, dashboards increasingly feature customizable interfaces, allowing you to tailor visuals to your needs. For example, you can create personalized charts or select widgets that highlight specific data points.
Modern dashboards also integrate real-time visualization tools. These tools provide instant updates, helping you respond quickly to changes. Additionally, AI-driven features enable natural language queries, making data exploration more intuitive. With these advancements, you can engage with your data more effectively and make informed decisions faster.
Real-Time Data Integration
Real-time data integration is a game-changer for performance dashboards. It automates data collection and updates, saving you time and effort. This feature allows you to monitor operations as they happen, ensuring you never miss critical developments. For instance, a real-time financial dashboard can track cash flow instantly, enabling faster decision-making. Modern performance dashboard systems excel at real-time data processing. The integration capabilities of performance dashboards allow seamless connection with various data sources.
FineBi excels in this area with its powerful data processing capabilities and extensive connectivity options. It can seamlessly connect to various data sources, from databases to cloud services, ensuring your dashboards always display the most up-to-date information. With support for over 30 different data sources including SQL databases, Excel files, web services and more, FineBi makes real-time data integration simple and reliable.

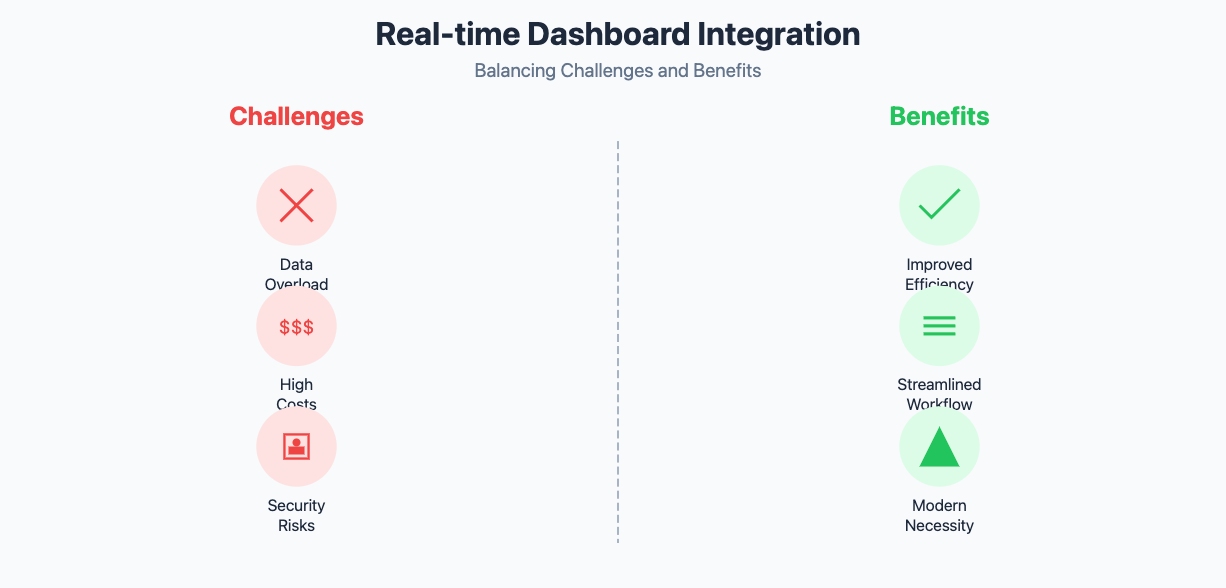
However, integrating real-time data comes with challenges. Overloading your dashboard with constant updates can overwhelm users. High implementation costs and security risks also require careful planning. Despite these hurdles, the benefits of real-time monitoring—such as improved efficiency and streamlined workflows—make it a must-have feature for modern dashboards.
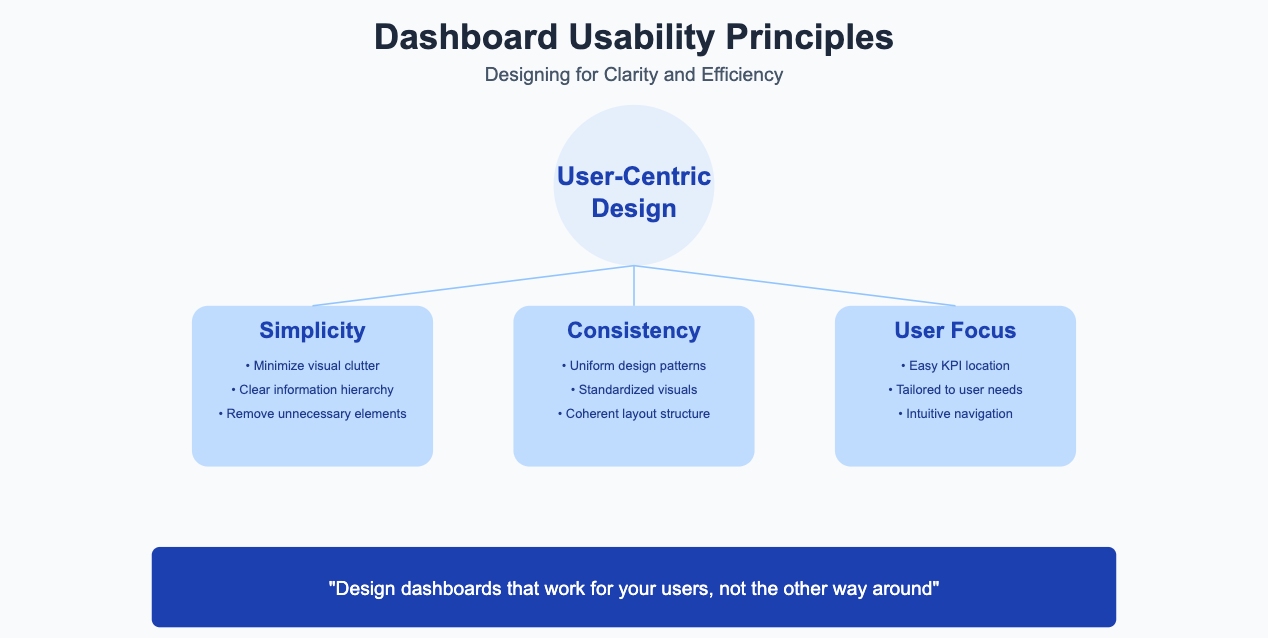
User-Centric Design
A user-centric design ensures that your performance dashboard is intuitive and easy to use. By focusing on the needs of the end user, you can create a tool that delivers value without unnecessary complexity. This approach prioritizes usability, making it easier for you to interact with data and extract actionable insights. An effective performance dashboard design prioritizes user experience. The best performance dashboards balance functionality with ease of use.
Why User-Centric Design Matters
A well-designed dashboard improves efficiency and reduces frustration. It ensures that users can quickly find the information they need and understand it at a glance.
| Benefit | Description |
| Customization | Dashboards can be tailored to meet the specific needs of different users within an organization. |
| User-Friendly Interface | Ensures intuitive interactions and provides clear instructions for effective dashboard usage. |
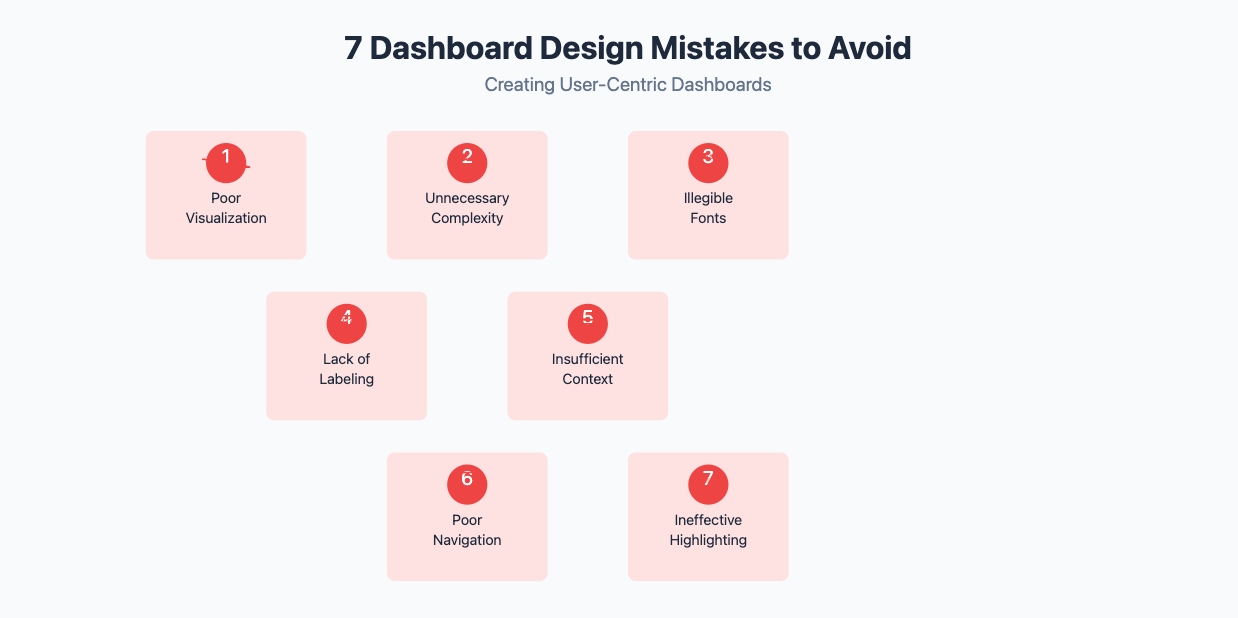
To achieve a user-centric design, avoid common mistakes that can hinder usability. These include:
- Poor visualization choices that reduce the impact of your data.
- Unnecessary complexity that overwhelms users.
- Illegible fonts or graphics that make information hard to read.
- Lack of labeling, which can confuse users about where to find key metrics.
- Insufficient context, leading to misinterpretation of data.
- Poor navigation, especially on mobile devices.
- Ineffective highlighting of important data, causing critical insights to be overlooked.
By addressing these issues, you can create a dashboard that is both functional and enjoyable to use. A user-centric design not only enhances the user experience but also ensures that your team can make better decisions faster.
Scalability and Customization
Scalability and customization are essential for performance dashboards in 2026. As your business grows, your dashboard must adapt to handle increasing amounts of data and more complex requirements. A scalable dashboard ensures that you can continue to rely on it, no matter how much your organization evolves.
Customization allows you to tailor the dashboard to your specific needs. Fanruan's comprehensive BI platform offers unparalleled flexibility in this regard. Whether you need to scale up your dashboard deployment, customize visualization styles, or create specialized analytical applications, Fanruan's suite of tools provides the perfect solution for growing organizations.
Customization allows you to tailor the dashboard to your specific needs. You can choose which metrics to display, how to visualize them, and even how to organize the layout. This flexibility ensures that your dashboard remains relevant and useful, regardless of changes in your business priorities.
Tip: Look for dashboards that offer modular features. This allows you to add or remove components as needed, ensuring that your dashboard grows with your business.
Scalable and customizable dashboards also improve collaboration. By allowing different teams to access the data they need in a format they understand, you can align everyone with your business objectives. This adaptability makes these dashboards a valuable tool for any organization aiming to stay competitive in a data-driven world.
How Performance Dashboards Aid Decision-Making
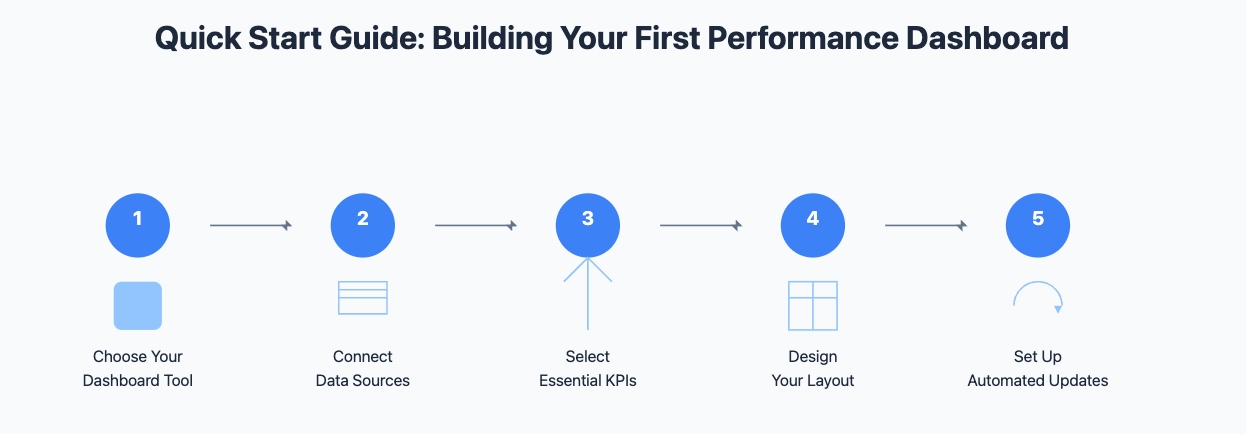
Quick Start Guide: Building Your First Performance Dashboard
- Choose your dashboard tool (e.g., Tableau, Power BI)
- Connect your data sources
- Select your essential KPIs
- Design your layout
- Set up automated updates
Delivering Real-Time Insights
Performance dashboards provide you with real-time insights that enhance your ability to make timely decisions. By monitoring key performance indicators (KPIs) as they happen, you can respond quickly to changes in business performance. For example, a sudden drop in sales displayed on your dashboard can prompt immediate action to investigate and resolve the issue. These tools also help you identify correlations between different KPIs, such as the relationship between product defects and maintenance schedules. This analysis allows you to optimize processes and improve overall quality.
Real-time monitoring ensures you stay ahead of potential problems. Dashboards can alert you to issues before they escalate, giving you the opportunity to act proactively. Whether you’re tracking financial metrics or operational data, these insights empower you to make data-driven decisions that positively impact your organization.
Supporting Data-Driven Strategies
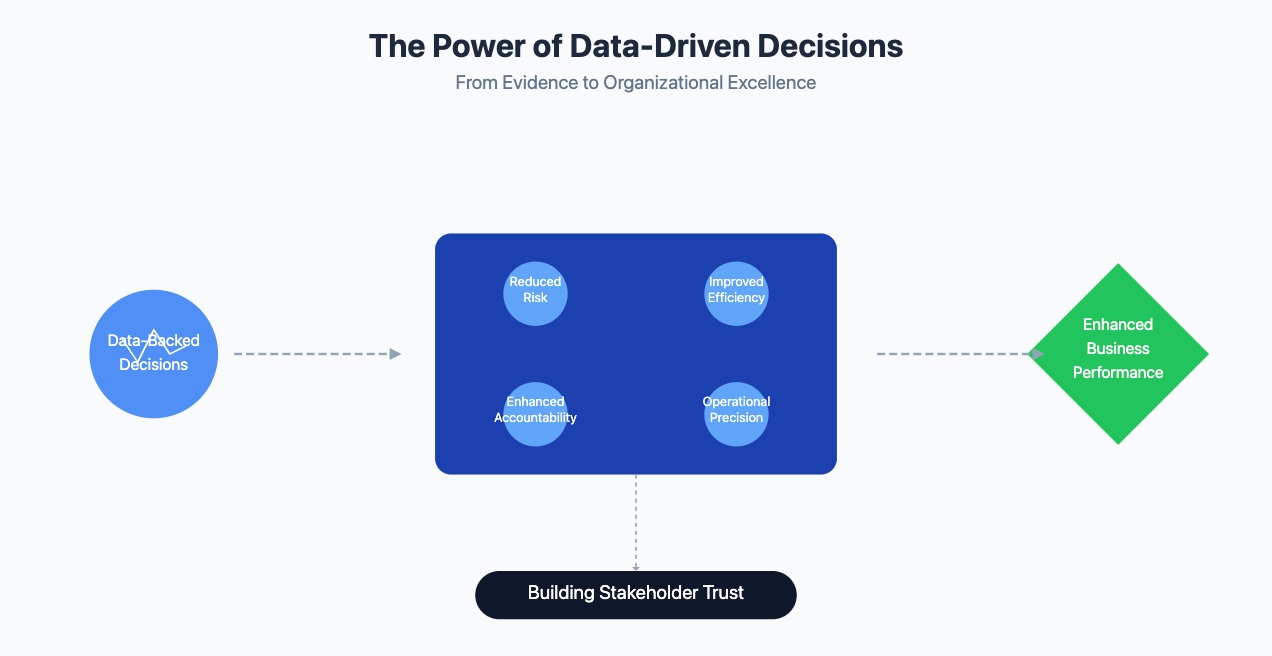
Dashboards play a critical role in supporting data-driven strategies. They consolidate complex datasets into a single, easy-to-understand platform, enabling you to base your decisions on facts rather than assumptions. By presenting clear and actionable data, dashboards help you align your strategies with measurable goals. For instance, tracking customer satisfaction metrics can guide you in improving service quality, while monitoring employee productivity can help you refine internal processes.
When you rely on data to shape your strategies, you reduce the risk of errors and improve efficiency. Dashboards ensure that every decision you make is backed by evidence, fostering a culture of accountability and precision within your organization. This approach not only enhances business performance but also builds trust among stakeholders.
Identifying Trends and Patterns
Dashboards excel at helping you identify trends and patterns in your data. By analyzing historical data, you can uncover insights that drive long-term strategic planning. For example, a sales dashboard might reveal seasonal trends, allowing you to prepare for peak demand periods. Similarly, a marketing dashboard can highlight customer behavior patterns, helping you tailor campaigns to specific audience segments.
These tools also enable you to anticipate problems and seize opportunities. By recognizing emerging trends early, you can adapt your strategies to stay competitive. Dashboards provide a comprehensive view of your data, making it easier to spot connections and make informed decisions. This ability to forecast and plan effectively ensures your organization remains agile in a rapidly changing business environment.
Aligning Teams with Business Objectives
Performance dashboards play a vital role in aligning your teams with business objectives. They act as a centralized hub where you can monitor KPIs and performance metrics in real time. By providing a clear view of progress, dashboards ensure everyone stays focused on shared goals. When your team understands how their efforts contribute to the bigger picture, they feel more engaged and motivated.
Customizable dashboards make this alignment even stronger. You can tailor them to reflect your organization’s strategic goals. For example, you might highlight KPIs related to revenue growth, customer satisfaction, or operational efficiency. When team members see these metrics displayed prominently, they gain a sense of purpose. They understand how their work impacts the company’s success, which fosters collaboration and accountability.
Tip: Use dashboards to create transparency. Share them during team meetings to keep everyone informed and aligned.
Dashboards also simplify decision-making by presenting KPIs in an easy-to-understand format. You can quickly identify areas needing improvement and take action. For instance, if a sales dashboard shows declining conversion rates, you can investigate and adjust your strategy. This proactive approach ensures your team stays on track and works toward achieving business objectives.
| Feature | Benefit |
| Real-Time Monitoring | Keeps teams updated on progress. |
| Customization | Reflects organizational priorities. |
| Clear Visuals | Simplifies complex data for action. |
By using performance dashboards effectively, you create a unified team that works toward common goals. This alignment not only improves productivity but also drives better results for your organization.
Several Performance Dashboard Pitfalls to Avoid
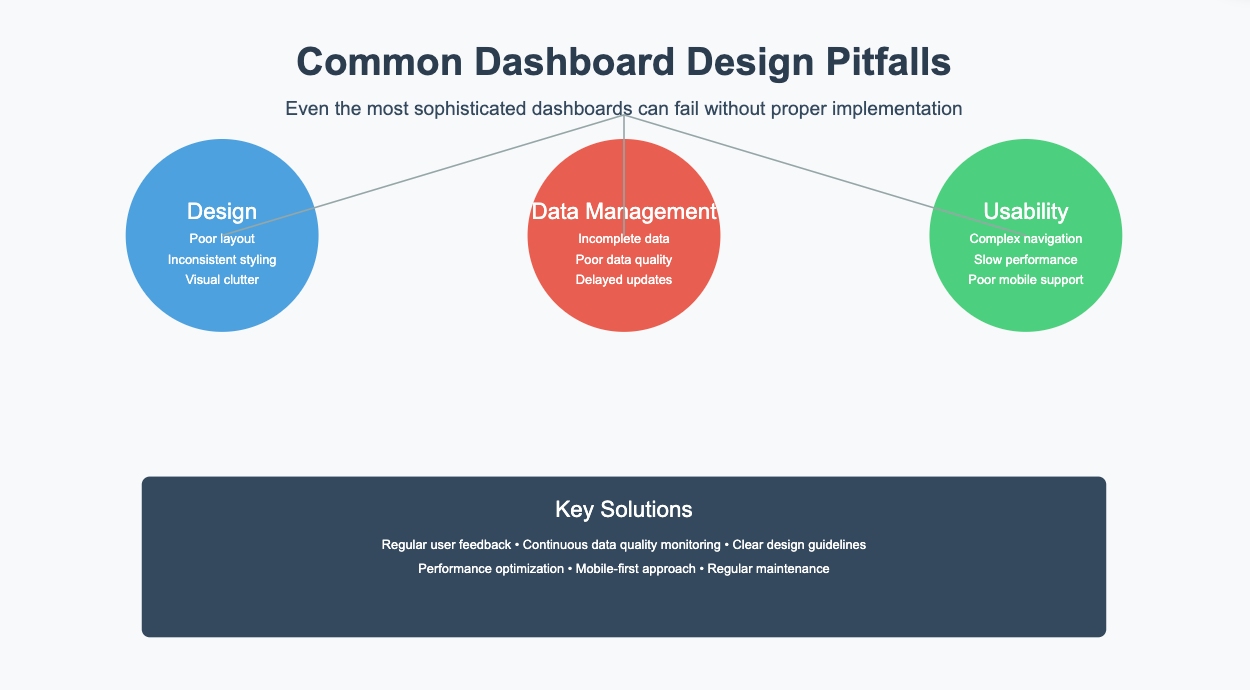
Even the most advanced performance dashboards can fail to deliver value if you don’t avoid common mistakes. Missteps in design, data management, or usability can lead to confusion and inefficiency. Let’s explore some pitfalls you should watch out for.
Overloading Dashboards with Excessive Data
Packing too much information into a dashboard can overwhelm users and obscure critical insights. When you try to display every metric, you risk losing focus on what truly matters. For example, separating data across multiple screens might make it harder for executives to assess performance quickly. Similarly, using flashy gadgets like speedometers without context can mislead users about KPI performance.
Tip: Keep your dashboard simple. Focus on the most relevant KPIs and ensure they are displayed clearly. Avoid clutter by grouping related metrics and using consistent visual representations.
Another common mistake is failing to display data from the "zero" level. This can distort how users perceive KPI values, leading to flawed conclusions. Always aim for clarity and accuracy in your visualizations.
Neglecting User Experience
A poorly designed dashboard can frustrate users and reduce its effectiveness. If your dashboard lacks intuitive navigation or uses inconsistent visuals, it becomes harder for users to extract insights. For instance, overly complex layouts or illegible fonts can make key data difficult to interpret.
Why It Matters: A user-friendly dashboard improves efficiency and ensures users can focus on decision-making rather than struggling with the interface.
To enhance usability, prioritize simplicity and consistency. Avoid unnecessary variety in visual elements, and ensure all KPIs are easy to locate. Design your dashboard with the end user in mind, tailoring it to their specific needs and preferences.
Failing to Maintain Data Accuracy
Inaccurate data can undermine the entire purpose of a performance dashboard. If your metrics are flawed, your decisions will be too. To ensure accuracy, follow these steps:
- Define clear objectives to align your dashboard with company goals.
- Involve stakeholders from different departments to address diverse needs.
- Integrate data from all systems to eliminate silos.
- Design an intuitive dashboard that encourages proper use.
Key Metrics to Track: Accuracy, Completeness, Consistency, Timeliness, Validity, and Uniqueness. These metrics ensure your data remains reliable and prevents flawed analyses.
By maintaining data accuracy, you can trust your dashboard to provide actionable insights. This not only improves decision-making but also builds confidence among your team.
Overlooking Security and Privacy Measures
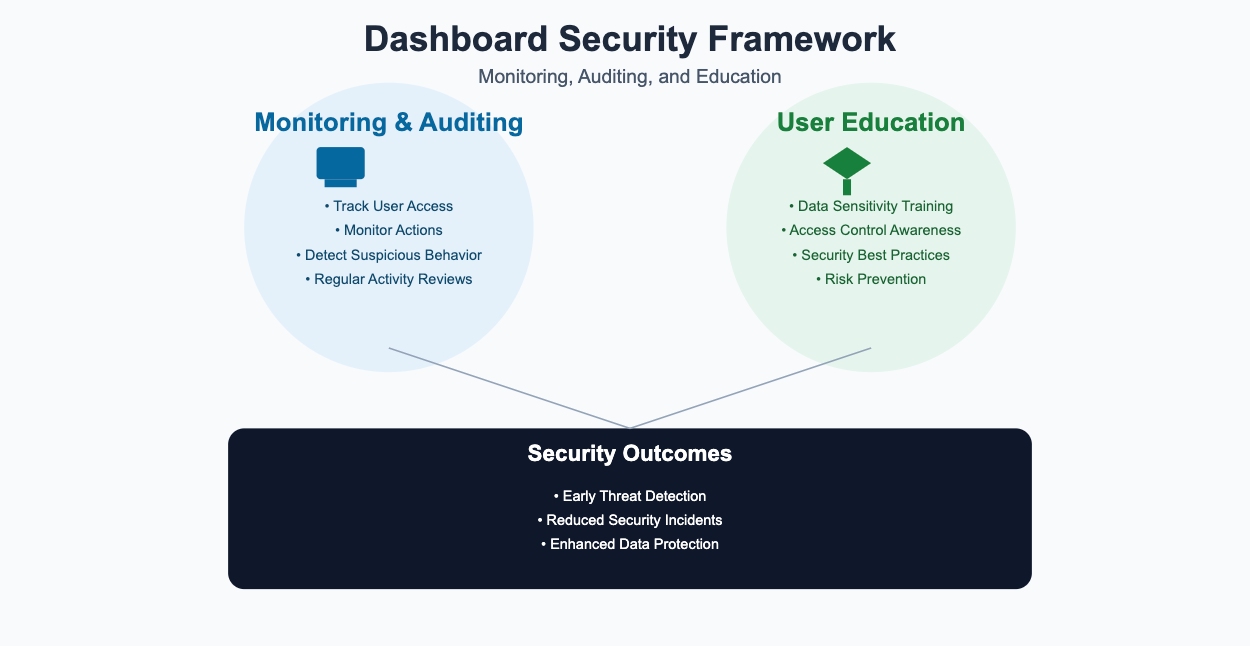
Neglecting security and privacy in performance dashboards can expose your organization to significant risks. Unauthorized access to sensitive data can lead to breaches, financial losses, and reputational damage. You must prioritize protecting your dashboards to ensure data remains secure and private.
Start by monitoring and auditing dashboard activity regularly. This helps you track who accesses the dashboard and what actions they take. By keeping a close eye on usage, you can quickly identify suspicious behavior and respond before it escalates. Educating users on safe dashboard practices is equally important. Teach your team about data sensitivity and the importance of access control. When users understand their responsibilities, they are less likely to make mistakes that compromise security.
Classify your data sources based on sensitivity levels. This allows you to apply the right protection measures to each type of data. For example, highly sensitive information like customer financial details should have stricter safeguards than general performance metrics. Data masking techniques also play a crucial role in protecting sensitive information. Masking ensures that unauthorized users cannot view confidential data, even if they gain access to the dashboard.
Tip: Use role-based access controls to limit dashboard access to only those who need it. This minimizes the risk of unauthorized users viewing sensitive information.
Failing to address security and privacy concerns can undermine the trust of your stakeholders. By implementing these best practices, you create a secure environment where your team can confidently use dashboards to drive decisions. Protecting your data is not just a technical requirement—it is a critical step in maintaining your organization’s integrity and success.
Optimizing Performance Dashboards for 2026
Integrating AI and Machine Learning
AI and machine learning are transforming how you interact with performance dashboards. These technologies enhance functionality by offering predictive analytics, which helps you forecast trends and make proactive decisions. For example, AI can analyze historical performance metrics to predict future sales patterns. This allows you to prepare for opportunities or challenges ahead of time.
Real-time insights are another advantage. AI algorithms detect patterns and anomalies instantly, enabling you to act quickly. For instance, if your dashboard identifies a sudden drop in customer satisfaction, you can investigate and resolve the issue before it escalates. Additionally, natural language processing makes dashboards more accessible. You can ask questions in plain language, and the dashboard will provide answers, simplifying data exploration.
Prescriptive analytics is also a game-changer. AI-powered dashboards recommend actions based on data analysis, helping you make informed decisions. These advancements ensure that your effective performance dashboard not only tracks performance metrics but also guides you toward better outcomes.
Emphasizing Mobile and Cloud Accessibility
In 2025, mobile and cloud accessibility are essential for optimizing performance dashboards. A mobile-first design ensures you can access your dashboard anytime, anywhere. This flexibility is crucial for staying updated on performance metrics, especially when managing remote teams or traveling.
Cloud-based dashboards offer seamless integration with diverse data sources. They allow you to consolidate information from multiple systems into one platform. This improves efficiency and ensures your data remains synchronized. Additionally, cloud storage enhances collaboration. Team members can access the same dashboard in real time, fostering alignment and transparency.
Responsive design is another key feature. Dashboards optimized for mobile devices provide a user-friendly experience, regardless of screen size. This ensures you can monitor key performance indicators and make decisions without being tied to a desktop.
Regularly Updating KPIs and Metrics
Keeping your dashboard relevant requires regular updates to KPIs and metrics. Outdated data can mislead you and hinder decision-making. Weekly or monthly updates strike the right balance. They provide a clear overview of trends without overwhelming you with minor fluctuations.
Curating your data set is equally important. Focus on relevant and high-quality information. Eliminate unnecessary data to improve processing efficiency. Data cleaning and validation processes ensure accuracy, which is critical for maintaining trust in your dashboard.
Updating metrics also aligns your dashboard with evolving business goals. As priorities shift, you can adjust the displayed performance metrics to reflect new objectives. This adaptability ensures your dashboard remains an effective tool for tracking progress and driving success.
Providing Training for Effective Use
Training your team is essential for maximizing the potential of performance dashboards. Without proper guidance, users may struggle to interpret data or utilize the dashboard’s features effectively. By investing in training, you ensure that everyone can confidently use the tool to make informed decisions.
Why Training Matters:
A well-trained team can extract actionable insights faster, avoid errors, and fully leverage the dashboard’s capabilities.
Here are some steps to provide effective training:
- Start with the Basics
Introduce the dashboard’s purpose and key features. Explain how it aligns with your organization’s goals. Use simple examples to demonstrate how to navigate the interface and access essential metrics. - Offer Hands-On Practice
Allow users to explore the dashboard in a controlled environment. Provide sample data for practice. This helps them build confidence and understand how to apply the tool in real-world scenarios. - Create Role-Specific Training
Tailor the training to match each team’s responsibilities. For example, train sales teams to focus on conversion rates and marketing teams on engagement metrics. This ensures relevance and improves engagement. - Provide Ongoing Support
Offer resources like user guides, video tutorials, or a help desk. Regularly update training materials to reflect new features or changes in KPIs.
Tip: Schedule periodic refresher sessions to reinforce skills and introduce advanced techniques.
| Training Element | Benefit |
| Hands-On Practice | Builds confidence and familiarity. |
| Role-Specific Sessions | Increases relevance and engagement. |
| Ongoing Support | Ensures continuous improvement. |
By prioritizing training, you empower your team to use dashboards effectively. This not only improves decision-making but also boosts overall productivity.
Performance dashboards offer measurable benefits that enhance business performance. They save time by consolidating critical data, improve decision-making with real-time insights, and foster team alignment through clear communication. In 2026, their importance grows as businesses increasingly rely on data to stay competitive. Trends like mobile-first design, real-time analytics, and sustainability metrics make dashboards indispensable tools for modern organizations.
To maximize their potential, focus on best practices. Regularly update KPIs, prioritize user training, and ensure dashboards remain secure and customizable. By doing so, you empower your team to make informed decisions and achieve strategic goals effectively.
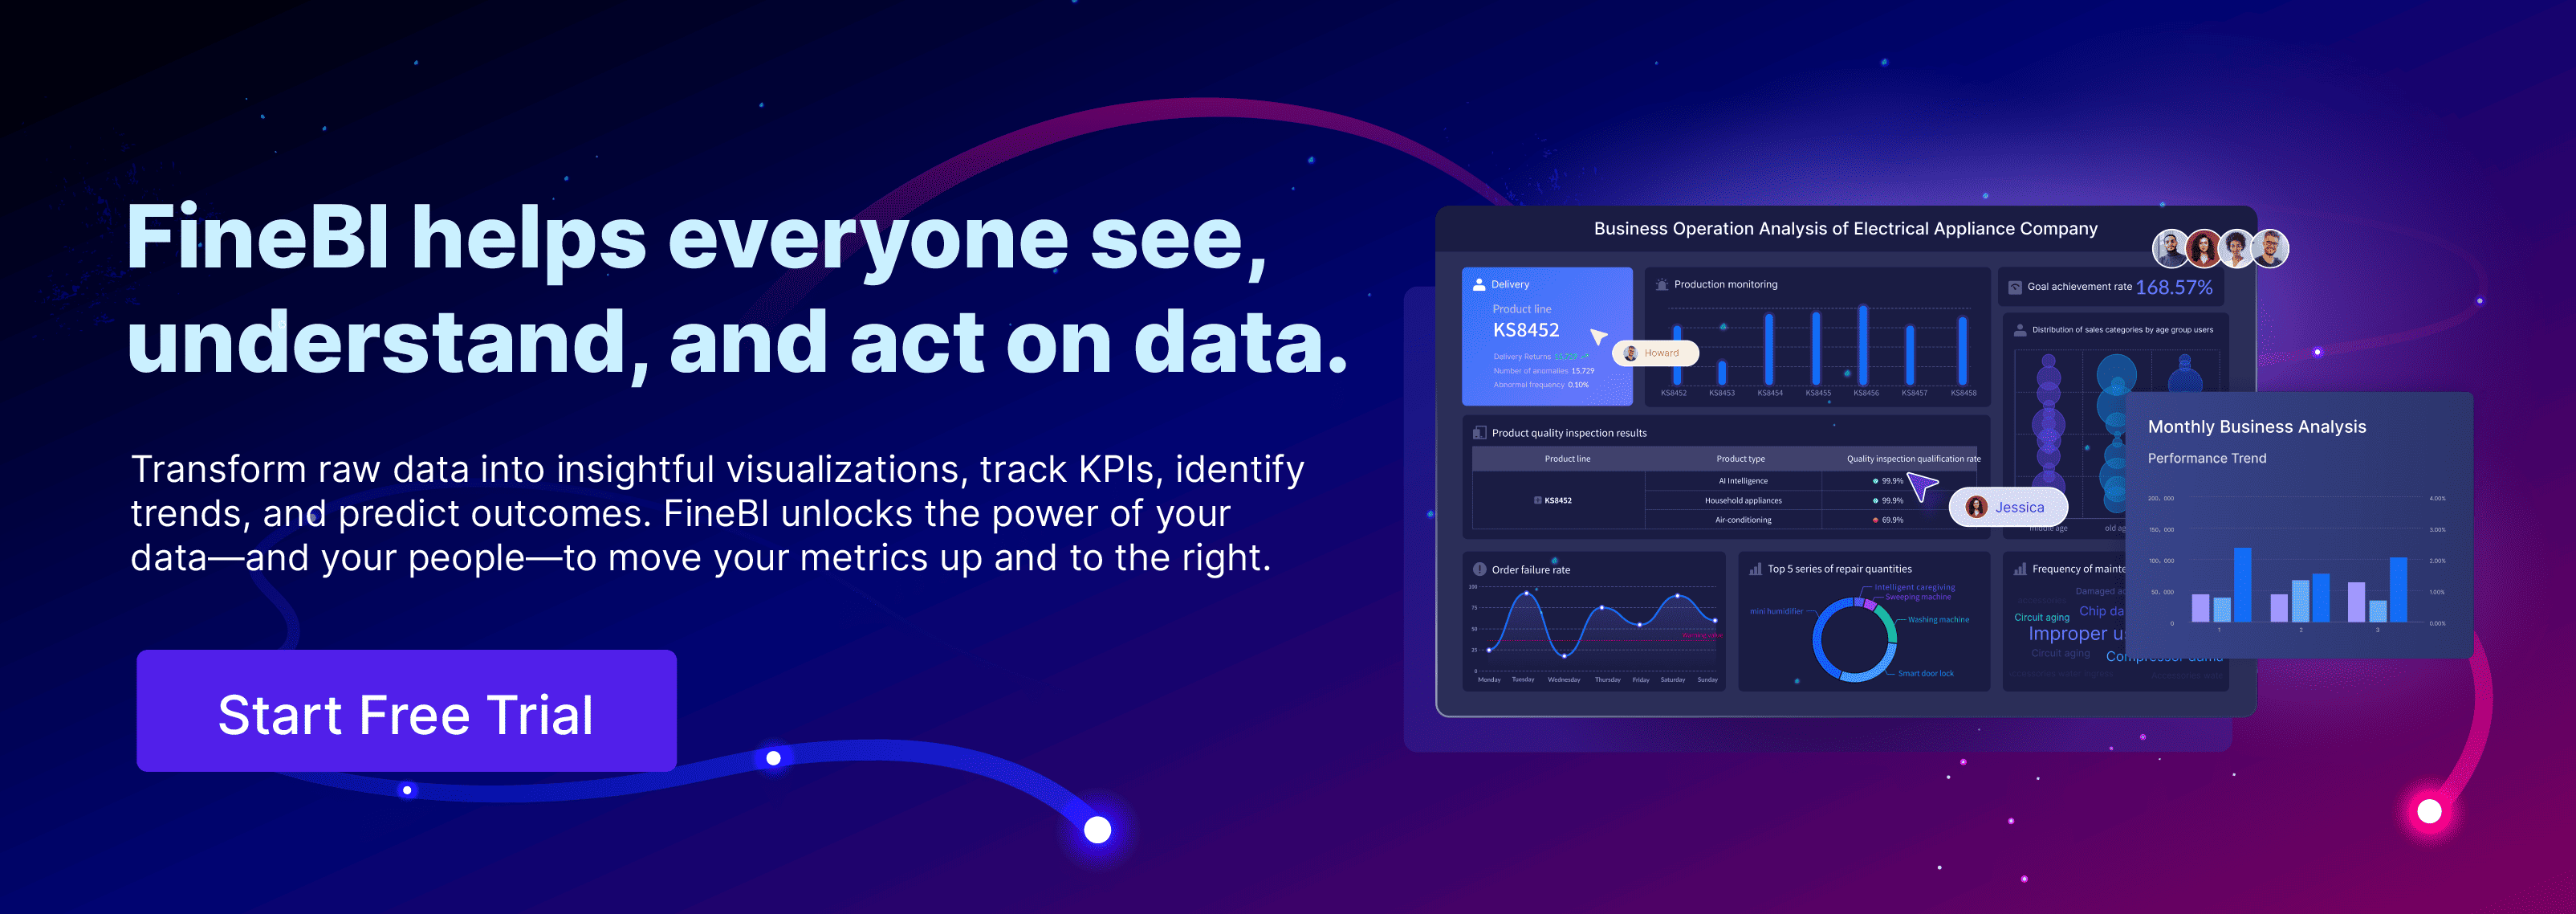
Click the banner below to try FineBi for free and empower your enterprise to transform data into productivity!
Continue Reading About Dashboard
How to Quickly Build a Core App Dashboard
Store Performance Dashboard: Your Retail Command Center


FAQ

The Author
Lewis
Senior Data Analyst at FanRuan
Related Articles

How to Build an Investment Portfolio Reporting Dashboard for Executives: KPIs, Benchmarks, and Drill-Down Views
Investment portfolio reporting for executives is not about showing every holding, transaction, and chart your investment team can produce. It is about giving CEOs, CFOs, CIOs, boards, and investment committees a fast, re
Yida YIn
Jun 25, 2026

12 KPI Reporting Examples for Executive Dashboards: What to Show in Weekly, Monthly, and Quarterly Reviews
Executive leaders do not need more data. They need decision ready $1 examples that match how often they review the business and what actions they are expected to take. A weekly $1 should surface fast moving risks and per
Yida YIn
Jun 25, 2026

How to Build a Digital Marketing Reports Dashboard: Executive Examples, KPIs, and Templates
A $1 is the control layer that helps executives and marketing leaders turn scattered channel data into fast, confident decisions. If you are a CEO, CMO, operations director, or marketing analytics lead, the real problem
Yida Yin
May 07, 2026