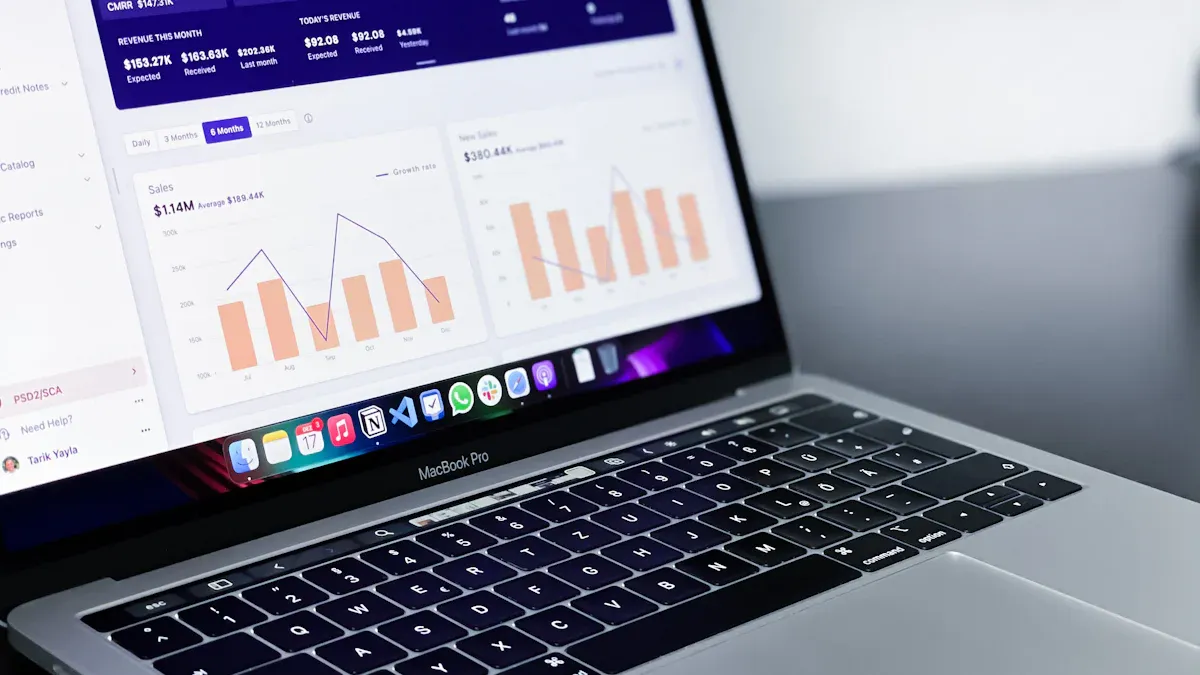
What is a portfolio dashboard? A portfolio dashboard is a centralized digital tool that displays key metrics and performance data from multiple projects or investments in one interactive view. You use a portfolio dashboard to track progress, monitor resources, and evaluate trends across your business activities.
A portfolio dashboard gives you real-time visibility into your operations. Continuous data flow lets you respond quickly to changes, allocate resources smarter, and strengthen team trust. Companies that use real-time insights for project portfolio management are more likely to make informed decisions and achieve better results.
Recent studies show that integrating data into decision-making helps businesses succeed. The Investor Dashboard centralizes portfolio data, making it easier for you to evaluate financial and operational metrics. As a result, you gain actionable insights that enhance transparency and drive effective project portfolio dashboard strategies.
Portfolio Dashboard Overview
What is a Portfolio Dashboard?
What is a portfolio dashboard? A portfolio dashboard is a digital platform that brings together key data from multiple projects, programs, or investments into a single, interactive view. You use a portfolio dashboard to monitor progress, track resources, and analyze trends across your business activities. This tool helps you see the big picture and make informed decisions quickly.
A portfolio dashboard displays real-time information about your projects. You can view timelines, budgets, resource allocation, and risk indicators at a glance. The dashboard uses charts, graphs, and status markers to present complex data in a way that is easy to understand. You gain instant access to the health and performance of your entire project portfolio, which supports better planning and execution.
Most portfolio dashboards share common features across industries. You will often find:
Project portfolio overview with basic details for each project
Timelines showing major tasks and delivery dates
Status markers that indicate if projects are on track, delayed, or ahead of schedule
Charts and graphical reports, such as Gantt charts and line graphs
Budget information to monitor financial health
Resource management tools for tracking allocation and utilization
Task trackers highlighting key activities and their status
Risk overview to identify potential issues early
These features help you manage multiple projects efficiently and keep stakeholders informed.
Key Component
Description
Strategic Overview
Shows all tasks across portfolios, helping you make decisions that align with business goals.
Performance Tracking
Evaluates each project's value and progress, guiding resource prioritization.
Risk Management
Identifies risks early, allowing you to take action before problems escalate.
Project Prioritization
Helps you decide which projects to advance, scale back, or stop based on strategic objectives.
A portfolio dashboard aggregates and presents data from different projects in real time. You can identify trends and issues quickly, which allows you to intervene before problems grow. The dashboard highlights resource over-allocation and skill gaps, helping you optimize project execution. You see where your team needs support and where you can improve planning.
You need a portfolio dashboard to overcome common business challenges. Many organizations struggle with poor alignment between projects and business strategy. Resources are often misallocated, and risks go unmanaged. Without a standardized framework, project prioritization becomes subjective. Communication gaps can lead to delays and budget overruns.
A portfolio dashboard addresses these issues by providing high-level visibility into your entire project portfolio. You can plan and execute high-value initiatives while balancing financial and resource constraints. The dashboard shows dependencies between projects, people, and assets, tying real-time views to your strategic objectives.
You benefit from:
Faster decision-making, with some dashboards enabling decisions in minutes instead of hours
Automated task assignments and workflows, reducing manual intervention and errors
Effective resource allocation, which 87% of project managers prioritize
Improved visibility, helping prevent project failures caused by lack of insight
Real-time tracking of project health and resource utilization, which traditional tools often lack
Streamlined project intake, ensuring only valuable projects are approved based on data-driven criteria
Cost reduction, with digital project management tools lowering project costs by up to 30%
Portfolio dashboards also surface risks early, enabling you to shift strategies quickly and improve business outcomes. Visual cues, such as color-coded status indicators, help you spot overdue initiatives and trends across projects. You can analyze the impact of changes and dependencies, making evidence-based decisions that align with your goals.
When you use a project portfolio dashboard, you gain real-time visibility into project status, resources, and delivery progress. This alignment with strategic goals leads to better outcomes and supports effective project portfolio management. You empower your team to collaborate, communicate, and deliver results with confidence.
Project Portfolio Dashboard Benefits
Real-Time Project Tracking
You gain a clear advantage when you use aportfolio dashboard for real-time project tracking. This tool gives you instant access to timelines, budgets, statuses, resources, and performance metrics across multiple projects. You see where each project stands and spot issues before they grow. Real-time visibility helps you optimize resource utilization project portfolio dashboard and reduce delays. Research shows that organizations experience a 31% decrease in cost overruns and a 23% reduction in project delays when they use a performance-based project portfolio dashboard. You can identify underutilized teams and shift resources quickly, improving operational efficiency.
Metric
Impact
Cost Overruns
31% decrease
Project Delays
23% reduction
Productivity Increase
78% of professionals agree
Enhanced Decision-Making
A performance-based project portfolio dashboard supportsbetter decisions. You see all critical information in one place, making it easier to evaluate risks and opportunities. As Knoepfel of Smartsheet states,
"Creating a dashboard with the right tool can greatly improve the management of complex project portfolios and can provide several key benefits. [The right tool provides] a cohesive view of project information for teams, stakeholders, and executives to stay aligned and up to speed on the latest developments; real-time visibility into timelines, budgets, statuses, resources, and performance metrics across multiple projects; and tracking and managing project risks, such as scope changes, cost increases, and major blockers, which allows you to proactively mitigate risks."
You use a risk management project portfolio dashboard to track risks and respond quickly. The dashboard simplifies complex data into visualizations, helping you make informed choices and align with strategic goals.
Evidence Description
Key Insights
Centralized Resource Visibility
Dashboards provide real-time insights that help organizations identify utilization gaps and predict bottlenecks.
Real-Time Financial Governance
Advanced PPM suites allow for continuous budget validation and proactive mitigation of cost volatility.
AI-Augmented Solutions
Cloud-native PPM suites enhance operational efficiency by predicting risks and optimizing resource allocation.
Improved Collaboration and Efficiency
A resource utilization project portfolio dashboard improves collaboration and efficiency. You and your team access the same data, reducing confusion and streamlining communication. Companies like NuVasive and Viessmann Group saw meeting preparation time drop by 75% and improved governance after adopting a project portfolio dashboard. You monitor project health in real time and ensure everyone stays aligned. Dashboards help you optimize resource allocation and maintain accountability.
Portfolio dashboards provide real-time visibility into the health and alignment of diverse project portfolios.
These dashboards support better allocation of resource decisions, improving operational efficiency.
A unified view from the dashboard helps leaders optimize resource allocation across the program, aligning with strategic goals.
FineReport’s Role in Project Portfolio Management
FineReportempowers you to build a performance-based project portfolio dashboard tailored to your needs. You access real-time analytics, mobile dashboards, and automated reporting. FineReport connects to multiple data sources, giving you a resource utilization project portfolio dashboard that supports risk management project portfolio dashboard features. You use interactive visualizations and scheduled reports to track progress and make data-driven decisions. FineReport’s mobile access lets you monitor your portfolio dashboard anywhere, ensuring you stay informed and responsive.
A portfolio dashboard brings together essential features that help you manage multiple projects efficiently. You use it to monitor progress, analyze performance, and make informed decisions. Understanding the key elements in aproject portfolio dashboardensures you select the right tool for your business needs.
Customizable Data Visualization
Customizabledata visualization transforms your experience with a portfolio dashboard. You interact with charts, graphs, and tables that present complex information in a clear format. When you tailor visualizations to your needs, you gain deeper insights and make better decisions. FineReport'sdrag-and-drop design lets you build customized portfolio dashboards quickly. You choose from over 70 chart styles, including Gantt charts and line graphs, to display timelines, status markers, and budget information. Real-time updates keep your dashboard current, so you always see the latest data. Customizable templates allow you to design dashboards that match your workflow, making portfolio analysis more effective.
Interactive dashboards turn static reports into dynamic experiences. You manipulate variables and see changes instantly, which helps you understand trends and make faster decisions.
FineReport'sMultiple Built-in Charts For Visualization
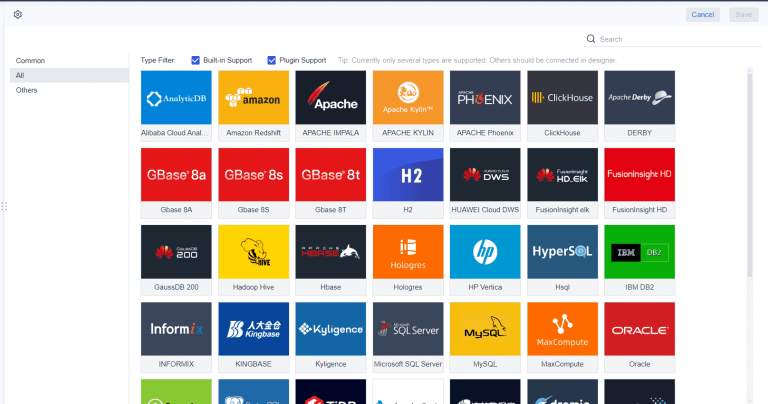
Integration with multiple data sources is a critical element in any portfolio dashboard. You need to connect information from different databases, spreadsheets, and external systems. FineReport supports over 500 data sources, including SQL, Oracle, SAP, and cloud platforms. This capability ensures you have a unified view of all your projects. You avoid data silos and improve the accuracy of your portfolio analysis. When you integrate data, you track resource allocation, budget status, and project timelines in one place. This comprehensive approach supports effective project portfolio management and helps you respond quickly to changes.
Data Source Type
Examples
Benefit
Database
SQL Server, Oracle, MySQL
Centralized project tracking
File
Excel, CSV, JSON
Flexible data import/export
Cloud
Amazon Redshift, SAP HANA
Real-time analytics
Interactive Reporting and Drill-Downs
Interactive reporting and drill-downs give you the power to explore data in detail. You click on summary metrics to reveal underlying information, such as task trackers or risk overviews. FineReport'sdashboard layout supports multi-page views, letting you organize data by project, department, or KPI. You use parameter queries to filter reports and focus on specific issues. This interactivity helps you identify bottlenecks, monitor resource utilization, and track completed versus remaining tasks. When you drill down, you uncover trends and risks that might not be visible in summary reports. This feature makes your portfolio dashboard a valuable tool for ongoing portfolio analysis.
Real-time updates ensure your dashboard reflects the most current information.
Collaboration features allow your team to work together on the same dashboard, improving alignment and accountability.
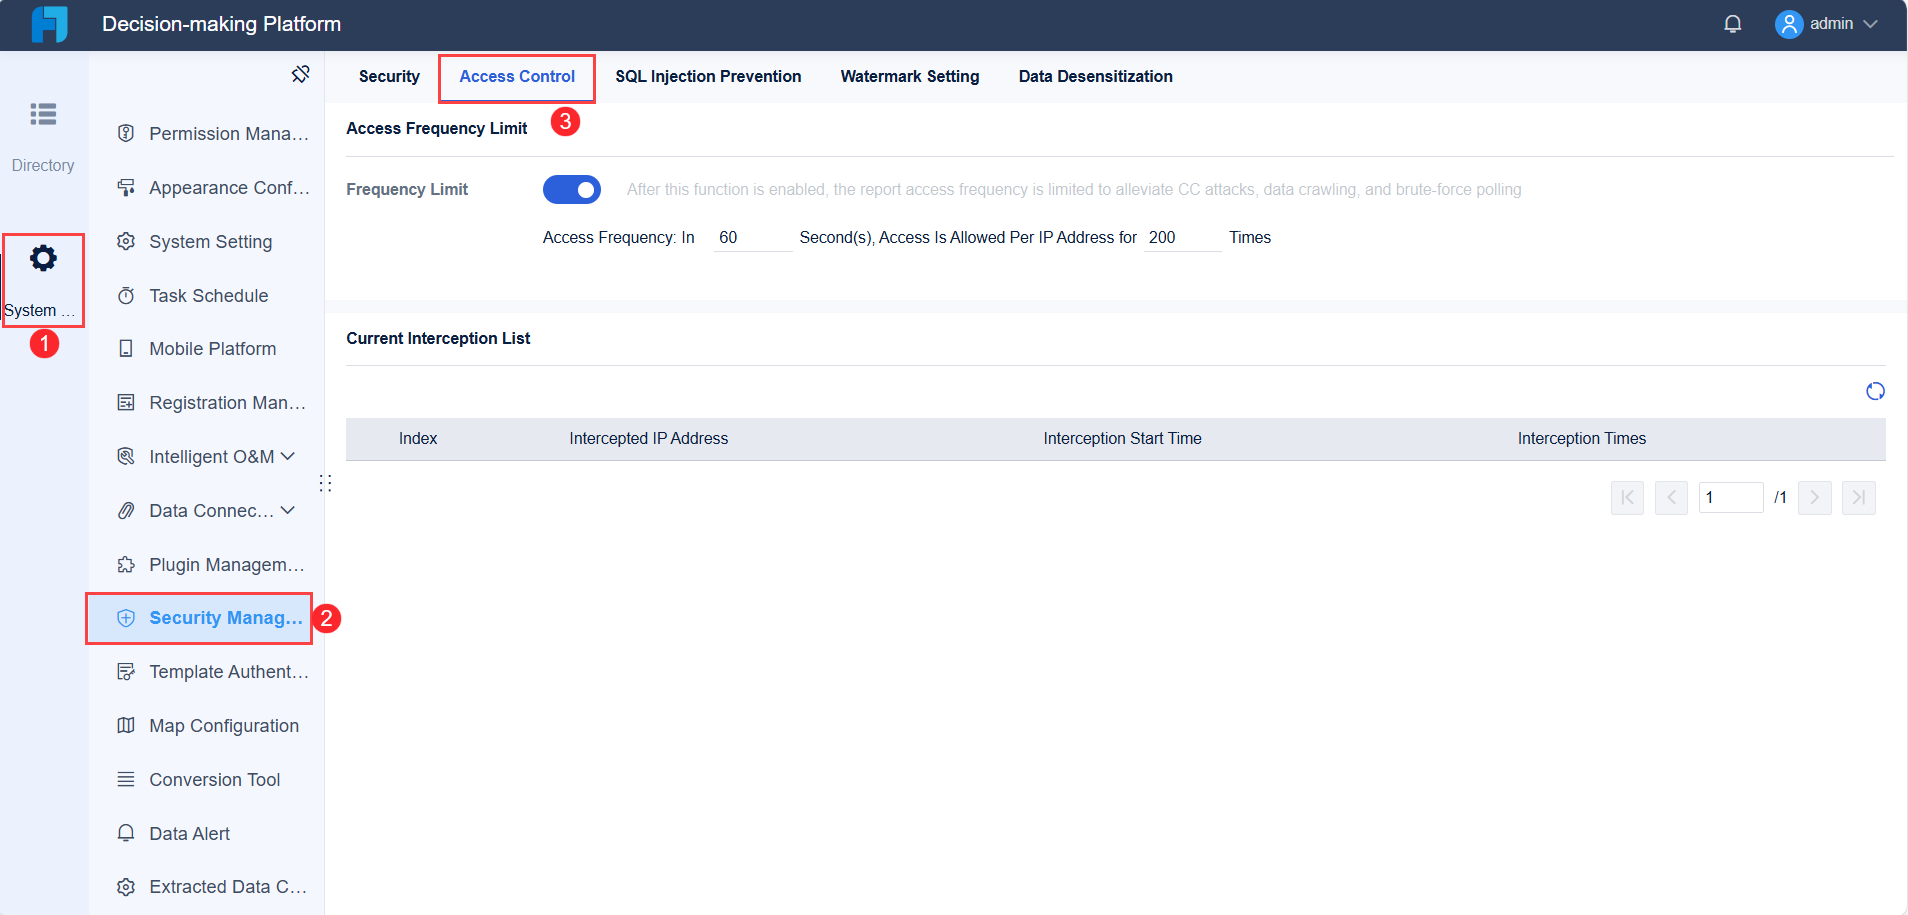
Security and permission controls protect sensitive information in your portfolio dashboard. You assign access rights based on user roles, ensuring each team member sees only the data relevant to their responsibilities. FineReport’s decision-making platform includes robust permission management, user account control, and data security features. You manage who can view, edit, or share reports, reducing the risk of unauthorized access. Scheduled tasks automate report distribution, so stakeholders receive updates securely and on time. These controls help you maintain data integrity and comply with industry regulations.
Tip: Always review permission settings regularly to ensure your portfolio dashboard remains secure as your team grows or changes.
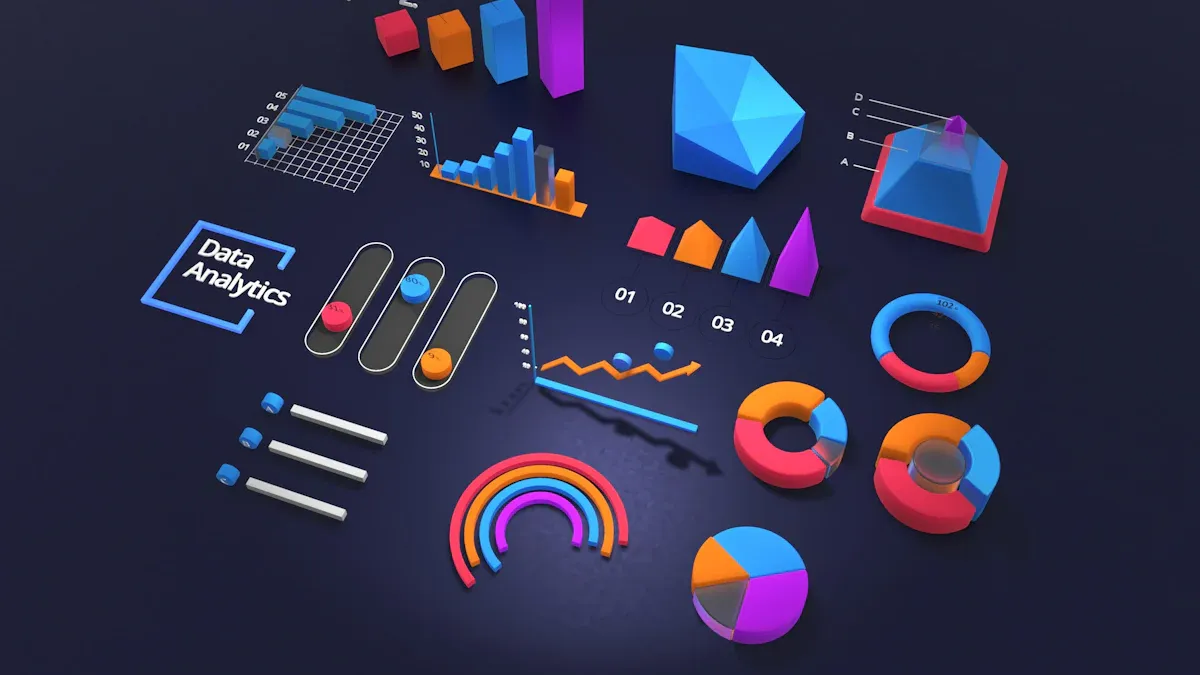
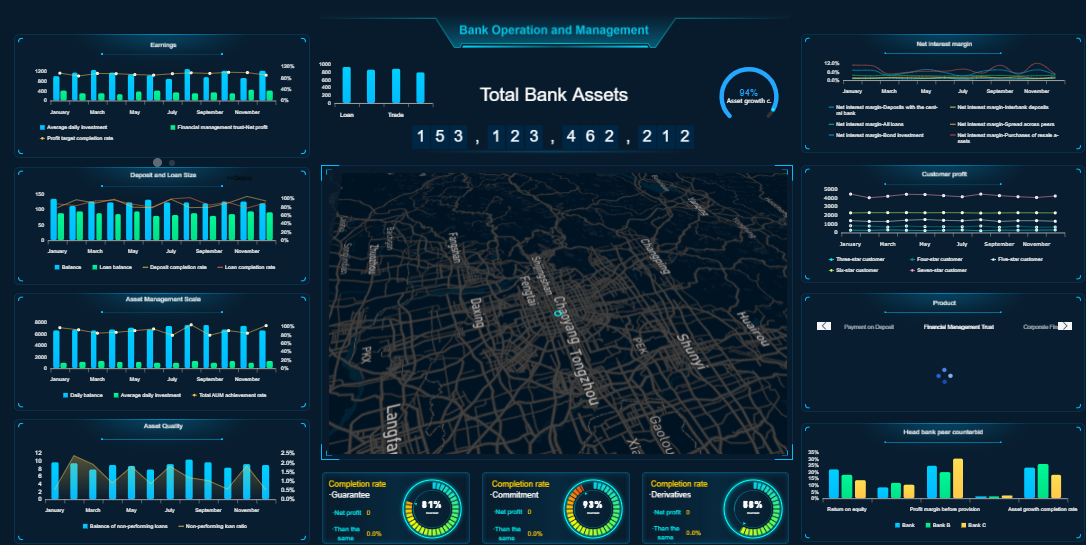
Mobile and 3D Dashboard Capabilities
Mobile and 3D dashboard capabilities enhance accessibility and engagement. You access your portfolio dashboard on smartphones, tablets, or large displays, staying informed wherever you are. FineReport’s mobile dashboard puts key metrics at your fingertips, letting you monitor sales, customer engagement, and operational efficiency in real time. The 3D dashboard visualizes complex data, such as production lines or logistics routes, making it easier to spot trends and issues. Augmented reality features allow you to compare planned and actual work directly on-site, providing accurate insights for project managers. These capabilities support fast decision-making and improve collaboration across teams.
AR-enabled devices help you monitor project progress in real time.
3D visualizations provide a clear view of project components and status.
When you use these key elements in a project portfolio dashboard, you create a powerful tool for managing projects, optimizing resources, and driving business success. FineReport'sfeatures—customizable visualization, data integration, interactive reporting, security controls, and mobile access—help you build dashboards that support your goals and enhance portfolio analysis.
When you manage multiple projects, you need differenttypes of project portfolio dashboards to meet specific business needs. Each dashboard type focuses on unique metrics and supports distinct decision-making processes. You can choose the right dashboard based on your role and objectives.
Executive Portfolio Dashboards
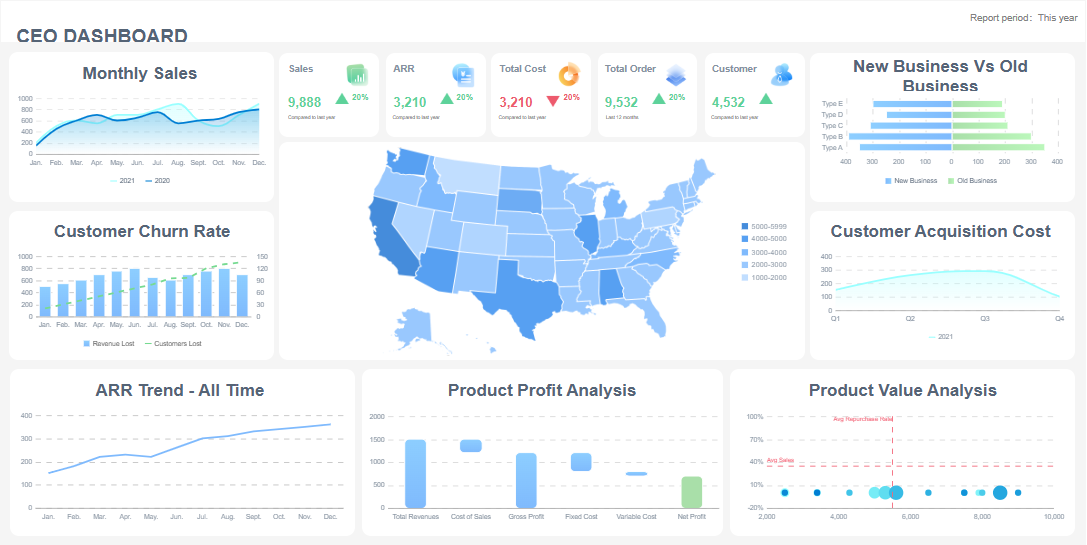
Executive portfolio dashboards give you a high-level overview of your organization’s performance. You see essential metrics and trends that help you make strategic decisions. These dashboards simplify complex data into actionable insights. You gain real-time visibility into key performance indicators and can respond quickly to changes. Executive dashboards consolidate information, making it easier for you to align your team with long-term goals.
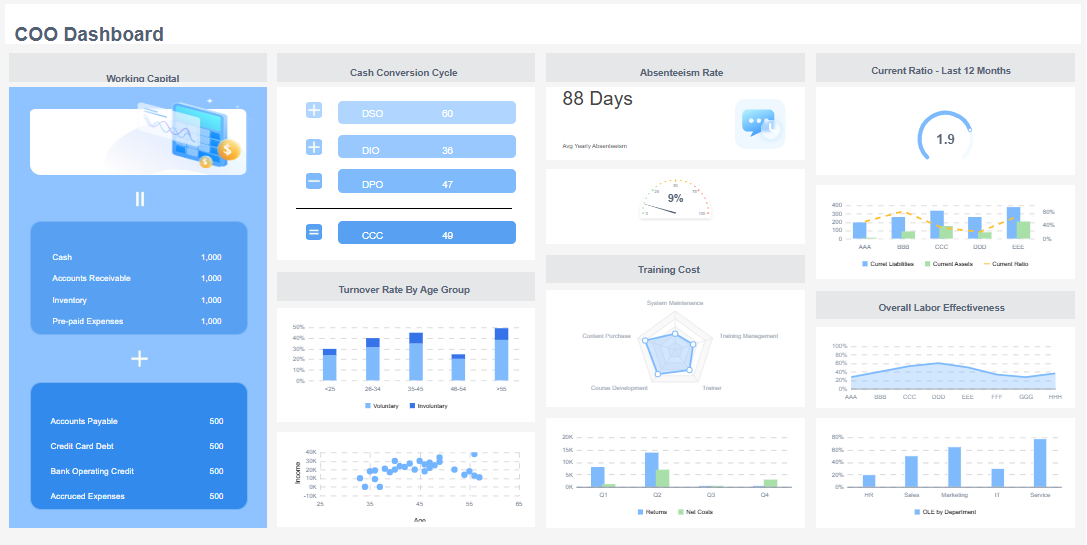
Operational project portfolio dashboard solutions help you monitor day-to-day activities. You use these dashboards to track project progress, resource utilization, and task completion. Operational project portfolio dashboard tools provide detailed views of timelines, milestones, and team performance. You identify bottlenecks and optimize workflows. These dashboards ensure that your projects stay on schedule and meet quality standards.
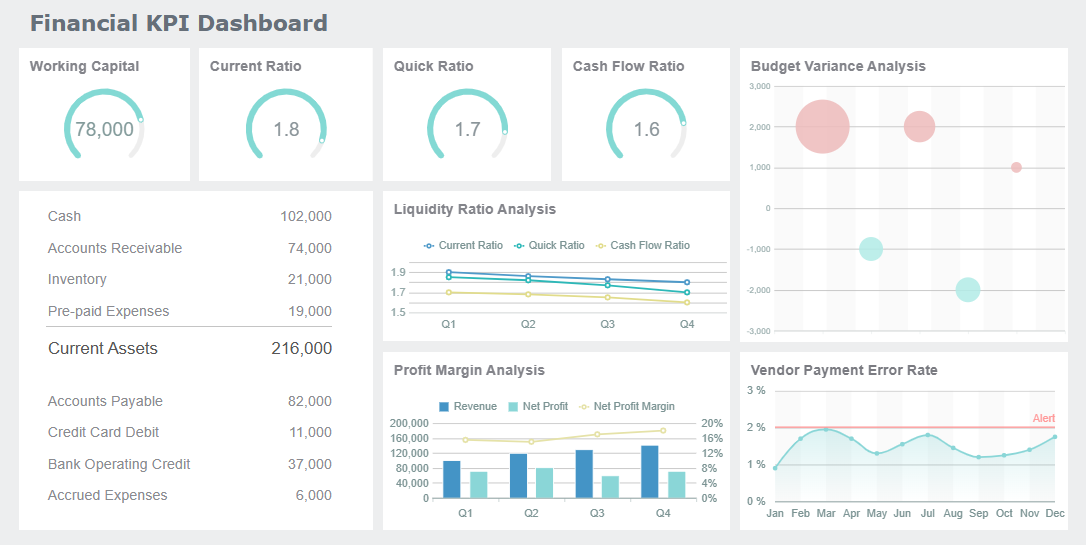
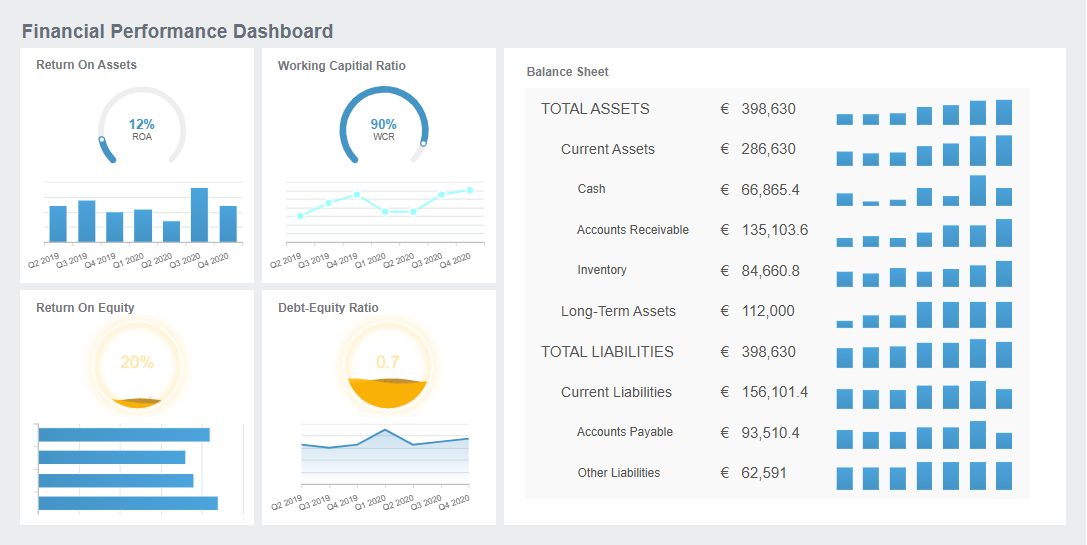
Financial project portfolio dashboard tools focus on your organization’s financial health. You use a financial project portfolio dashboard to review profit and loss, cash flow, and revenue trends. These dashboards summarize and interpret financial data, helping you make informed decisions. Financial project portfolio dashboard solutions provide real-time updates, allowing you to compare actuals with targets and manage budgets effectively.
Industry-specific dashboards address unique requirements in sectors such as manufacturing, healthcare, or IT. You customize these dashboards to track metrics relevant to your field. For example, a financial project portfolio dashboard in healthcare might focus on patient billing and insurance claims. An operational project portfolio dashboard in manufacturing could monitor production output and equipment status. You gain insights tailored to your industry, supporting better decision-making.
Tip: Choose a project portfolio dashboard that matches your business goals and industry needs. Customization ensures you get the most value from your data.
Best Practices for Project Portfolio Dashboard
Setting Clear Objectives and KPIs
You need to start with clear objectives when building a project portfolio management dashboard. Define what you want to achieve. Setmeasurable KPIs for each project. For example, you might track on-time delivery, resource utilization, or customer satisfaction. Clear goals help you focus your dashboard and make it easier to measure success. When you set KPIs, you can compare actual results with targets and adjust your strategy as needed.
Choosing the Right Tool (e.g., FineReport)
Selecting the right tool is essential for effective dashboards. Look for a solution that supports real-time data, customizable layouts, and integration with your existing systems. FineReport offers a drag-and-drop interface, mobile access, and strong data visualization features. You can connect to multiple data sources and automate reporting. These features help your project management office save time and reduce errors. FineReportalso provides training resources to help your team get started quickly.
Ensuring Data Quality and Integration
Accurate data is the foundation of any dashboard. You should regularly check your data sources for errors or outdated information. Integrate data from all relevant systems, such as finance, HR, and operations. This approach gives you a complete view of your projects. A budget tracking dashboard relies on up-to-date numbers to support decisions. FineReport makes it easy to connect and validate data from different sources, ensuring your dashboard stays reliable.
User Training and Adoption
Your dashboard will only succeed if your team knows how to use it. Provide training sessions and clear documentation. Encourage users to explore features like drill-downs and interactive reports. FineReport offers online tutorials and support to help users at every level. When your team feels confident, they will use the dashboard more often and make better decisions.
Avoiding Common Mistakes
Avoid cluttering your dashboard with too much information. Focus on the most important metrics. Review your dashboard layout regularly and remove outdated or unused elements. Test your dashboard with real users to find issues early. Pay special attention to budget tracking, as mistakes here can lead to costly errors. Keep your dashboard simple, clear, and focused on your business goals.
Tip: Schedule regular reviews of your dashboard to ensure it continues to meet your needs as your projects evolve.
You drive business growth when you adopt a portfolio dashboard. You gain real-time insights, improve efficiency, and make smarter decisions. Evaluate your current project portfolio management approach and identify areas for improvement. Explore FineReportto build dashboards that fit your needs. Use data-driven insights to achieve better outcomes and stay ahead in a competitive market.
Access a wealth of case studies, industry insights, and solution guides to accelerate digital transformation.
FAQ
What is a portfolio dashboard?
A portfolio dashboard is a digital tool that displays key metrics and project data in one interactive view. You use it to monitor progress, track resources, and analyze trends across multiple projects or investments.
How does a portfolio dashboard improve decision-making?
You gain real-time insights from a portfolio dashboard. This helps you evaluate risks, spot opportunities, and make informed choices quickly. You see all critical information in one place, which supports better planning and execution.
Can you customize a portfolio dashboard for your business needs?
Yes, you can customize a portfolio dashboard. You select the metrics, charts, and layout that match your workflow. Tools like FineReport offer drag-and-drop design and flexible templates for tailored dashboards.
What data sources can you connect to a portfolio dashboard?
You connect a portfolio dashboard to databases, spreadsheets, and cloud platforms. FineReport supports over 500 data sources, including SQL, Oracle, SAP, and Excel, ensuring you have a unified view of your projects.
Is a portfolio dashboard accessible on mobile devices?
You access a portfolio dashboard on smartphones and tablets. FineReport provides mobile dashboards, allowing you to monitor key metrics and project status anytime, anywhere.