An erp dashboard is a visual tool within enterprise resource planning systems that lets you see important business data and trends in one place. You can use an erp dashboard to track real-time information, spot issues, and make quick decisions. Today, 82% of enterprises rely on erp dashboards for real-time data visualization and decision-making.
Metric
Value
Percentage of enterprises using ERP dashboards
82%
FineReport takes your erp system further with advanced dashboard features, seamless integration, and custom options. By using a dashboard with your erp, you get a clear view of your business and can act fast when things change.
ERP Dashboard Overview
An erp dashboard is a visual interface in your erp system that brings together real-time business data, helping you monitor, analyze, and act on key metrics from one central location.
What is an ERP Dashboard
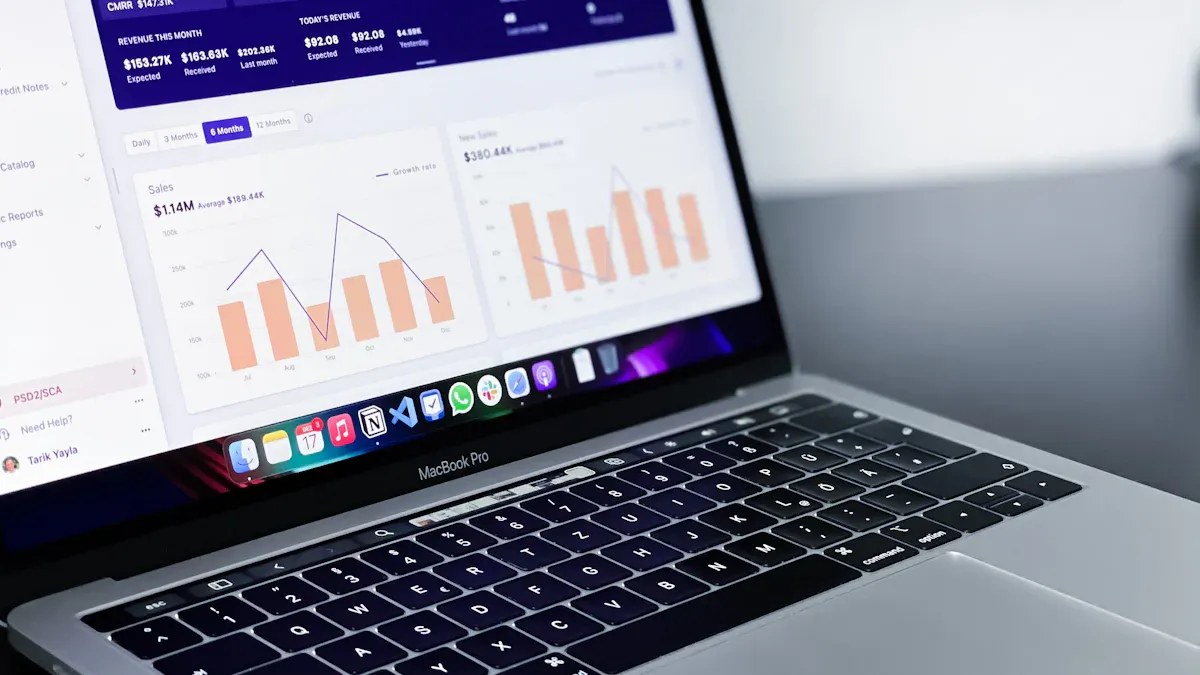
You use an erp dashboard to simplify complex business information. It turns raw data into clear charts, graphs, and tables. This tool helps you see how your company performs across different departments. You can spot trends, track goals, and respond quickly to changes. The dashboard motivates your team to take action because everyone sees the same up-to-date information. You can view high-level summaries or drill down into details as needed. This flexibility makes the erp dashboard a powerful part of your enterprise resource planning strategy.
ERP Dashboard created by FineReport (Click to Engage)
Tip: An erp dashboard streamlines business intelligence and reporting, making it easier for you to make smart decisions every day.
How ERP Dashboards Work in Enterprise Resource Planning
You connect your erp dashboards to many systems, such as MES, CRM, and customer portals. The dashboard pulls data from these sources and updates in real time. This means you always see the latest numbers without waiting for manual reports. The dashboard acts as a central hub, giving you live insights into sales, production, finance, and more. FineReport makes this process simple. You can integrate it with your existing erp system using low-code tools. This lets you build dashboards that fit your business needs. FineReport supports seamless connections, so you get unified reporting and real-time insights on one platform.
Here is how an erp dashboard aggregates and displays data from multiple sources:
Source Type
Data Included
Description
ERP
Orders, Invoices, Payments
Unified views with real-time updates
CRM
Interactions, Opportunities
Integrated customer insights
Customer Portal
Self-service usage
Centralized access to customer data
You can see all your important information in one place. This helps you respond faster and manage your processes more efficiently.
Key Data and Metrics Displayed
You can customize erp dashboards to show the data that matters most to your role. Senior managers often use strategic dashboards to track long-term goals. Operational staff rely on dashboards for daily tasks. Data analysts use analytical dashboards to find patterns. Middle managers use tactical dashboards to monitor projects.
Most dashboards display key metrics from different departments. In manufacturing, for example, you might track these KPIs:
KPI
Description
OEE
Overall Equipment Effectiveness, a measure of production efficiency.
Customer satisfaction
Shows how well products meet customer expectations.
Production volume
Total quantity of products made in a set time.
Reported health and safety incidents
Number of safety-related events in the workplace.
RONA
Return on Net Assets, a measure of profitability.
Equipment downtime
Time when equipment is not working.
Idle time
Time when equipment is available but not used.
Run-time hours
Hours equipment is running.
MTBF
Mean Time Between Failures, a reliability measure.
Planned vs emergency maintenance
Compares scheduled to unscheduled maintenance.
Downtime in proportion to operating time
Shows efficiency of equipment use.
Yield
Percentage of products meeting quality standards.
First pass yield
Percentage made right the first time.
RMA
Tracks returns of faulty products.
Rate of return
Percentage of products returned by customers.
Supplier's quality incoming
Quality of materials from suppliers.
Cycle time
Time from start to end of a process.
Capacity utilization
How much potential output is being met.
Machine downtime rate
How often equipment stops working.
Overtime rate
Percentage of labor hours that are overtime.
You can tailor your dashboard to show only the metrics you need. This helps you focus on what matters and improve your processes. FineReport lets you design dashboards for any department, making it easy to track performance and spot issues early.
ERP Dashboard Features with FineReport
An erp dashboard is a visual interface that displays key business metrics from your erp system in real time, helping you monitor performance and make informed decisions. A data-rich erp dashboard gives you a clear overview of your business, allowing you to track trends, spot issues, and respond quickly. You can customize the dashboard to show the information that matters most to your role, making it a powerful tool for any system.
Data Integration and Visualization
You often face challenges when you try to customize your erp dashboard. Data integration can be slow, and information may get scattered across different systems. FineReport solves these problems by connecting to multiple data sources and bringing everything together in one place. You use a drag-and-drop designer to build dashboards without coding. This makes it easy to create visualizations that help you understand your data.
Supports flexible data visualization and management
Inability to quickly adapt to changing reporting needs
Allows for quick report generation
You can connect your erp system to sources like MES, CRM, and finance platforms. This unified approach helps you avoid data islands and ensures you always have the latest information.
Customization and User Roles
You can tailor your erp dashboard for different users. FineReport lets you set up dashboards for executives, managers, and staff. Each user sees only the data they need. You control permissions, so sensitive information stays secure. You can quickly adapt dashboards as your business changes. This flexibility supports fast decision-making and keeps your system efficient.
You can access your erp dashboard on any device. FineReport supports mobile layouts, so you view key metrics on your phone or tablet. You stay connected to your system wherever you go.
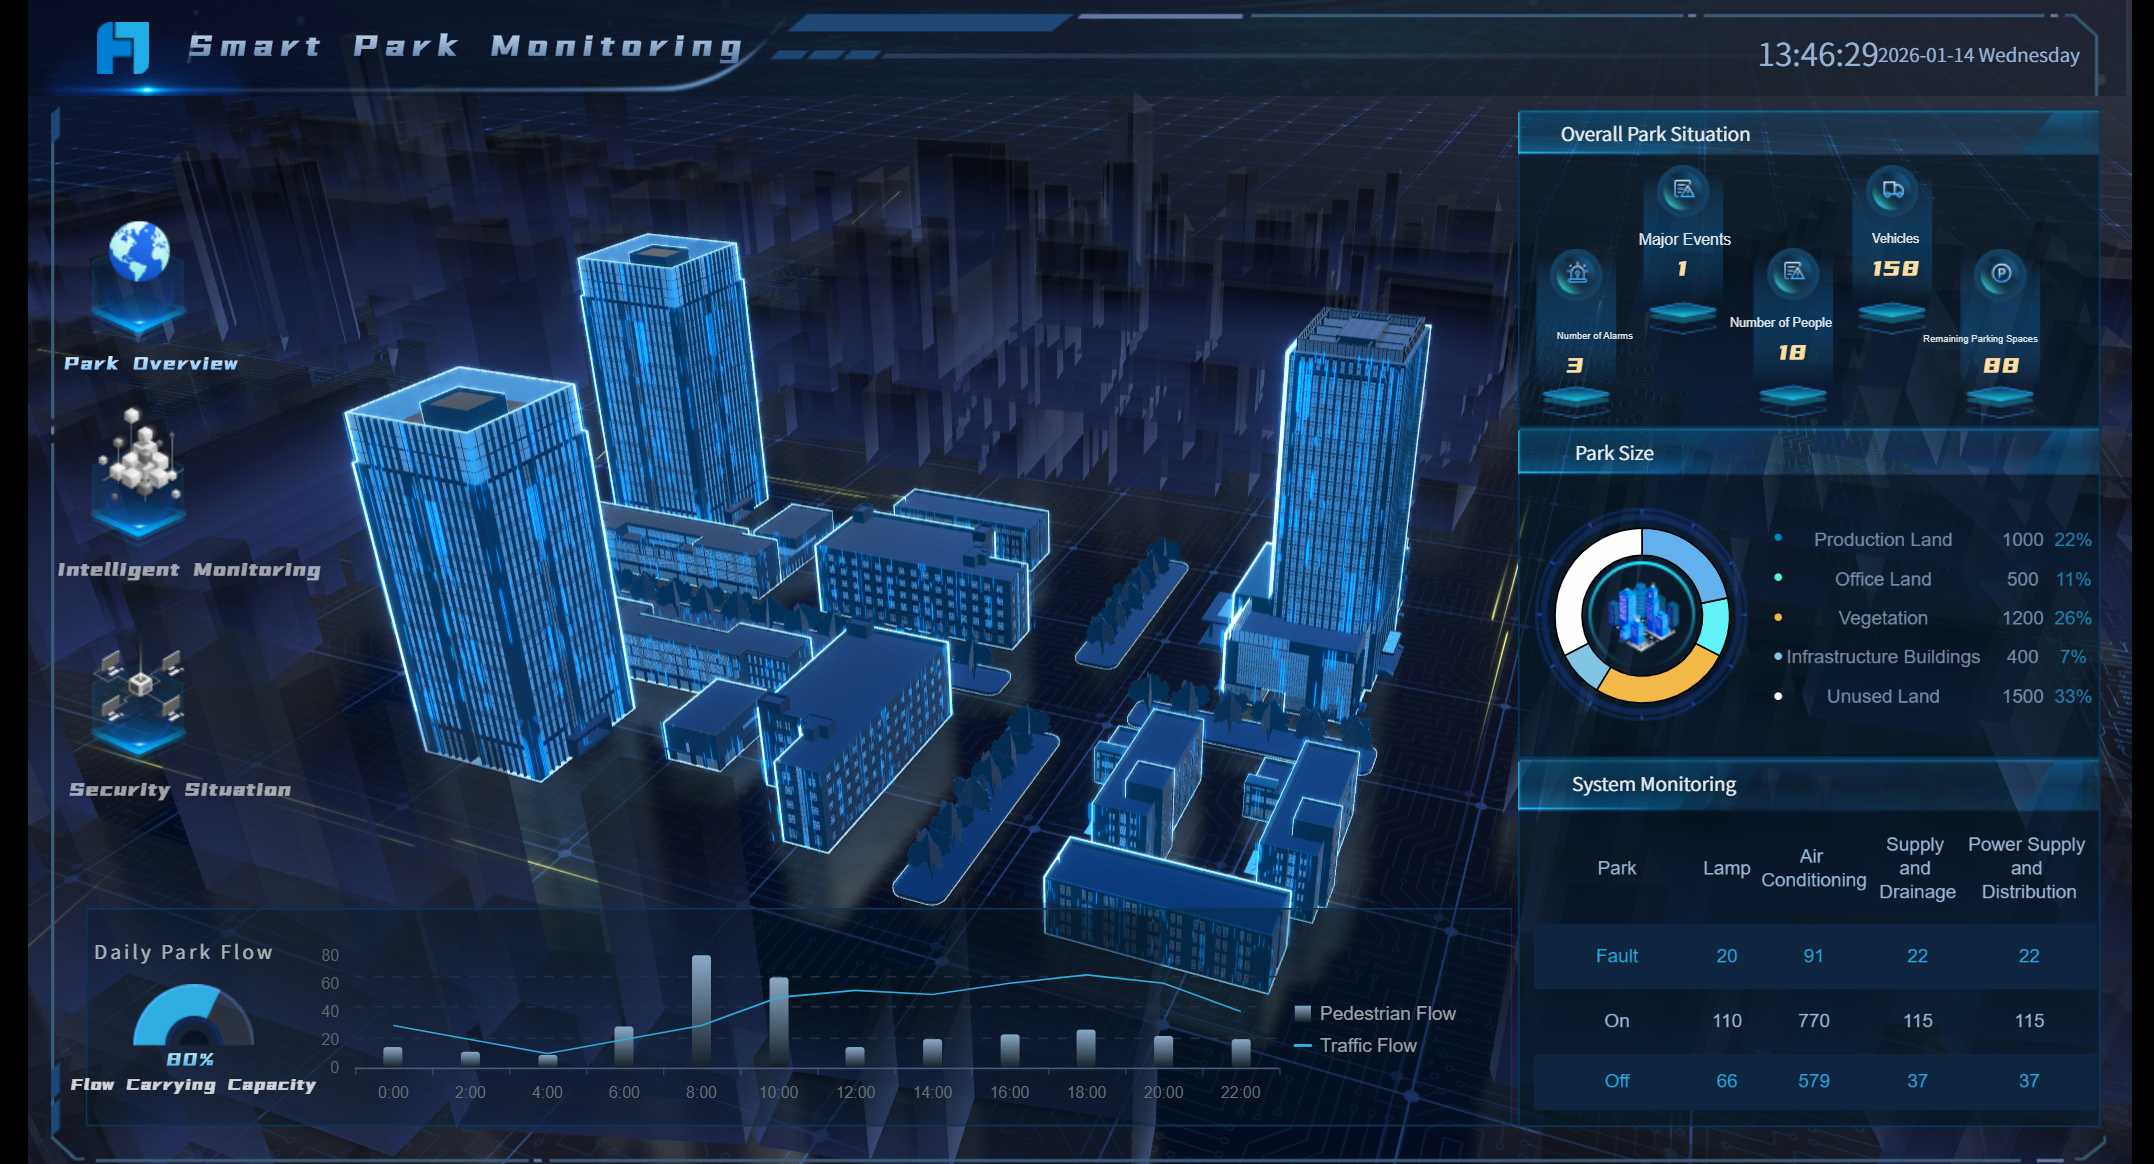
FineReport also offers 3D dashboards for manufacturing analytics. You track real-time KPIs across production lines and spot trends faster. 3D dashboards automate OEE tracking and provide a unified platform for visualizing manufacturing data. You use 3D digital twins to create virtual models of your production environment. This helps you analyze and optimize operations in one place, improving decision-making and efficiency.
3D dashboard created by FineReport (Click to Engage)
Tip: Use mobile and 3D dashboards to keep your business agile and data-driven.
ERP Dashboard Benefits for Business
An erp dashboard is a visual tool in your enterprise resource planning system that brings together real-time insights, key metrics, and ai-powered insights from across your organization, helping you make faster and smarter decisions while streamlining processes and improving collaboration.
Real-Time Insights and Decision-Making
You gain real-time insights when you use erp dashboards. These dashboards collect live data from every department in your system. You see performance trends and key metrics instantly. This immediate access helps you respond quickly to changes and allocate resources more effectively. For example, finance teams can view cash flow and budget utilization without delay. Centralized dashboards let you track performance and make confident, data-driven decisions. With real-time reporting, you identify issues early and act fast. By breaking down communication barriers, your teams share updates and reach decisions together. Ai-powered insights highlight trends and suggest actions, making your decision-making process even stronger.
Benefit
Improvement Percentage
Month-end close time
Up to 30%
Finance team productivity
Up to 40%
Instant access to KPIs
N/A
Streamlined Reporting and Automation
You save time and reduce errors with erp dashboards. Automated reporting systems collect data from multiple sources and process it into templates. Reports generate on schedule, so you focus on analysis instead of manual work. Dashboards update instantly, and automation handles routine tasks. This shift allows your teams to work on strategic projects. Many organizations have cut order processing time by 45% and made financial reporting 70% faster. Monthly reconciliation now takes half the time, and forecasting accuracy improves by 30%. Ai-powered insights help you spot patterns and automate repetitive tasks, making your system more efficient.
Scheduled reports free up your team for higher-value work.
Interactive dashboards make data more engaging and actionable.
Collaboration and Security
You improve collaboration when you use erp dashboards. Your system provides centralized data access, so every department works with the same real-time insights. Immediate updates and notifications support real-time communication. Automation streamlines workflows and reduces delays. Shared goals and KPIs align your teams and foster accountability. FineReport strengthens this with permission control and robust data security. You decide who sees what, keeping sensitive information safe. Ai-powered insights support teamwork by highlighting shared opportunities and risks.
Tip: Use erp dashboards to connect your teams, protect your data, and drive better results with real-time insights.
ERP Dashboard Use Cases in Manufacturing
An erp dashboard is a visual tool in your erp system that displays key business metrics, helping you monitor, analyze, and optimize processes using real-time data from multiple sources.
Smart Factory and Agile Manufacturing Solutions
You use erp dashboards in manufacturing to improve efficiency and agility. In a smart factory, you track production KPIs, monitor inventory, and oversee quality control from one central system. Real-time data integration lets you respond quickly to changes in production demands. AI-driven analytics help you predict maintenance needs and allocate resources, which boosts operational efficiency. Automated workflows streamline processes, reducing downtime and increasing productivity.
Here are common use cases for erp dashboards in manufacturing:
Production monitoring: Track KPIs and spot issues fast.
Workforce productivity: Analyze employee metrics for training.
Quality control: Monitor defect rates and yield.
Inventory management: Watch stock levels and sales rates.
Maintenance management: Schedule preventive maintenance based on equipment performance.
Yieh Phui Enterprise, a leading steel coil manufacturer, transformed its operations using FineReport erp dashboards. You can learn from their experience. Before FineReport, their system struggled with slow report development and limited data visualization. After implementation, they integrated data from ERP, MES, and other sources. Now, managers use dashboards to monitor production, track product releases, and receive real-time alerts. The company improved efficiency, reduced manual errors, and responded faster to anomalies. FineReport helped Yieh Phui build a smart factory, supporting their digital transformation and management goals.
Note: FineReport’s flexible dashboard design and seamless integration make it easy for you to adapt your system as your business grows.
Other Industry Applications
You find erp dashboards useful in many industries beyond manufacturing. In logistics, you track shipments and optimize delivery routes. In finance, you monitor budgets and expenses. Healthcare organizations use dashboards to oversee patient care and resource allocation. Each system benefits from real-time data and automated processes, helping you make better decisions and improve performance.
An erp dashboard is a tool that lets you see and manage important business data from your erp system in one place. You get clear, real-time insights that help you make smart decisions and improve your business. FineReport gives you the power to build dashboards that fit your needs. You can connect to many data sources, handle large amounts of information, and keep your data up to date.
Access a wealth of case studies, industry insights, and solution guides to accelerate digital transformation.
FAQ
What is an erp dashboard?
An erp dashboard is a visual tool that shows you real-time business data from your erp system. You use it to track key metrics, spot trends, and make quick decisions. It helps you see all important information in one place.
How does an erp dashboard help my business?
You get instant access to your data. This helps you respond quickly to changes. You can monitor sales, production, and finances. The dashboard makes it easy to find problems and improve your processes.
Can I customize my erp dashboard for different users?
Yes, you can. You set up dashboards for executives, managers, or staff. Each person sees only the data they need. This keeps your information secure and relevant.
Is it possible to use an erp dashboard on my phone?
You can view your dashboard on any device. FineReport supports mobile layouts. You check your business metrics anytime, anywhere.
What types of data can I see on an erp dashboard?
You can see sales numbers, inventory levels, production stats, and more. The dashboard pulls data from many sources. You choose which metrics matter most to you.