What is a restaurant dashboard? It’s a digital tool that brings all your restaurant’s key data—sales, inventory, staffing, and more—into one easy-to-read display. You get a clear, real-time view of your business, which helps you spot issues and act fast.
With real-time data, you can cut down on mistakes and make smarter choices. Take a look at how live analytics change the game:
| Evidence Description | Impact on Error Rates |
|---|---|
| Real-time analytics allow restaurants to make decisions during service. | This proactive approach minimizes errors in service and inventory. |
| Restaurants using real-time analytics reduce costs and improve satisfaction. | Direct link to fewer operational errors. |
| A case study showed a restaurant increased table handling by 25%. | Better resource management and fewer errors. |
Many restaurants face daily challenges like high costs, staff turnover, and delivery headaches:
- Constantly growing operation costs
- Retaining and attracting productive employees
- Inefficient delivery management
If any of these sound familiar, a restaurant dashboard might be what you need to take control and save time.
Restaurant Dashboard Setup For Restaurant Success
A restaurant dashboard gives you a single place to track everything that matters in your business. You see your sales, costs, and customer feedback in real time. This tool helps you spot trends, fix problems quickly, and make better decisions every day.
Choosing Key Metrics and KPIs
You want your restaurant dashboard to show the numbers that matter most. Start by thinking about your goals. Do you want to boost sales, cut costs, or improve customer satisfaction? The right KPIs will help you measure progress and spot issues fast.
Here are some of the most important KPIs you should consider:
- Net profit margin
- Gross margin
- Food cost percentage
- Contribution margin
- Operating margin
- Occupancy cost
- Repeat customer rate
- Customer satisfaction score
- Net promoter score
- Online ratings
- Wait time
- Complaint resolution time
- Food quality score
- Employee turnover
- Table turnover rate
- Server sales per hour
- Employee absenteeism rate
- Productivity per hour
Tracking these KPIs helps you understand your restaurant’s strengths and weaknesses. For example, if you notice your sales per hour are dropping, you can adjust staffing or run a promotion. Consistent measurement lets you see what works and what needs attention.
Customizing Views For Roles
Every team member needs different information from the restaurant dashboard. A manager might want to see daily sales, labor costs, and customer feedback. Chefs focus on inventory and food quality scores. Front-of-house staff care about wait times and table turnover rates.
FineReport makes it easy to customize dashboard views for each role. You can set up dashboards so each person sees only the data they need. This helps everyone work faster and make better decisions. When you tailor dashboards to each role, you create a more intuitive and efficient workflow.
Personalized dashboards also encourage teamwork. When everyone has access to the right information, it’s easier to solve problems together. You can even share dashboards across teams, so everyone stays on the same page.
Here’s a quick look at the technical setup you’ll need for FineReport:
| Component | Recommended Configuration |
|---|---|
| CPU | Intel i5-12400 or AMD R7-4750G and above |
| Memory | 32.0 GB |
| Graphics Card | NVIDIA RTX 3060 Ti or AMD RX 6700 and above |
| Operating System | 64-bit Windows 10 or later |
| Browser | Chrome (latest 64-bit version recommended) |
With the right setup and a focus on the right KPIs, your restaurant dashboard becomes a powerful tool for daily success.
Real-time Monitoring With Restaurant Dashboard
Tracking Sales, Inventory, and Staff
When you use an operations dashboard in your restaurant, you get a live view of everything that matters. FineReport brings together data from your POS, inventory, and staff scheduling systems. You see sales numbers, stock levels, and who’s working—all in one place. This setup helps you spot trends and act fast.
Here’s what happens when you consolidate your data:
- You can quickly see which menu items bring in the most profit.
- You manage inventory better, reducing waste and saving money.
- You adjust staffing on the fly, matching busy times with the right number of employees.
- You avoid flipping through spreadsheets or switching between apps.
Industry experts say that using data analytics gives you a real edge. Restaurants that use an operations dashboard often see a 10-20% boost in profits by optimizing menu pricing and cutting down on food waste. Real-time data lets you track labor costs and make changes before problems grow. You also get instant updates on food usage and costs, which helps you protect your margins.
Automated Alerts For Issues
An operations dashboard does more than just show you numbers. It keeps you ahead of problems with automated alerts. FineReport lets you set up notifications for things like low stock, high wait times, or unusual activity.
Here’s how these alerts help you stay on top:
- You get a message when ingredients run low, so you can reorder before running out.
- The system warns you if wait times spike, letting you step in and keep guests happy.
- AI tools can even flag negative guest feedback in real time, so you can fix issues right away.
These alerts mean you respond faster and keep customers satisfied. Automated systems help you avoid out-of-stock situations and spot service problems before they hurt your reputation. Managers can solve issues quickly, leading to better guest experiences.
| Issue Type | Description |
|---|---|
| Alert Fatigue | Too many alerts or false alarms can make teams ignore important warnings. |
| Data Quality and Latency | Delayed or incorrect data can lead to poor decisions based on the dashboard. |
With the right operations dashboard, you turn data into action. You keep your restaurant running smoothly, make smarter decisions, and deliver better service every day.
Streamlining Daily Tasks Using FineReport
Running a restaurant means juggling dozens of tasks every day. FineReport steps in to make your life easier by turning complex routines into simple, automated workflows. With its flexible data entry forms and mobile dashboard, you can handle staff schedules, kitchen orders, and reservations from anywhere. Let’s break down how you can use FineReport to streamline your daily restaurant operations.
Staff Scheduling and Shift Management
Staff scheduling can get messy fast. You might have last-minute call-outs, overlapping shifts, or trouble tracking overtime. FineReport’s data entry forms let you build a digital schedule that updates in real time. You can assign shifts, track attendance, and approve time-off requests—all from one place.
Here’s how you benefit:
- Drag-and-drop scheduling makes shift planning quick.
- Staff can check their schedules on their phones, reducing confusion.
- The system flags conflicts or overtime, so you avoid costly mistakes.
- You can export schedules to Excel or share them directly with your team.
Managers love this because it saves hours each week and keeps everyone on the same page. For example, Mama’s Fish House saw a 23% drop in staff calls after switching to digital scheduling. Their team handled more than half of all schedule changes through the system, which improved work-life balance for everyone.
Order and Kitchen Coordination
Order flow is the heartbeat of your restaurant. If the kitchen and front-of-house lose sync, you get delays, wrong orders, and unhappy guests. FineReport brings order and kitchen coordination into one dashboard. You can track every order from the moment it’s placed to when it leaves the kitchen.
With FineReport, you can:
- Monitor order status in real time, so nothing slips through the cracks.
- Use mobile dashboards to alert kitchen staff about rushes or special requests.
- Analyze which menu items slow down service and adjust prep routines.
Restaurants like Flame Broiler used these tools to speed up phone order processing by 33% and boost online orders by 14%. They also generated an extra $3 million in night and online sales in just one year. By identifying bottlenecks, they increased annual sales by nearly $70,000 per location and cut labor costs by over $3,600 per store.
Tip: Use FineReport’s multi-report layout to display kitchen performance, order times, and inventory levels side by side. This helps you spot issues and act fast.
Managing Reservations and Customer Flow
Reservations and walk-ins can create chaos if you don’t have a clear system. FineReport's data entry forms let you log reservations, track table status, and manage waitlists in real time. The mobile dashboard shows you which tables are open, which are being cleaned, and how long guests have waited.
Here’s what you can do:
- Accept reservations online or by phone and sync them instantly.
- View customer flow patterns to predict busy times and adjust staffing.
- Set up alerts for long wait times or VIP guests.
YangGuoFu, a leading restaurant brand, used FineReport to unify data from dozens of systems. This move helped them tailor menu offerings, improve supply chain management, and boost both revenue and membership. Their managers now make decisions based on real-time data, which keeps operations running smoothly even during peak hours.
| Restaurant Name | Results |
|---|---|
| Mama's Fish House | Calls decreased by 23%; 57% of calls handled by Loman AI; improved staff work-life balance |
| Flame Broiler | $3M extra from night/online orders; 14% more online orders; 33% faster phone order processing |
- Optimized kitchen flow saved over $3,600 per year in labor at every location.
- Reduced service times by an average of 4.8 minutes, improving product quality by 4%.
- Increased annual sales by almost $70,000 per location by identifying and resolving bottlenecks.
FineReport gives you the tools to manage every part of your restaurant dashboard, from staff schedules to customer reservations. You get a clear view of your operations, so you can make smarter decisions and keep your team focused on great service.
Data-driven Decisions With Restaurant Dashboard
Analyzing Trends for Menu and Pricing
You want your restaurant dashboard to do more than just show numbers. It should help you make smart choices about your menu and pricing. FineReport's analytics let you see which dishes bring in the most profit and which ones drag you down. You can track sales, food costs, and labor for every menu item. This makes it easy to spot your top sellers and those that need a rethink.
With your dashboard, you can:
- See real-time sales and cost data for each menu item.
- Compare contribution margin and food cost percentage to find your most profitable dishes.
- Group menu items into categories like Stars (high profit, high sales) and Dogs (low profit, low sales).
- Decide which items to promote, adjust, or remove.
When you use these insights, you can update your menu and pricing to boost revenue and keep costs in check. Your dashboard also helps you track key pricing metrics, so you know if your changes work.
| KPI | Description |
|---|---|
| Number of dining transactions | Total number of transactions in a given period |
| Average daily sales | Average revenue generated per day |
| Average check size | Average amount spent per customer |
| Revenue per diner | Revenue generated per individual diner |
| Revenue per available seating hour | Revenue generated per hour per available seat |
| Prime cost ratio | Ratio of prime costs to total revenue |
| Diner count | Total number of diners served |
| Available seats | Total number of seats available |
| Available seat hours | Total hours seats are available for dining |
| Table count | Total number of tables in the restaurant |
| Dine-in transactions | Total transactions for dine-in service |
| Take-out transactions | Total transactions for take-out service |
| Food cost ratio | Ratio of food costs to total revenue |
| Staff labor cost ratio | Ratio of labor costs to total revenue |
| Total labor cost ratio | Total labor costs as a ratio of revenue |
You can use these KPIs to measure the impact of your menu changes and pricing strategies. This leads to higher satisfaction for both you and your guests.
Identifying Bottlenecks and Improving Efficiency
A restaurant dashboard does more than track sales. It helps you spot where things slow down. FineReport gives you a clear view of your operations, so you can find and fix bottlenecks fast. You see all your key performance indicators in one place. This makes it easy to notice when something is off.
Here’s how your dashboard helps you improve:
- You catch slow service or kitchen delays before they become big problems.
- You reduce costs by fixing inefficiencies in labor or inventory.
- You boost overall effectiveness by acting on real-time and historical data.
Many restaurants have seen big gains by using dashboards for continuous improvement. For example, real-time ingredient monitoring cuts waste and keeps quality high. Performance tracking points out where your team can work faster. Predictive analytics help you order just what you need, reducing food waste by up to 25%. Automated inventory management can cut waste by 15%.
| Technology Solution | Benefit |
|---|---|
| Real-time Ingredient Monitoring | Reduces waste; maintains quality |
| Performance Tracking | Identifies operational bottlenecks |
| Supply Chain Disruption Prediction | Prevents stock shortages or delays |
| Task Automation | Frees up staff for core kitchen tasks |
| Integrated Management Systems | Easier performance management |
Almost half of operators reported higher same-store sales after using dashboards to improve efficiency. When you use customer satisfaction reports and real-time data, you can keep making your restaurant better every day.
Team Communication and Permissions in Restaurant Dashboard
Sharing Reports and Insights
You want your team to work together smoothly. FineReport’s decision-making platform makes sharing reports easy and secure. You can send reports to managers, chefs, and front-of-house staff with just a few clicks. Everyone gets the information they need, right when they need it. You can share daily sales reports, inventory reports, and staff scheduling reports. This helps your team stay updated and ready for any challenge.
When you use FineReport, you can set up scheduled reports that go out automatically. Your team receives reports by email or through the mobile dashboard. You can also create summary reports for management and detailed reports for staff. This keeps everyone in the loop and helps you avoid miscommunication. A restaurant chain that used regular pulse surveys saw a 20% jump in team collaboration scores in three months. When you share reports and insights, your team feels more connected and motivated.
Tip: Use group reports to highlight key performance trends and share them during team meetings. This makes it easier for everyone to understand what’s working and what needs improvement.
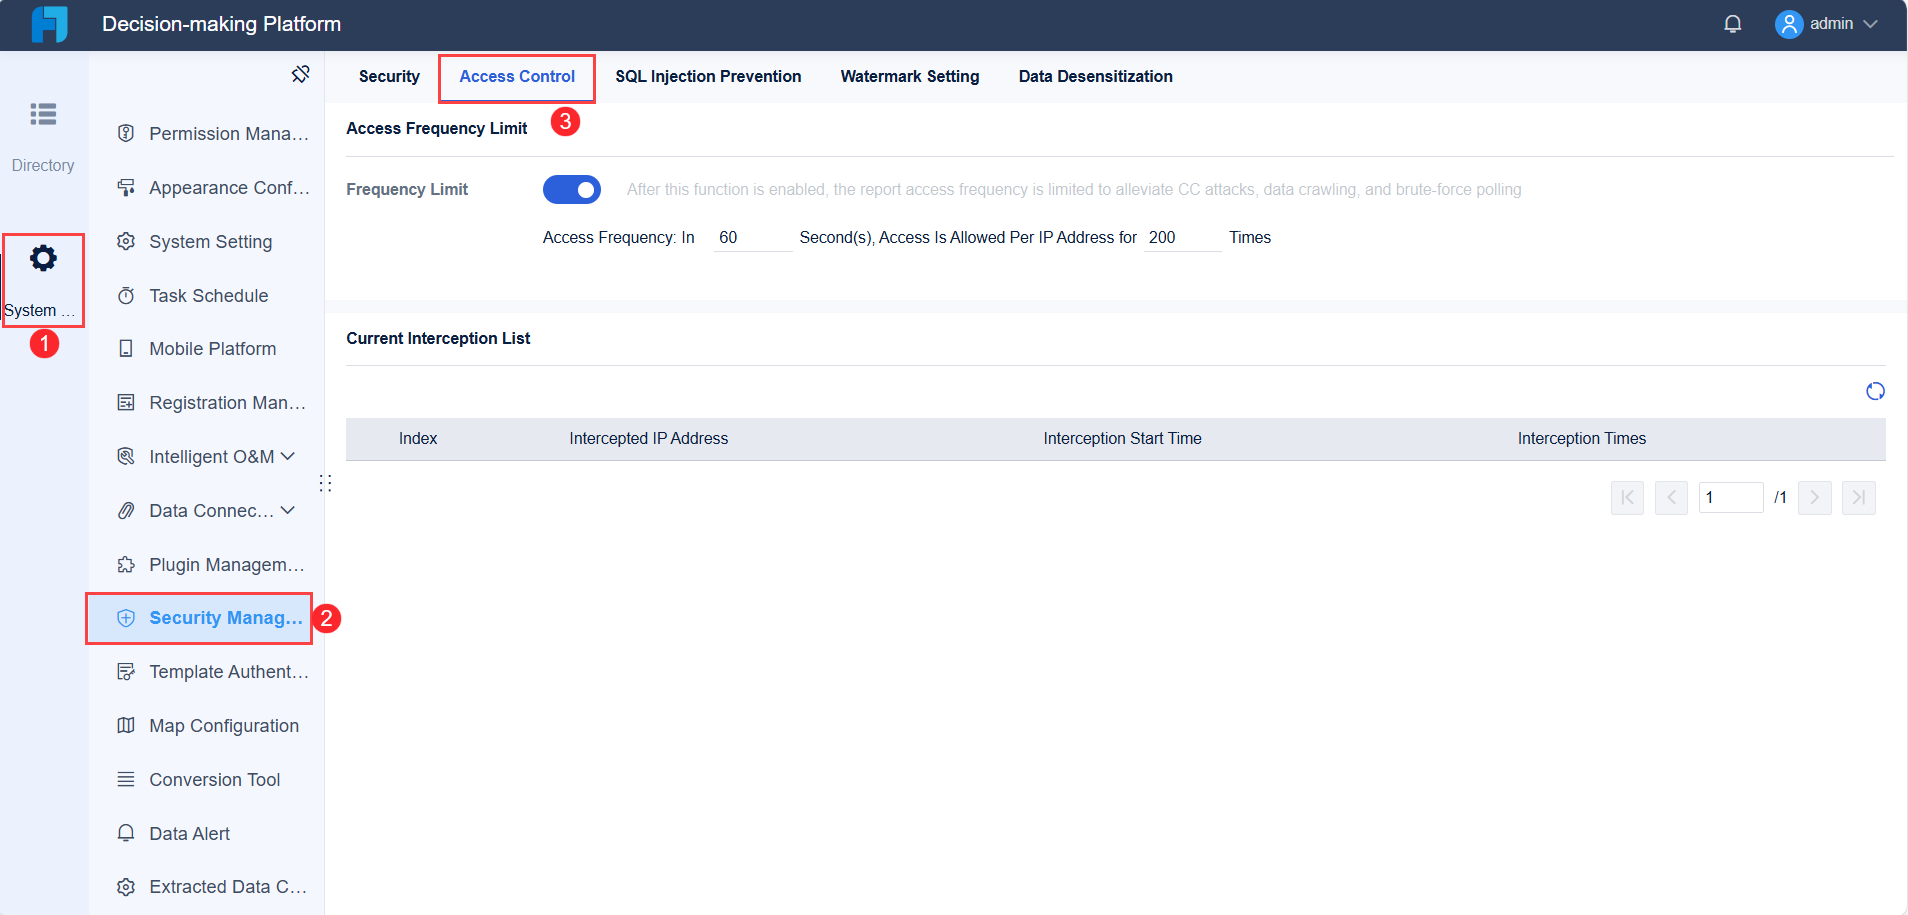
Role-based Access Control
You need to keep your data safe. FineReport lets you set up role-based access control for all your reports. Each user gets a unique account. You decide who can view, edit, or share reports. Servers can process orders and see their own sales reports. Kitchen staff only see orders on the KDS. Managers get access to voids, refunds, and all sales reports. Only the owner or admin has full access to system configuration and all reports.
Here’s a quick look at how you can set up permissions:
| User Role | Process Orders | Process Refunds | Access Sales Reports | Modify Menu Items | View Employee Schedules | System Configuration |
|---|---|---|---|---|---|---|
| Server/Cashier | Yes | No | Own Sales Only | No | No | No |
| Manager | Yes | Yes | All Sales | Yes | Yes | Limited |
| Owner/Admin | Yes | Yes | All Sales | Yes | Yes | Full |
FineReport gives you control over cell data, widgets, hidden rows, toolbars, sheets, and charts in your reports. You can restrict access so only authorized users can change or view certain reports. This keeps your reports accurate and protects sensitive information. Always review permissions when someone changes roles or leaves your restaurant. Regular updates help you maintain data integrity and strong management.
- Servers should only access order processing and their own sales reports.
- Kitchen staff should only view orders on the KDS.
- Managers have extra permissions for refunds and reports.
- Only the owner or admin should have full system access.
When you set up permissions the right way, you keep your reports secure and your team focused on their jobs.
You can transform your restaurant’s daily operations with a dashboard that puts key data at your fingertips. Start by defining clear objectives, organizing data, and tailoring dashboards for each role. FineReport makes this easy. Keep your dashboards fresh by updating content and responding to customer feedback. Track KPIs, optimize your menu, and use technology to boost efficiency. When you review and improve regularly, you build a stronger team and drive business growth.

Continue Reading About Restaurant Dashboard
Best Dashboard Apps for Business Insights
What is a Call Center Dashboard and Why Does It Matter
What is a Reporting Dashboard and How Does it Work
What is An Interactive Dashboard and How Does It Work
What is a Call Center Metrics Dashboard and How Does It Work


FAQ

The Author
Lewis
Senior Data Analyst at FanRuan
Related Articles

Portfolio Reporting for PMOs: 9 Executive Metrics Every Weekly Portfolio Dashboard Should Include
Weekly portfolio reporting should help executives answer three questions fast: Are we delivering the right initiatives, are we putting outcomes at risk, and what decisions need leadership this week? For PMOs, that means
Yida Yin
Jul 01, 2026

How to Build an Investment Portfolio Reporting Dashboard for Executives: KPIs, Benchmarks, and Drill-Down Views
Investment portfolio reporting for executives is not about showing every holding, transaction, and chart your investment team can produce. It is about giving CEOs, CFOs, CIOs, boards, and investment committees a fast, re
Yida YIn
Jun 25, 2026

12 KPI Reporting Examples for Executive Dashboards: What to Show in Weekly, Monthly, and Quarterly Reviews
Executive leaders do not need more data. They need decision ready $1 examples that match how often they review the business and what actions they are expected to take. A weekly $1 should surface fast moving risks and per
Yida YIn
Jun 25, 2026