A strategy reporting tool is the software your team uses to turn business goals, KPIs, initiatives, and performance data into reports that leaders can actually use. If you are comparing options, you are likely trying to solve a practical problem: how to track progress against strategy without relying on scattered spreadsheets, static slide decks, or dashboards that look good but do not support regular decision-making.
For IT managers, strategy offices, finance leaders, operations teams, and business analysts, the real question is not just which tool has the best charts. It is which platform can support the full reporting workflow: data collection, KPI tracking, executive summaries, drill-down analysis, scheduled distribution, and sometimes even data entry or action follow-up.
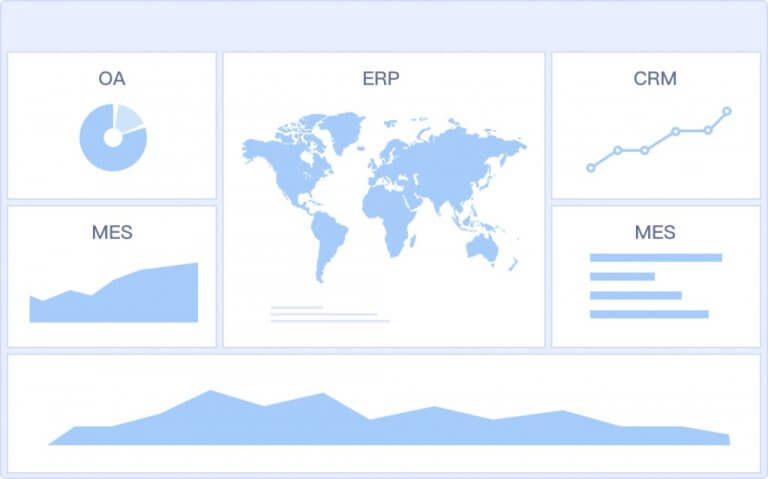
 Click To Try The Dashboard
Key Elements of a Good Strategy Reporting Tool
- Clear KPI-to-goal alignment: The tool should connect metrics to strategic objectives, business units, and initiatives.
- Flexible reporting formats: Teams often need dashboards, printable reports, board summaries, and operational detail views.
- Reliable data integration: It should pull consistent data from business systems, spreadsheets, and databases.
- Role-based access: Executives, managers, analysts, and department leaders should each see the right level of detail.
- Scheduled and repeatable reporting: Monthly, weekly, and quarterly reporting should not depend on manual effort.
- Context for decision-making: Good tools support commentary, trend explanation, variance analysis, and action tracking.
What a strategy reporting tool should help your team do
Before comparing vendors, it helps to define what you actually need the reporting tool to do. Many buying decisions go wrong because teams evaluate visualization features first and reporting workflows second.
A strategy reporting tool should help your organization clarify goals, structure KPIs, and support recurring decision-making. That means more than building a dashboard. It means helping leaders answer questions like:
- Are we on track against strategic goals?
- Which initiatives are delayed or at risk?
- Where is performance improving, declining, or stuck?
- Which departments need follow-up actions?
- How should progress be communicated to executives or the board?
It is also important to distinguish between different reporting needs:
- Executive reporting: High-level KPI summaries, trends, strategic risks, and exceptions
- Operational dashboards: Department-level performance, daily or weekly tracking, drill-down details
- Board-level updates: Structured, polished, printable, and often more narrative reporting formats
The right tool should fit the reporting rhythm of your business. Some users will build reports. Others will only review them during meetings. Some will need live dashboards. Others will need scheduled PDF reports or formatted management packs. Understanding who builds, who consumes, and how often they need insight will make the rest of your evaluation much easier.
Criterion 1: Reporting flexibility and dashboard customization
A strategy reporting tool needs to work for different stakeholders without forcing every team into the same view.
Can different teams create views that match their goals?
Executives usually want simple summaries: KPI status, top risks, and overall progress. Managers often need more detail, such as initiative owners, region-level performance, or department breakdowns. Analysts may need filters, drill-down paths, and trend analysis.
When evaluating a tool, look at:
- Available report and dashboard templates
- Drag-and-drop design options
- Filtering by time, region, department, initiative, or product line
- Chart, table, scorecard, and status visualization choices
- Drill-down or linked report navigation
A flexible platform should let one dataset support multiple reporting views. For example, a CEO might see a strategy summary dashboard while a department head sees the same KPIs with more granular operational detail.
How easy is it to update reports as priorities change?
Strategy changes. KPI definitions evolve. New initiatives are added. Business units merge. If every reporting change requires heavy redevelopment, adoption usually drops.
Look for tools that support:
- Reusable layouts and templates
- Saved views for different roles
- Simple editing workflows
- Centralized logic that reduces duplicate work
- Changes that business users or analysts can manage without excessive technical support
This matters especially for quarterly planning cycles or annual strategy refreshes, when reporting structures often need to be updated quickly.
Criterion 2: Data integration and source reliability
No strategy reporting tool is useful if the data behind it is incomplete, delayed, or inconsistent.
Which systems can the tool connect to?
Strategy reporting usually pulls from multiple systems, not just one BI source. Depending on your business, relevant data may come from:
- CRM platforms for revenue and pipeline
- ERP systems for financial and operational data
- Project management tools for initiative tracking
- HR systems for workforce metrics
- Spreadsheets for manually maintained targets or scorecards
- Data warehouses and databases for consolidated reporting
Ask vendors whether they use native connectors, APIs, manual imports, or a mix of approaches. A tool may look strong in visualization but still require extra effort to consolidate business data before reports are usable.
How trustworthy and current is the data?
This is often where strategy reporting breaks down. Teams debate numbers instead of discussing decisions. To avoid that, assess:
- Data refresh frequency
- Error handling and monitoring
- Validation controls
- Version consistency across reports
- Whether the platform helps establish a single source of truth
For strategic reporting, “current enough” depends on use case. Executive scorecards may refresh daily or weekly. Operational strategy dashboards may need near-real-time updates. Board reporting may rely on locked monthly periods. The right platform should support the cadence you actually need.
Criterion 3: Usability, adoption, and collaboration
A strategy reporting tool only creates value if stakeholders actually use it.
Will stakeholders actually use it?
Many reporting tools are easy for analysts but difficult for occasional business users. That becomes a problem when executives, department leaders, or board members need to review information quickly.
Test the platform for:
- Clear navigation
- Report readability
- Low learning curve for non-technical users
- Mobile or tablet access where relevant
- Good experience for infrequent viewers
If a report takes too much effort to interpret, teams often fall back to PowerPoint summaries or exported spreadsheets. That usually signals the reporting tool is not fully meeting the business need.
Does it support discussion and accountability?
Strategy reporting is not only about presenting metrics. It is also about reviewing progress, discussing issues, and assigning follow-up actions.
Useful collaboration features may include:
- Comments and annotations
- Shared views
- Alerts and notifications
- Metric ownership tracking
- Status notes and action commentary
Even if the tool does not have deep workflow features, it should at least make it easy to support review meetings and accountability processes around strategic goals.
Criterion 4: Strategic alignment and performance tracking
This is where a generic dashboard tool and a true strategy reporting tool begin to diverge.
Can the tool connect metrics to goals and initiatives?
It is not enough to display KPIs in isolation. Strong strategy reporting connects metrics to what the organization is trying to achieve.
Look for support for:
- OKRs or goal hierarchies
- Strategic themes
- Balanced scorecards or scorecard-like structures
- Initiative and milestone tracking
- Department-to-enterprise performance mapping
Users should be able to see how daily or monthly results tie back to broader business strategy. That traceability helps leaders prioritize actions and communicate progress more clearly.
Does it help explain performance, not just display it?
A useful strategy report should answer not only “what happened” but also “why it happened” and “what needs attention next.”
Compare how each tool handles:
- Trend analysis
- Variance reporting
- Benchmarking against targets
- Context notes and narrative commentary
- Risk or blocker visibility
- Corrective action tracking
This is especially important for executive reporting. A dashboard with colored KPI indicators may be visually appealing, but without context, it often fails to support real decision-making.
Criterion 5: Governance, security, and total cost
Reporting software often gets evaluated on front-end usability, but long-term success depends just as much on governance and cost.
What controls protect sensitive information?
Strategy reports frequently include financial metrics, HR indicators, sales performance, or board-level business updates. That means access control matters.
Review whether the platform supports:
- Role-based permissions
- Row-level or report-level access control
- Audit trails
- Controlled sharing and exports
- Data storage and deployment options
- Administrative governance for enterprise use
A reporting tool that works for one department may not scale well if security rules become more complex across business units.
What will the tool really cost over time?
The headline license cost is only part of the decision. Also compare:
- Implementation effort
- Training requirements
- Ongoing support needs
- Scaling costs for more users or more reports
- Time spent maintaining data pipelines or report logic
- Expected gains in reporting quality and efficiency
A cheaper tool can become expensive if it requires too much manual effort, duplicate reporting work, or extensive customization just to meet basic strategic reporting needs.
Quick comparison table
The table below can help structure your evaluation of a strategy reporting tool. These criteria are especially useful when comparing BI-focused dashboard tools with more reporting-oriented enterprise platforms.
| Criterion | What to Evaluate | Why It Matters |
|---|---|---|
| Best for | Executive reporting, operational dashboards, board updates, or all three | Different tools are optimized for different reporting styles |
| Dashboarding | KPI summaries, drill-down, filters, interactive views | Important for leadership visibility and ongoing monitoring |
| Pixel-perfect reporting | Printable layouts, formal reports, board packs, paginated outputs | Critical when polished, structured reports are required |
| Paginated reports | Multi-page reports, recurring management packs, formatted output | Useful for finance, operations, and monthly review cycles |
| Data entry/forms | Manual target updates, initiative status input, workflow-style reporting | Helpful when strategy data is partly operational and partly manual |
| Scheduling and distribution | Automated email, exports, recurring report delivery | Reduces manual reporting workload |
| Enterprise deployment | Permissions, governance, role control, multi-team rollout | Necessary for larger organizations |
| Ease of use | Analyst setup, business-user consumption, update flexibility | Strong adoption depends on usability |
| Recommended users | Executives, PMO, finance, operations, analysts, IT | The best fit depends on your reporting audience |
How to compare vendors and make the final decision
Once you have defined your reporting needs, build a shortlist based on realistic use cases rather than generic product demos.
A practical comparison process usually looks like this:
-
List must-have capabilities
- Executive dashboards
- Board-ready reports
- KPI drill-down
- Scheduled distribution
- Security controls
- Data integration needs
-
Build a weighted scorecard
- Rate each vendor on reporting flexibility, usability, governance, integration, and total cost
- Weight the categories based on business importance
-
Use real reporting scenarios
- Monthly strategy review
- Quarterly board update
- Department performance scorecard
- Initiative risk tracking
-
Run a pilot with real data
- Use actual KPI definitions, real users, and existing source systems
- Measure build time, report quality, and stakeholder adoption
-
Assess long-term fit
- Can the tool scale across teams?
- Can it support both dashboarding and formal reporting?
- Will your team be able to maintain it efficiently?
A pilot often reveals more than a polished sales demo. It shows whether the tool can handle the reporting complexity your organization already has.
Practical recommendations before you choose a strategy reporting tool
Here are five recommendations from a reporting and evaluation perspective:
-
Separate visualization needs from reporting needs
A dashboard tool may work well for KPI monitoring, but strategy reporting often also requires structured reports, recurring management packs, and printable executive summaries. -
Test with a real executive reporting pack
Ask vendors to reproduce an actual monthly or quarterly strategy report, not just a generic dashboard. This quickly shows how well the tool handles formatting, commentary, and repeatable reporting. -
Evaluate update workflows, not just design features
Reports need to change as strategy changes. Focus on how easily your team can update KPI definitions, layouts, filters, and distribution settings over time. -
Check how the tool handles mixed data realities
Many strategy processes combine system-generated metrics with manual updates such as target values, initiative status, or milestone commentary. Make sure the platform supports that reality. -
Choose for adoption, governance, and repeatability
The right tool is the one your stakeholders will actually use regularly and your team can govern consistently across departments.
When FineReport is worth considering for strategy reporting
Tools like Tableau and Power BI are widely used for visualization and BI analysis, but teams with complex reporting workflows may also need a dedicated enterprise reporting platform like FineReport.
FineReport is especially relevant when your strategy reporting process goes beyond interactive dashboards and includes requirements such as:
- Pixel-perfect report design
- Paginated and printable reports
- Parameter-based queries and filtering
- Scheduled report generation and distribution
- Integration of dashboards and detailed reports
- Data entry or form-style workflows for manual updates
- Departmental and enterprise reporting governance
For example, a strategy office may want a leadership dashboard for KPI monitoring, but also need a board-ready monthly report with fixed formatting, commentary sections, initiative status tables, and automated distribution. In these cases, a reporting platform that supports both structured reports and dashboards can be a practical fit.
FineReport can also be useful for organizations that need strategy reporting across finance, operations, sales, manufacturing, or management teams, where reporting often involves a mix of summary dashboards and highly formatted recurring reports.

Get Ready-to-Use Dashboard and Report Templates in Fine Gallery
If your evaluation is centered on highly interactive BI exploration alone, other tools may be suitable. But if your team needs a stronger combination of formal reporting, recurring distribution, dashboard integration, and operational reporting workflows, FineReport deserves a place on the shortlist.
Final thoughts
Choosing a strategy reporting tool is really about choosing how your organization will turn strategic goals into repeatable management decisions. The best option is not necessarily the one with the most visual features. It is the one that helps your team build trusted reports, align metrics with goals, distribute insights consistently, and support action across the business.
If you are comparing tools, use the nine criteria above to structure the evaluation around actual reporting needs rather than surface-level demos. That will help you identify whether you need a dashboard-first BI tool, a more formal enterprise reporting platform, or a combination of both.
FAQs
A strategy reporting tool helps teams connect goals, KPIs, initiatives, and performance data into reports leaders can use for ongoing decisions. It supports recurring reporting beyond basic dashboards or slide decks.
A standard BI dashboard often focuses on visualization, while a strategy reporting tool supports the full workflow of tracking goals, summarizing progress, explaining variances, and sharing reports on a schedule. It is built for regular management and executive review.
Focus on KPI-to-goal alignment, flexible report formats, reliable data integration, role-based access, and scheduled reporting. You should also check whether the tool supports commentary, drill-down analysis, and easy updates as priorities change.
Yes, the right platform should support different views for different roles using the same underlying data. Executives may need summary dashboards, while managers and analysts need more detail, filters, and drill-down options.
Strategy reports often combine information from CRM, ERP, HR systems, project tools, spreadsheets, and databases. Strong integration helps keep reports accurate, timely, and consistent across teams.


The Author
Yida Yin
FanRuan Industry Solutions Expert
Related Articles

Best Carbon Reporting Software for Mid-Market & Enterprise Teams: 2026 Comparison Guide
If you are searching for carbon $1 , you are likely trying to solve more than a simple emissions tracking problem. Most mid market and enterprise teams need a system that can collect activity data across the business, ca
Yida Yin
Jul 01, 2026

Best HR Reporting Tools for 2026: Compare Dashboards, Compliance Reports, and Workforce Analytics
If you are searching for HR $1 , you are likely trying to solve a practical problem: how to turn people data into reports leaders can actually use. That may mean giving HR teams fast access to headcount and turnover dash
Yida Yin
Jul 01, 2026

How to Build an Investment Performance Reporting Framework: The Ultimate Guide to Investment Reporting
Investment $1 is not just a monthly or quarterly output. For asset managers, investment teams, and operations leaders, it is the system that turns portfolio data into oversight, client communication, and decision support
Yida Yin
Jul 01, 2026