Asset performance management is no longer just a maintenance topic. For operations leaders, it is a business discipline for keeping critical equipment available, safe, cost-effective, and aligned with production goals. The challenge is that many teams still run reliability reviews with fragmented spreadsheets, delayed reports, and disconnected maintenance data. That makes it hard to see which assets are drifting toward failure, which KPIs need action, and who should follow up.
With FineReport + Dora, teams can ask for a report summary in chat, generate structured narratives from trusted report assets, receive scheduled briefings, and push exceptions to the right owner. That is especially valuable in asset-intensive environments where uptime, maintenance spend, and risk exposure change quickly.
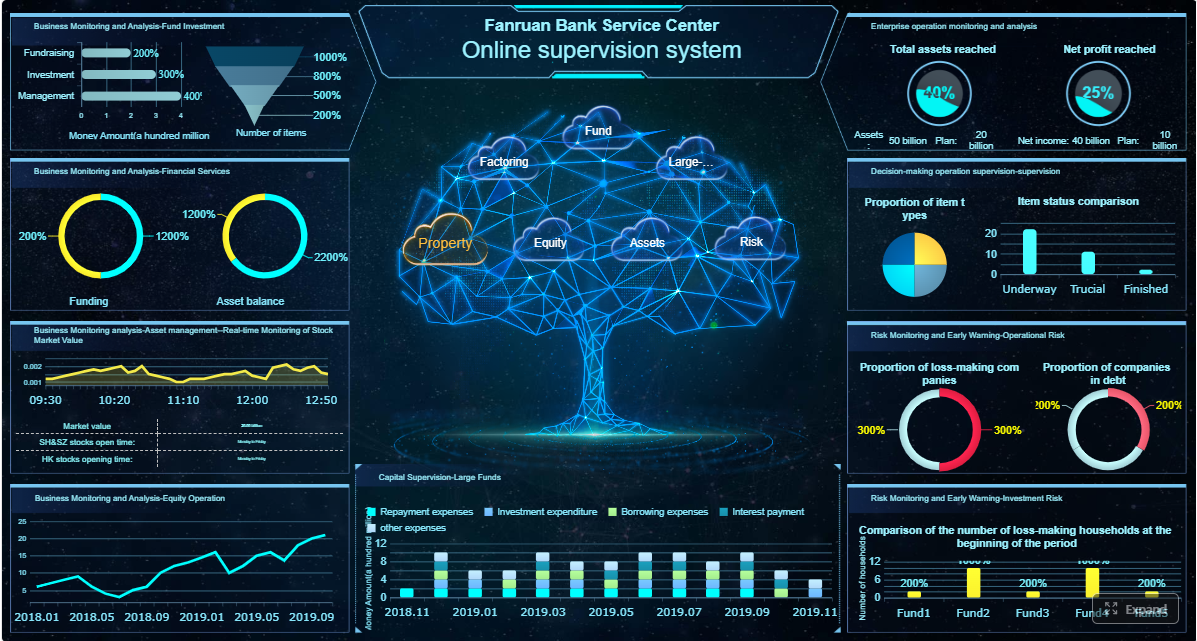 Click To Try The Dashboard
All reports in this article are built with FineReport
Asset performance management, or asset performance management (APM), is the practice of using asset data, maintenance history, operating context, and performance KPIs to improve how physical assets are maintained and operated.
In plain language, APM helps operations leaders answer questions like:
- Which equipment is most likely to cause production loss?
- Where are we spending too much on maintenance without improving reliability?
- Which failures are recurring?
- Which assets need closer monitoring, inspection, or intervention now?
APM connects four decision areas that are often managed separately:
- Reliability: how often assets fail and how consistently they perform
- Maintenance: how work is planned, prioritized, and executed
- Operations: how equipment behavior affects throughput, quality, and uptime
- Risk: how failures affect safety, compliance, cost, and business continuity
A mature APM program does not just record breakdowns after they happen. It helps teams detect deteriorating conditions earlier, prioritize the right assets, and make better maintenance and operating decisions based on KPI-driven reporting.
Reactive maintenance vs. preventive maintenance vs. performance-driven management
These three approaches are related, but they are not the same.
-
Reactive maintenance: Teams repair equipment after failure.
Business value: Sometimes acceptable for low-criticality assets.
AI use: Dora can summarize failure patterns and flag assets with repeated reactive work.
-
Preventive maintenance: Teams maintain equipment on a fixed schedule based on time, usage, or standard routines.
Business value: Reduces some failures, but may still create over-maintenance or missed condition issues.
AI use: Dora can compare planned PM compliance against actual reliability outcomes.
-
Performance-driven management: Teams use asset condition, criticality, reliability KPIs, and risk signals to guide action.
Business value: Supports better balance between uptime, cost, and risk.
AI use: Dora can explain changes in asset health trends, summarize exception lists, and push follow-up alerts to responsible owners.
Performance-driven management is where APM becomes strategic. It shifts maintenance from routine execution to governed decision support.
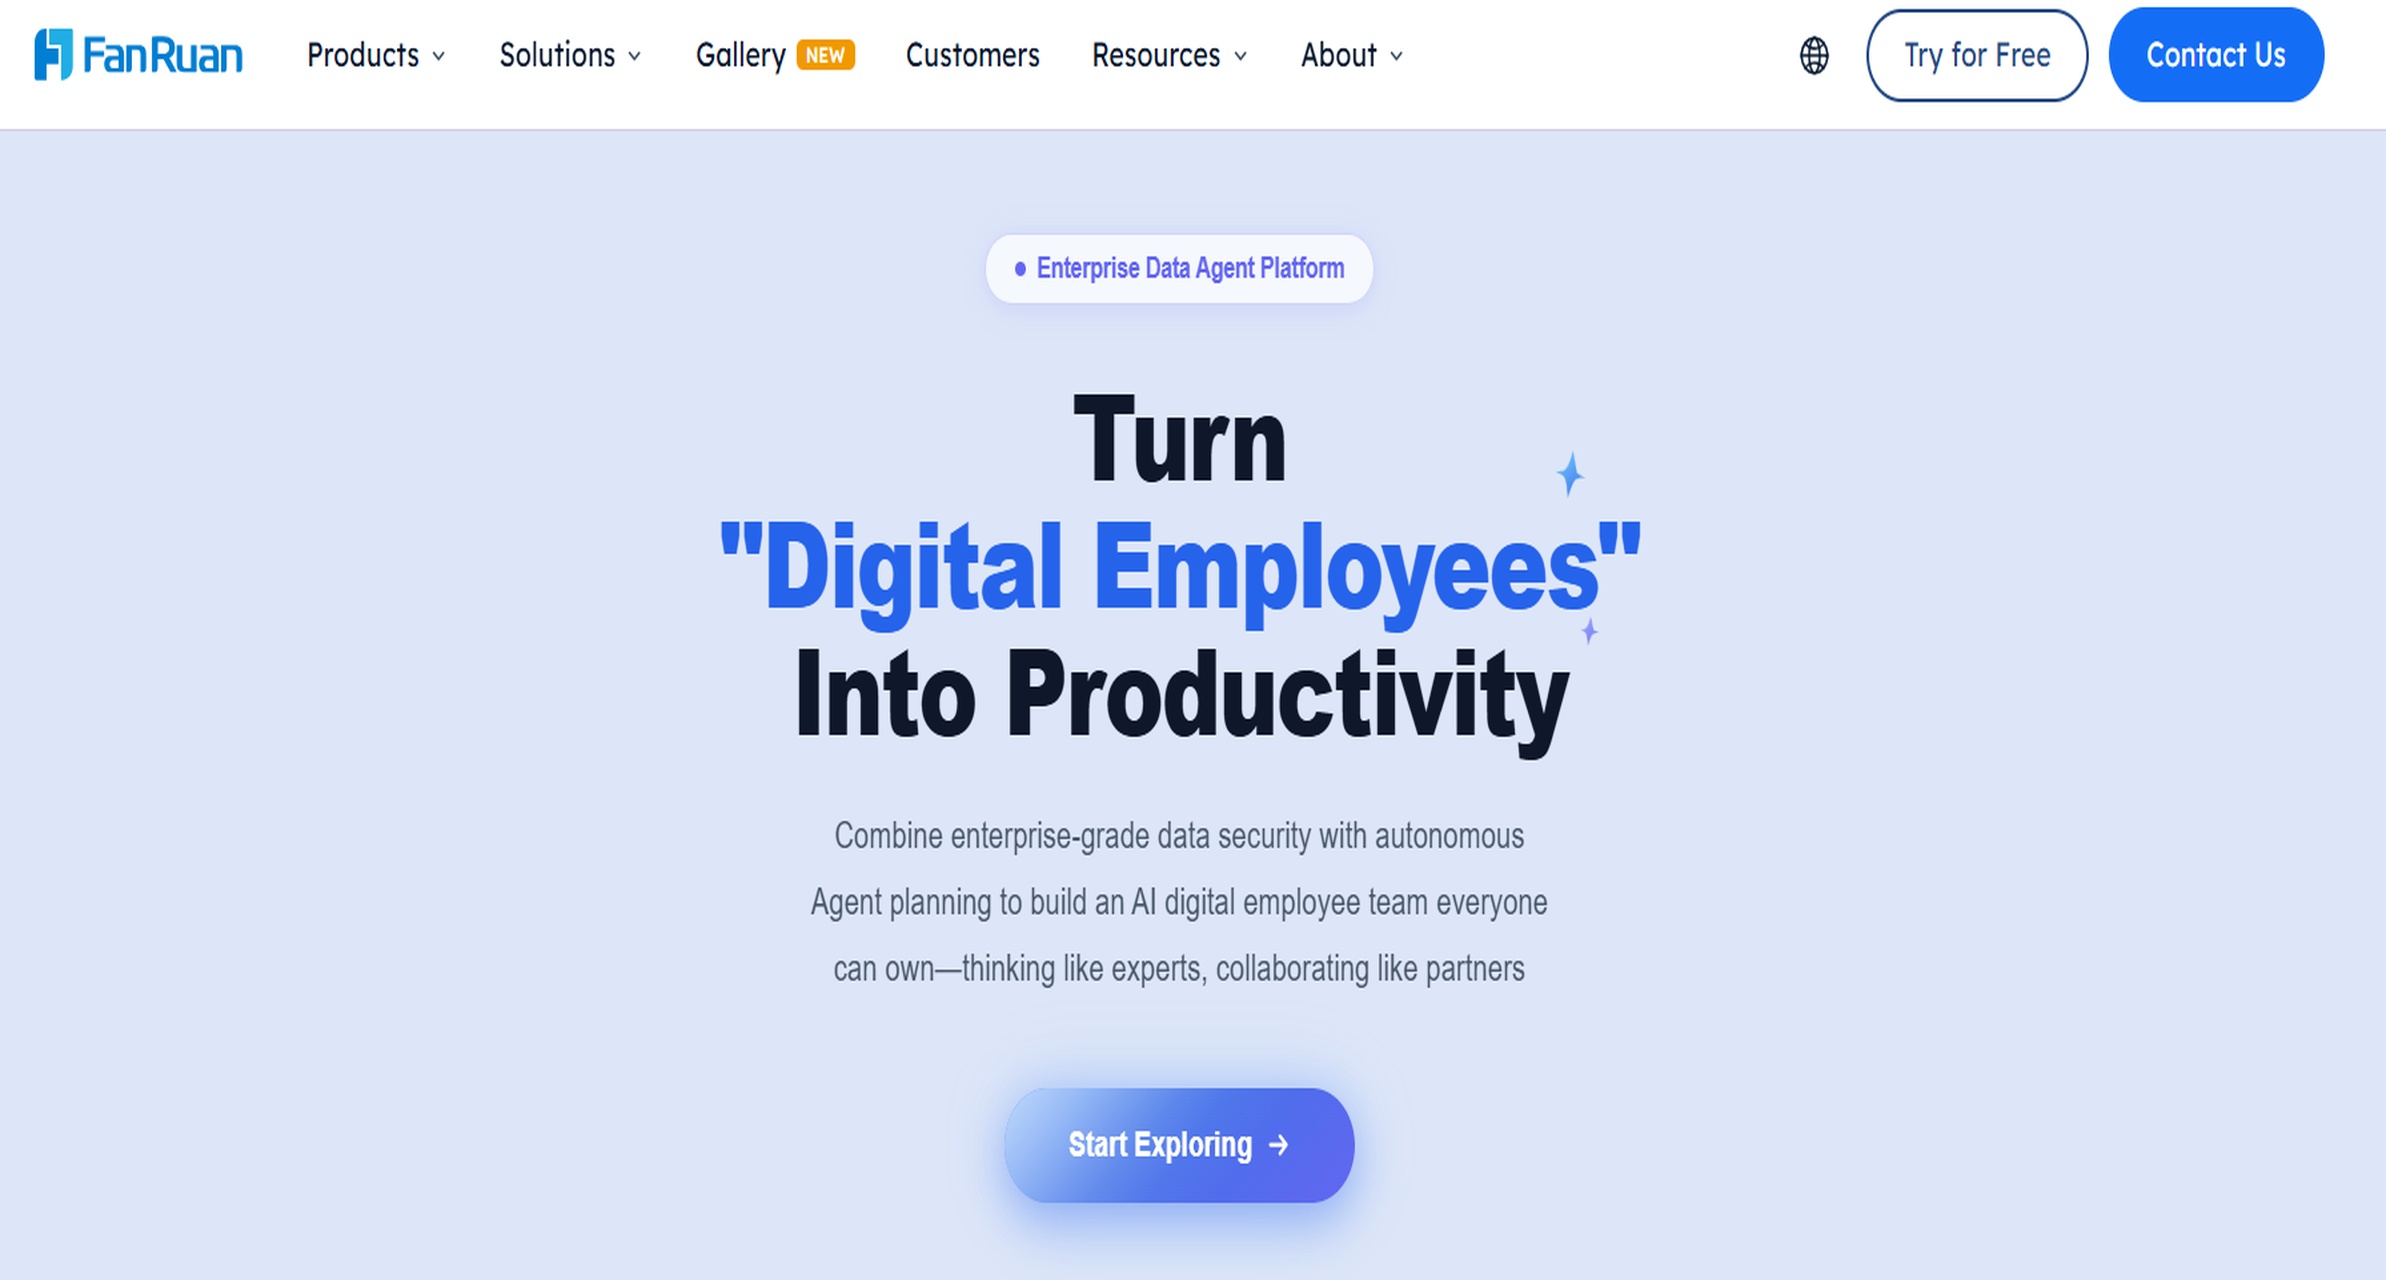
For leadership teams, APM matters because equipment performance affects nearly every operational target. If asset health declines, the results show up in lost output, rising overtime, quality problems, delayed shipments, and higher maintenance cost.
Better visibility into asset health improves three outcomes directly:
- Uptime: Teams can identify developing issues before they become major outages.
- Cost control: Maintenance work can be prioritized based on risk and performance impact.
- Safety: Abnormal conditions, overdue inspections, and recurring faults can be escalated earlier.
KPI-driven reliability reporting turns APM from a technical initiative into a management system.
The leadership KPIs APM should support
Operations and maintenance leaders usually need reliability reporting tied to concrete business metrics.
-
OEE (Overall Equipment Effectiveness): Measures how equipment availability, performance, and quality affect production output.
Business value: Connects asset performance to plant productivity.
AI use: Dora can summarize which reliability issues are driving OEE loss and prepare a management narrative from the FineReport cockpit.
-
MTBF (Mean Time Between Failures): Measures the average operating time between failures.
Business value: Indicates equipment reliability over time.
AI use: Dora can explain which asset groups show MTBF decline and include trend commentary in a weekly briefing.
-
MTTR (Mean Time To Repair): Measures the average time needed to restore an asset after failure.
Business value: Reflects maintenance responsiveness and repair efficiency.
AI use: Dora can identify prolonged repair cases, summarize causes, and push exception follow-up lists.
-
Availability: Measures how often equipment is ready when needed.
Business value: Supports production stability and service performance.
AI use: Dora can answer chat questions about availability gaps by line, plant, or asset class.
-
Maintenance spend: Tracks labor, materials, contractor cost, and emergency maintenance expense.
Business value: Helps control reliability cost and evaluate maintenance strategy.
AI use: Dora can compare spend against downtime and reliability outcomes to support smarter review discussions.
Why reporting must move beyond lagging indicators
Many reliability reports still focus mostly on lagging indicators such as last month’s failures, downtime hours, or maintenance cost totals. These are useful, but they are not enough.
Leaders also need leading indicators that support earlier action, such as:
- overdue preventive maintenance
- repeated alarms or abnormal condition trends
- inspection findings by severity
- rising vibration or temperature patterns
- work order backlog for critical assets
- repeat failures within a short time window
FineReport helps standardize these indicators in formatted reports and operational cockpits. Dora adds the AI assistant layer so users do not have to manually read every chart, compare every trend, or write every summary by hand.
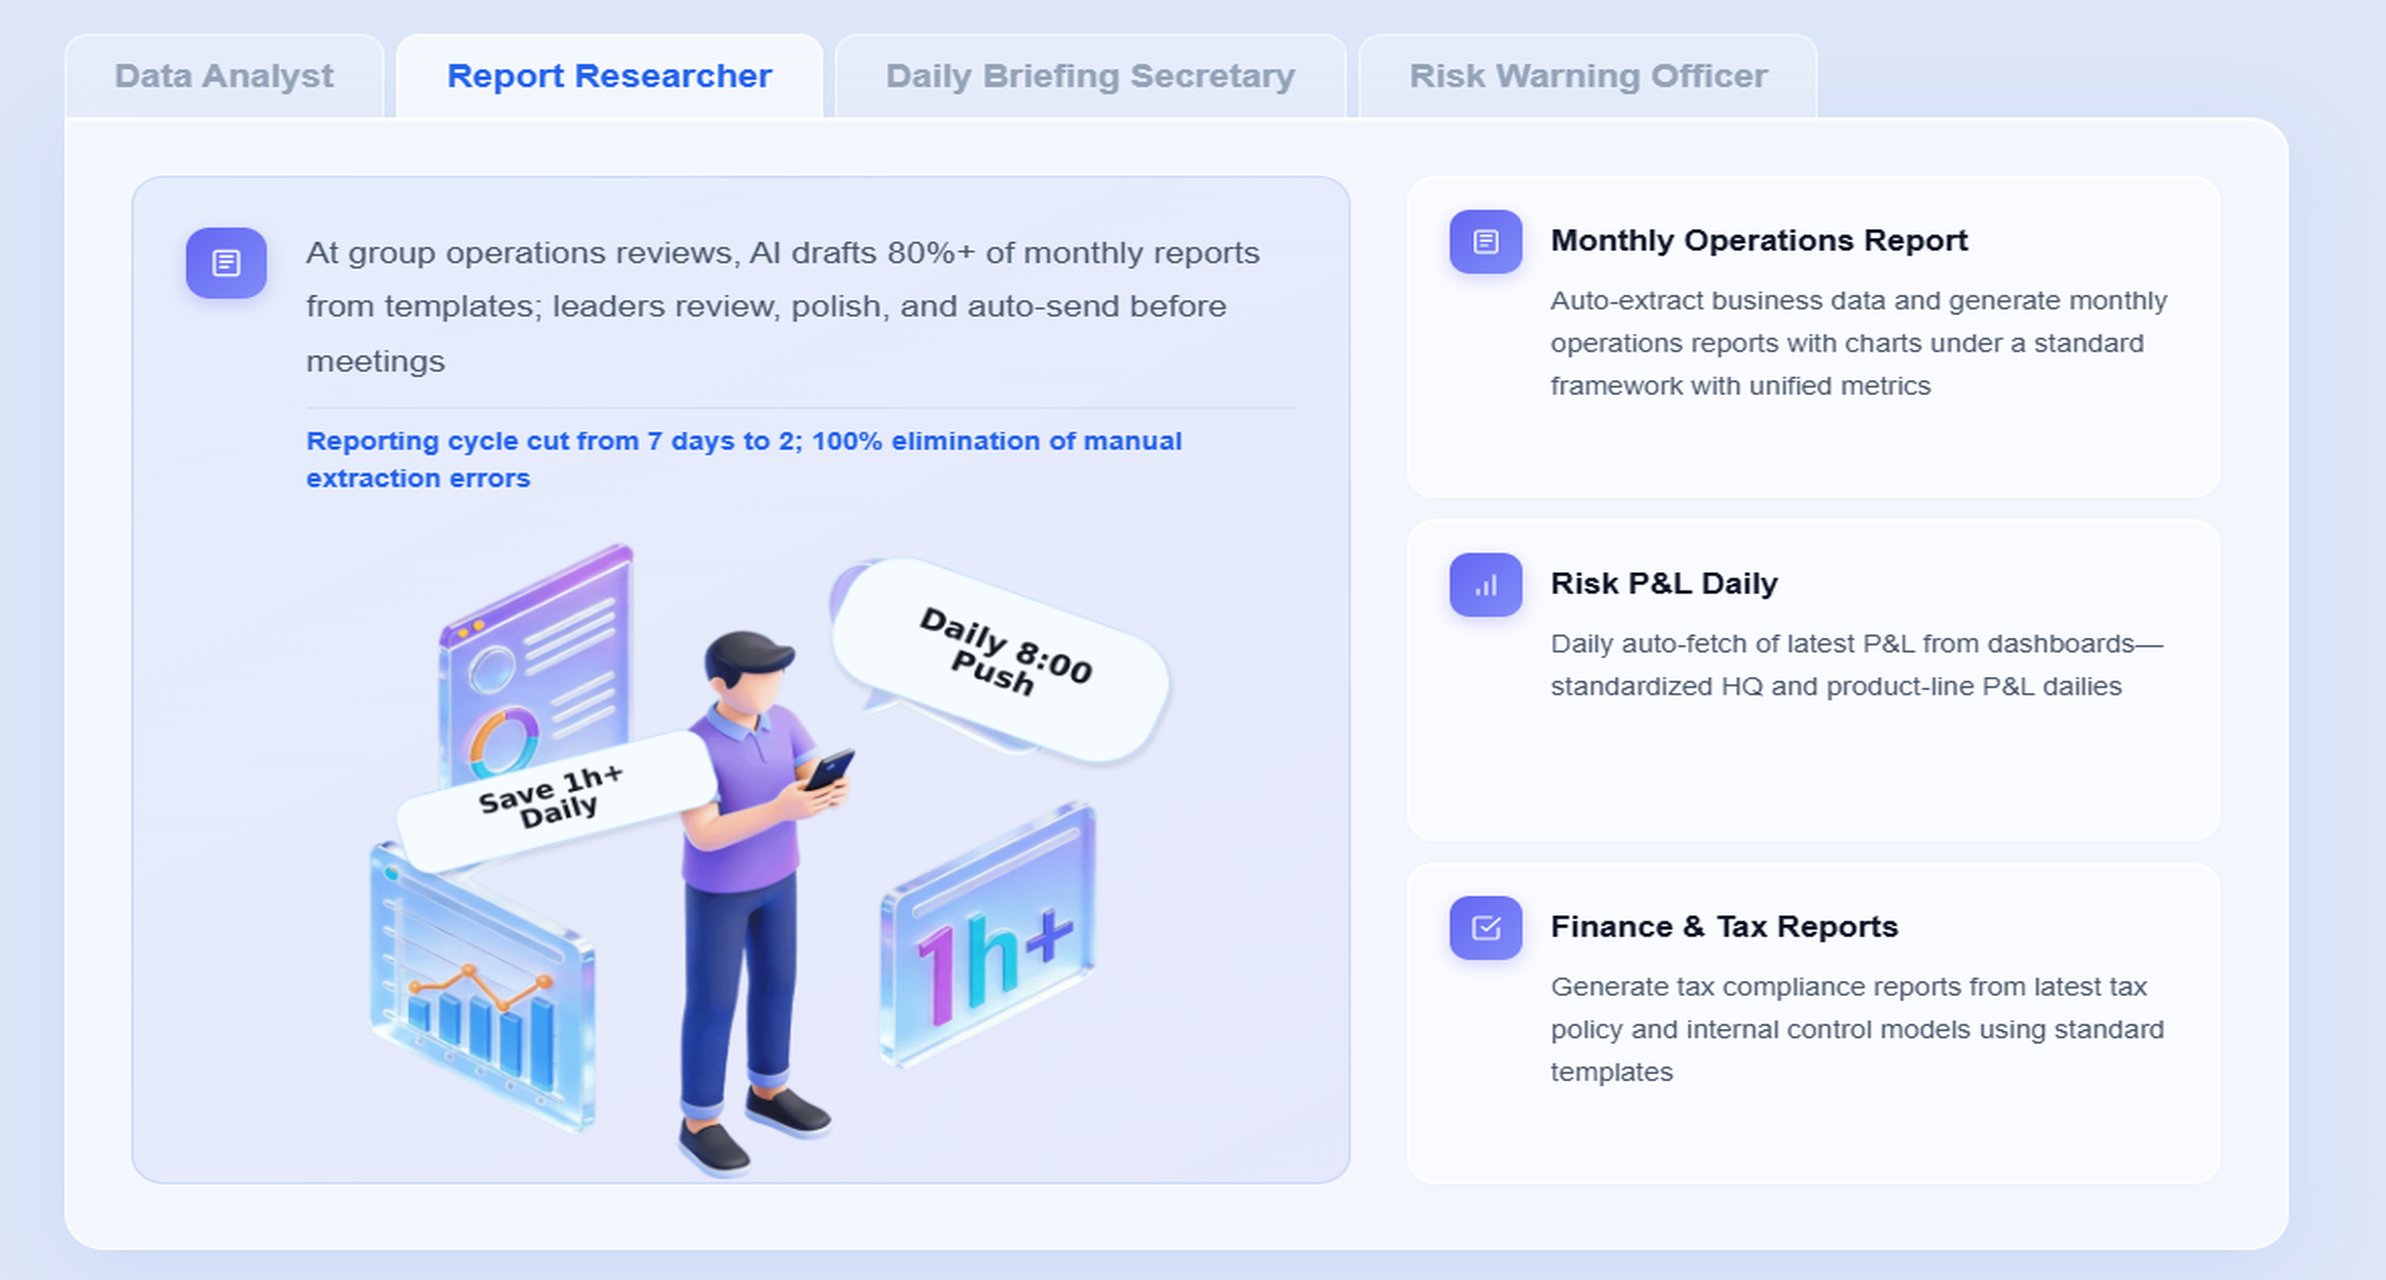
A strong asset performance management framework depends on trusted data, clear risk logic, and decision-ready reporting. Without those foundations, teams may collect large volumes of data without improving maintenance action.
Asset data and condition monitoring
APM starts with contextual asset data. That includes more than sensor readings.
Typical data sources include:
- equipment master data
- failure history
- downtime logs
- work orders
- preventive maintenance records
- operator inspections
- condition monitoring readings
- historian or IoT sensor data
- spare parts usage
- production context
Each of these supports a different part of the reliability picture.
-
Equipment history: Record of failures, repairs, replacements, and recurring issues.
Business value: Reveals chronic bad actors and repeat failure patterns.
AI use: Dora can summarize top recurring failure modes and generate a structured review narrative.
-
Sensor data: Continuous or periodic measurements such as vibration, temperature, pressure, or current.
Business value: Supports earlier detection of degrading conditions.
AI use: Dora can explain threshold breaches and include abnormal trend highlights in a briefing.
-
Inspections: Field observations, operator rounds, lubrication checks, and visual findings.
Business value: Adds context that pure sensor data may miss.
AI use: Dora can extract high-priority inspection exceptions from FineReport reports and push them to owners.
-
Work order feedback: Completion notes, cause codes, labor hours, and parts consumed.
Business value: Links maintenance execution to reliability outcomes.
AI use: Dora can summarize work order themes and identify unresolved follow-up items.
The reporting challenge is not just collecting this data. It is presenting it in a way that supports decisions by asset, line, plant, region, and time period. That is where a governed reporting foundation matters.
Criticality and risk prioritization
Not every asset needs the same level of monitoring or intervention. APM works best when teams rank assets based on their business impact.
Common criticality factors include:
-
production loss if the asset fails
-
safety consequence
-
environmental or compliance consequence
-
repair cost
-
redundancy availability
-
spare part lead time
-
failure frequency
-
maintenance complexity
-
Asset criticality score: A ranking that reflects business consequence if the asset underperforms or fails.
Business value: Helps focus resources on the assets that matter most.
AI use: Dora can prioritize reliability summaries around high-criticality assets instead of treating all equipment equally.
-
Failure consequence category: Classification of impact such as safety, quality, throughput, compliance, or cost.
Business value: Improves maintenance prioritization and escalation logic.
AI use: Dora can attach consequence context when summarizing exceptions or overdue actions.
-
Maintenance priority: Rules for assigning work urgency based on asset condition and operational risk.
Business value: Reduces backlog confusion and improves response discipline.
AI use: Dora can generate exception lists of critical work orders needing review.
A KPI-driven dashboard should not just show where failures occurred. It should show where future business impact is most likely if action is delayed.
Analytics, alerts, and decision support
Once data and criticality are organized, APM becomes actionable through trends, thresholds, and guided analysis.
Important decision-support elements include:
-
trend analysis by asset and KPI
-
threshold-based alerts
-
recurring failure detection
-
backlog and overdue tracking
-
maintenance effectiveness review
-
early anomaly identification
-
Trend reporting: Shows how KPIs move over time by asset group, plant, or production unit.
Business value: Helps leaders distinguish one-off events from systematic deterioration.
AI use: Dora can create chart explanations and summarize trend direction for different stakeholders.
-
Threshold alerts: Trigger attention when KPI limits or condition rules are exceeded.
Business value: Enables timely intervention before severe impact occurs.
AI use: Dora, acting as a Risk Alert Officer, can push exception notifications and suggest follow-up priorities.
-
Predictive insights: Use historical patterns and condition indicators to support early maintenance decisions.
Business value: Helps reduce emergency work and improve planning quality.
AI use: Dora can present structured summaries from governed report outputs instead of forcing users to interpret raw data manually.
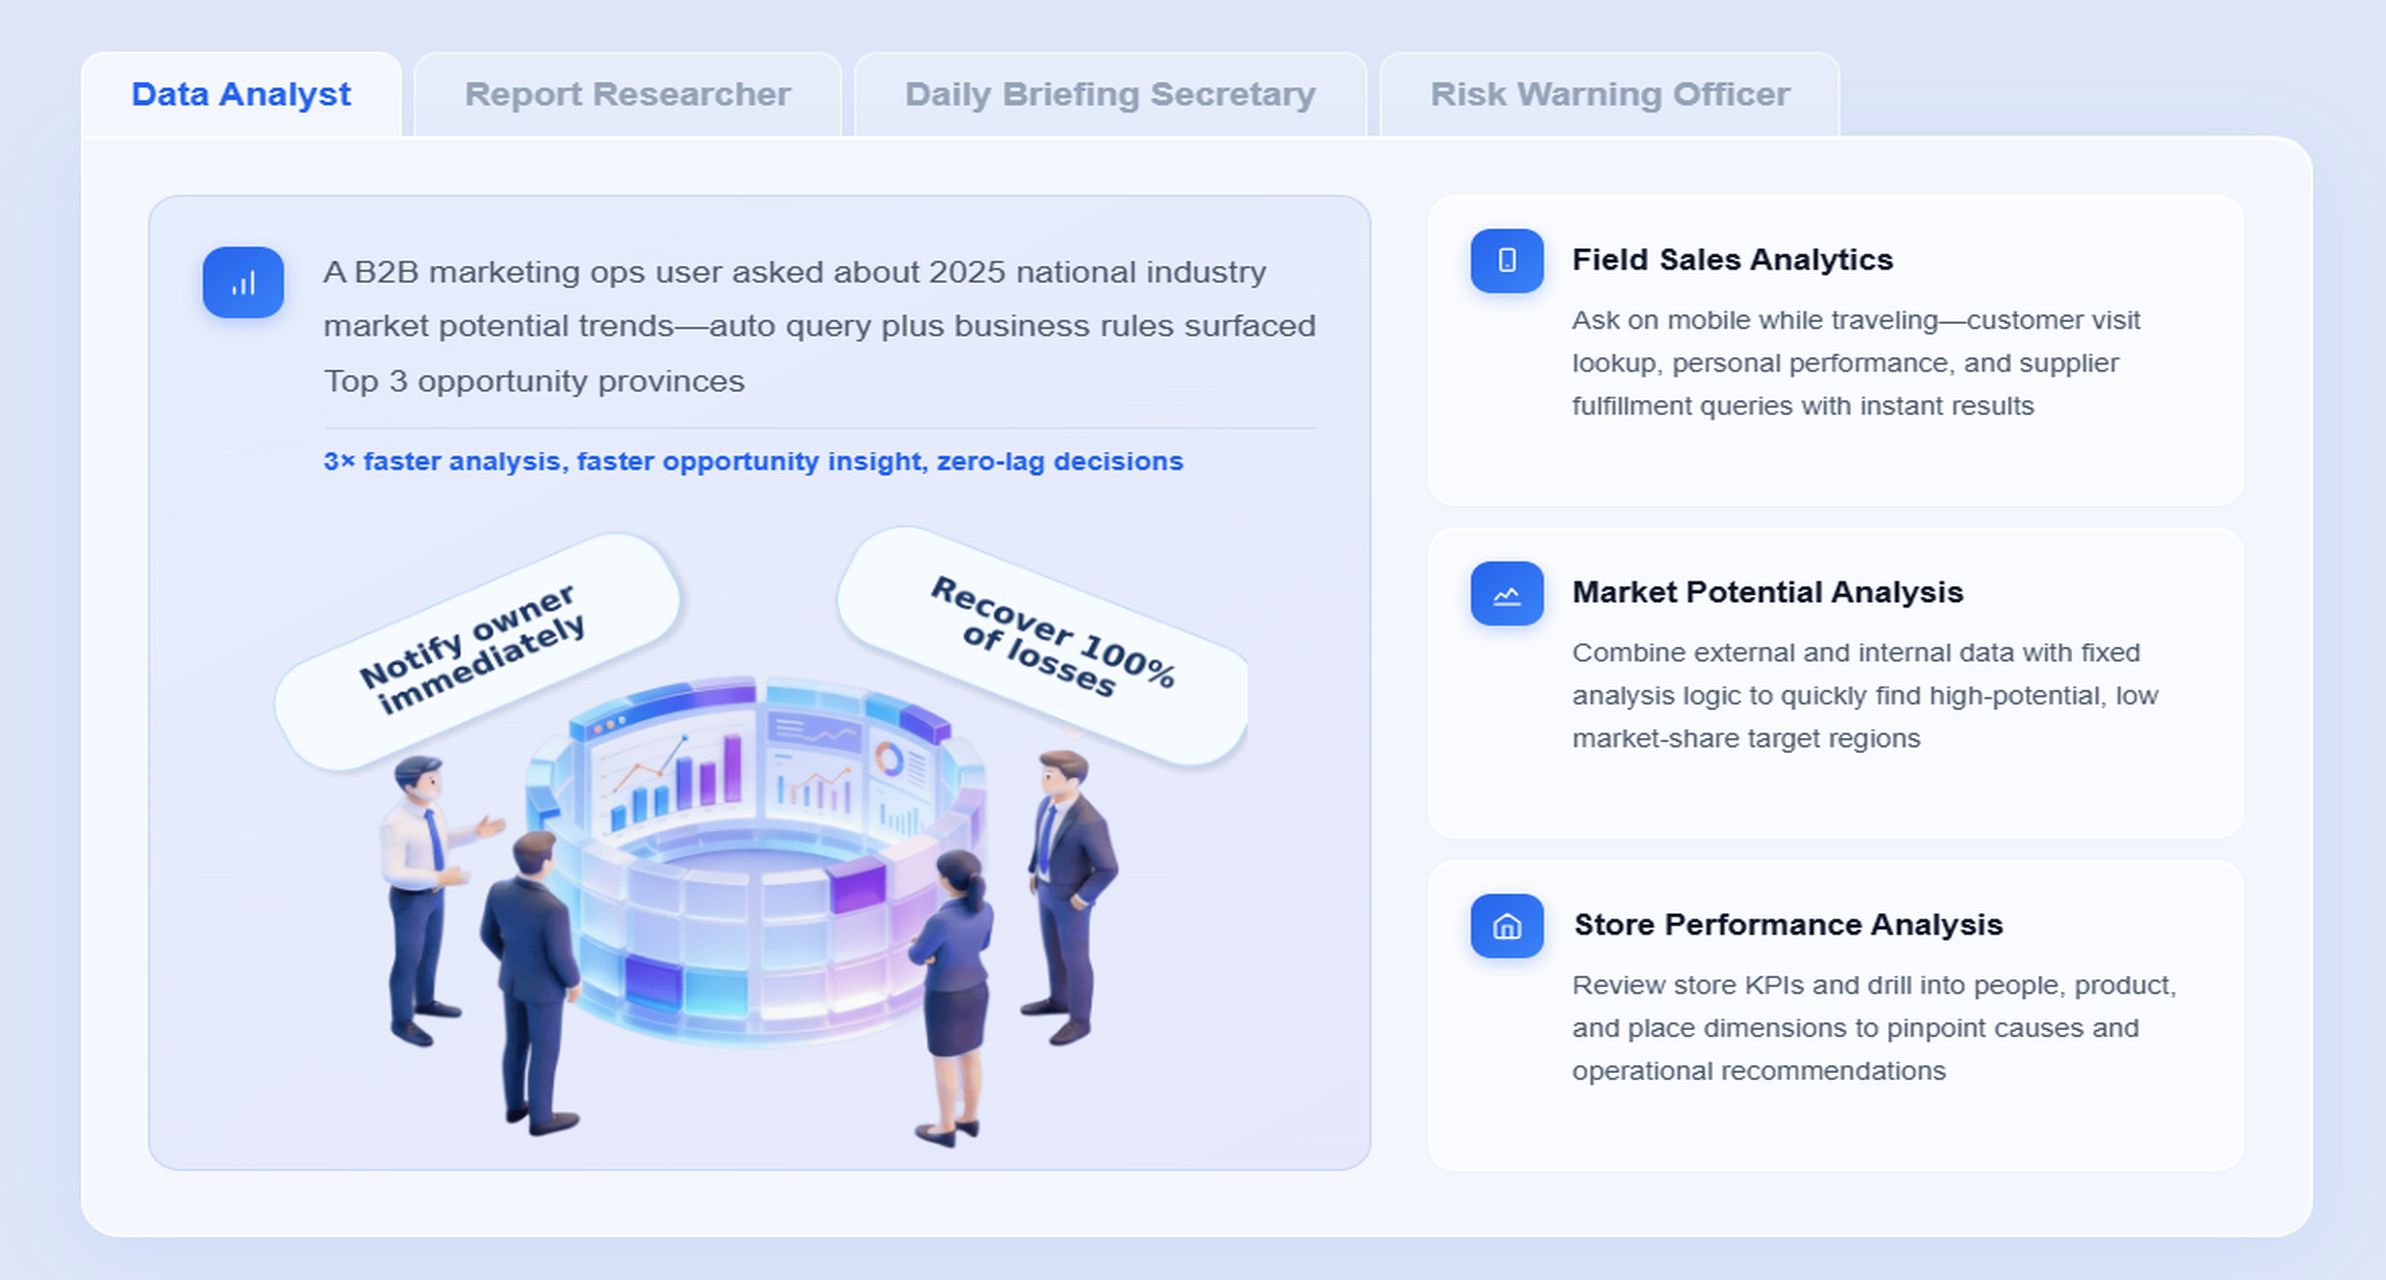
How to Build KPI-Driven Reliability Reporting
The goal of KPI-driven reliability reporting is not to create more dashboards. It is to help teams make faster, better maintenance and operational decisions with trusted, consistent information.
Choose the right KPIs for your operating context
The right KPI set depends on asset type, production model, and business risk. A utilities operator, discrete manufacturer, and process plant will not use the same emphasis.
A balanced KPI set usually covers four areas:
- reliability
- maintenance execution
- cost
- risk
Common examples:
- MTBF
- MTTR
- availability
- planned vs. unplanned maintenance ratio
- PM compliance
- emergency work percentage
- maintenance backlog
- repeat failure count
- maintenance cost per asset or line
- critical inspection overdue rate
The key is to avoid overloading managers with too many indicators.
-
Reliability KPI: Shows how consistently assets perform.
Business value: Supports uptime and throughput planning.
AI use: Dora can summarize reliability movement by critical asset class.
-
Maintenance KPI: Shows whether work is being planned and completed effectively.
Business value: Improves maintenance discipline and execution quality.
AI use: Dora can explain changes in overdue work, backlog, or emergency work mix.
-
Cost KPI: Shows the financial effect of maintenance strategy.
Business value: Helps balance spending against reliability outcomes.
AI use: Dora can generate a management-ready summary linking cost shifts to asset performance.
-
Risk KPI: Highlights high-consequence assets and unresolved exceptions.
Business value: Supports safer and more targeted escalation.
AI use: Dora can push high-risk exception alerts to responsible owners.
Standardize data sources and reporting definitions
KPI trust breaks down quickly when different teams use different naming, formulas, or time windows.
Standardization should cover:
- asset hierarchy and naming
- KPI formulas
- downtime definitions
- planned vs. unplanned maintenance rules
- time period alignment
- ownership by function
- threshold logic
- cause and failure code structures
FineReport is especially useful here because it provides a consistent reporting foundation for formatted reports, management reports, and operational cockpits. Instead of every department maintaining its own spreadsheet logic, teams can align around governed templates and definitions.
-
KPI definition standard: Shared formula and business meaning for each metric.
Business value: Reduces reporting disputes and improves comparability.
AI use: Dora can answer questions using the governed semantic meaning of the KPI rather than guessing from raw labels.
-
Time period standard: Shared rules for daily, weekly, monthly, and rolling-period reporting.
Business value: Prevents misleading comparisons.
AI use: Dora can produce consistent summaries based on approved reporting periods.
-
Ownership model: Clear accountability for each KPI and exception workflow.
Business value: Turns reporting into action rather than passive viewing.
AI use: Dora can route summaries and alerts to the right owner.
Turn reports into decisions
A reliability dashboard has limited value if nobody acts on it. Good reporting design connects data visibility to operating rhythm.
That usually means:
- daily exception review for critical assets
- weekly reliability review meetings
- monthly management summaries
- escalation rules for threshold breaches
- owner tracking for overdue actions
FineReport can support this through role-based operational cockpits, management reports, and workflow-oriented reporting outputs. Dora then upgrades report consumption and follow-up.
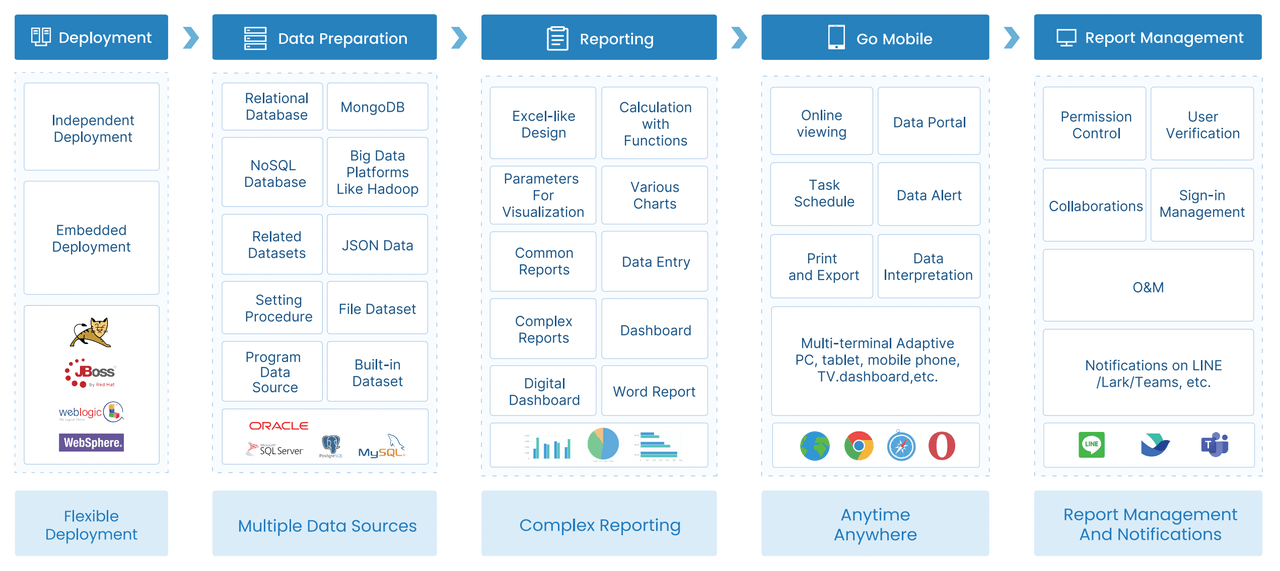
How an AI Data Agent Automates Report Consumption
In many plants, the bottleneck is not report production alone. It is report consumption. Managers receive dashboards, reliability engineers review trend pages, planners inspect overdue work lists, and executives ask for a concise summary before meetings. That work is repetitive and often manual.
This is where Dora acts as an enterprise Data Agent. In an APM scenario, the most relevant digital employee is usually the Daily Briefing Secretary combined with the Risk Alert Officer.
Dora does not replace FineReport. FineReport provides the trusted reporting and semantic foundation. Dora sits on top of those governed report assets to help users ask questions in natural language, retrieve the right report sections, summarize trends, highlight exceptions, push alerts, and support follow-up.
A concrete chat example
A plant operations director could ask:
“Summarize this week’s asset performance management report for the packaging line, highlight any decline in availability, list critical assets with overdue maintenance, and tell me which owners need follow-up.”
That request is practical because the data already exists in trusted FineReport reports and operational cockpits. Dora uses that foundation to return a structured, chart-based answer rather than a generic response.
A practical Dora workflow for reliability reporting
-
Retrieve trusted FineReport report or operational cockpit data.
Dora accesses the approved asset performance management report, asset exception list, and KPI dashboards already built in FineReport.
-
Understand KPI definitions, report templates, filters, business terms, and semantic rules.
Dora uses the governed reporting layer to interpret availability, MTBF, backlog, overdue PM, and criticality correctly.
-
Generate a structured report summary through chat.
Dora creates a concise narrative such as availability trend, top reliability risks, overdue work on critical assets, and maintenance cost notes.
-
Detect exceptions and abnormal changes.
Dora identifies KPI threshold breaches, repeated failures, overdue inspections, or sudden drops in asset performance.
-
Push report summaries or alerts to responsible users.
As a Daily Briefing Secretary or Risk Alert Officer, Dora can send scheduled summaries to managers and route exceptions to the right maintenance or operations owner.
-
Produce follow-up records and periodic review summaries.
Dora helps support recurring daily or weekly review cycles by consolidating what changed, what was escalated, and what remains unresolved.
Why this works better in enterprise reporting scenarios
Raw prompt-based AI often struggles in industrial reporting because the challenge is not language generation alone. It is governance.
Dora is designed for enterprise fit because it works with:
- trusted FineReport report assets
- KPI governance
- semantic rules
- report templates
- permission boundaries
- controllable Skills-based workflows
That makes the AI assistant more practical for recurring reporting work. Users can get structured report summaries, chart explanations, scheduled briefings, exception pushes, and follow-up support without abandoning enterprise controls.
For executives, this means Dora is not an AI experiment. It is a landed digital employee for recurring reporting work such as weekly reliability summaries, maintenance risk reports, critical asset exception reviews, and owner follow-up.
For IT teams, it changes the role from manually serving every reporting request to improving data connections, semantic setup, permissions, quality rules, and reusable agent Skills.
For business users, it reduces the friction of finding the right report, interpreting trends, and chasing exceptions manually.
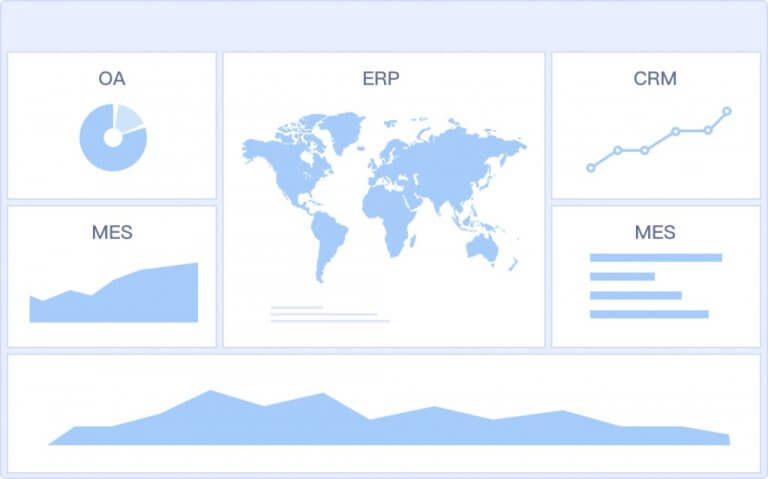
Asset performance management software helps teams connect data, monitor asset health, prioritize risk, and support better maintenance decisions. But the real enterprise value often depends on how well the software fits into reporting, workflow, and management review processes.
What to look for in APM software
When evaluating APM software, teams should look beyond analytics features alone.
Key evaluation areas include:
-
integration with CMMS, ERP, historians, SCADA, and IoT systems
-
ability to contextualize asset data by hierarchy and criticality
-
support for KPI reporting and visualization
-
alerting and workflow support
-
usability for operations, maintenance, engineering, and leadership
-
scalability across plants or asset classes
-
Integration capability: Connects maintenance, operations, and condition data from enterprise systems.
Business value: Prevents reporting silos and fragmented decision-making.
AI use: Dora can only provide strong answers when FineReport has access to trusted integrated report assets.
-
Visualization and reporting: Supports dashboards, formatted reports, and management summaries.
Business value: Ensures different stakeholders get the right level of detail.
AI use: Dora can retrieve reports, explain charts, and summarize KPI movement for each audience.
-
Workflow and alerting: Routes issues to owners and supports action tracking.
Business value: Turns insight into execution.
AI use: Dora can push timely alerts and follow-up reminders based on governed rules.
-
Scalability: Supports rollout across asset classes, business units, and plants.
Business value: Makes APM sustainable beyond pilot projects.
AI use: Dora can reuse digital employee workflows across recurring reporting scenarios.
In enterprise environments already using SAP for maintenance, finance, and supply chain processes, teams may consider SAP Asset Performance Management as part of a broader reliability landscape.
This may fit when organizations want stronger alignment between asset strategies, enterprise maintenance processes, and SAP-centric master data or workflows. However, even in SAP-based environments, reporting and adoption still depend on how well KPI definitions, management dashboards, and user-facing analysis are delivered.
That is where FineReport + Dora can still be highly relevant. FineReport can unify and present trusted reporting outputs across systems, while Dora adds the AI assistant layer for chat-based report consumption, scheduled briefings, and exception follow-up.
Common Challenges and Practical Next Steps
Most APM reporting programs do not fail because leaders lack interest in reliability. They fail because the reporting foundation is inconsistent or too hard for teams to use consistently.
Common barriers include:
- poor data quality
- inconsistent asset naming
- unclear KPI ownership
- disconnected maintenance and operations data
- too many metrics with too little action
- low user adoption
- reports that are descriptive but not actionable
A practical rollout usually works better than a massive transformation plan.
Start with:
- a defined set of critical assets
- a small KPI set
- a standard dashboard and management report
- clear thresholds and exception rules
- a repeatable review cadence
Actionable best practices
1. Start with high-value recurring reports
Do not try to automate every report first. Start with weekly reliability reviews, critical asset exception reports, or monthly management summaries.
This creates faster business value and gives teams a clear scenario for FineReport + Dora adoption.
2. Standardize KPI definitions, templates, and business terms
AI-assisted reporting only works well when the reporting logic is governed. Standardize formulas, naming, thresholds, ownership, and reporting layouts before scaling.
This improves both human trust and Dora’s ability to generate accurate structured report summaries.
3. Build the semantic layer inside the reporting workflow
Do not leave KPI meaning implicit. Define what availability, repeat failure, critical backlog, or overdue maintenance means in the enterprise reporting model.
FineReport provides the governed reporting structure. Dora relies on that trusted semantic foundation to answer naturally in chat and execute reliable Skills-based workflows.
4. Treat data quality as part of the AI implementation
If work order closure notes are incomplete, failure codes are inconsistent, or asset hierarchies are broken, both dashboards and AI outputs will suffer.
AI readiness in reliability reporting starts with data quality, not just a model interface.
5. Preserve permissions, alert rules, and human review
AI-generated summaries should respect FineReport access boundaries. High-impact reliability narratives and exception escalations should also include human review, especially early in rollout.
That is the practical path to controlled adoption rather than uncontrolled automation.
Use this checklist to assess your current state:
- Do we have a clear list of critical assets?
- Are MTBF, MTTR, availability, backlog, and maintenance cost defined consistently?
- Can we combine maintenance, condition, and production context in one report?
- Do our dashboards show both lagging and leading indicators?
- Are threshold breaches tied to named owners and escalation rules?
- Do managers receive scheduled summaries, not just raw dashboards?
- Can users ask natural-language questions over trusted reporting assets?
- Are permissions and KPI semantics governed centrally?
- Do we review and refine the reporting workflow regularly?
If several answers are no, the next step is not more spreadsheets. It is a stronger reporting foundation plus an AI assistant layer that helps teams consume and act on reports faster.
FineReport + Dora Solution Pitch
Building this manually is complex. FineReport helps teams standardize trusted reports, operational cockpits, templates, and reporting workflows. Dora turns those assets into an AI assistant that can answer report questions in chat, generate structured summaries, push scheduled briefings, monitor exceptions, and follow up with responsible owners.
For asset performance management, that means enterprises can move from manual reliability reporting to a more scalable operating model:
- FineReport builds the trusted APM dashboards, formatted management reports, maintenance exception lists, and operational cockpits.
- Dora acts as the enterprise Data Agent layer on top of those assets.
- Users can ask natural-language questions over trusted reporting assets.
- Managers can receive structured report summaries instead of reading every chart manually.
- Exception alerts and follow-up pushes can be routed to the right people based on governed rules.
FineReport + Dora is not only a reporting upgrade; it is a practical fourth-generation Agentic BI path. FineReport provides governed reports and operational cockpits. Dora provides the AI assistant layer for scenario execution, with more controlled Skills, lower token waste, faster execution paths, and more stable workflows than prompt-only agents.

Get Ready-to-Use Dashboard Templates in Fine Gallery
The strongest Dora pitch is scenario + product + service: FineReport provides the trusted reporting foundation, Dora provides the AI digital employee, and implementation service connects data, governance, semantic setup, Skills, report templates, permissions, and rollout.









