Sales reporting is the process of turning day-to-day selling activity into structured insights leaders can use to improve pipeline quality, revenue predictability, and team performance. If you are a sales manager, RevOps lead, founder, or operations director, the challenge is rarely a lack of data. It is the opposite: too many CRM fields, too many spreadsheets, inconsistent definitions, and not enough clarity on what needs action now. Good sales reporting solves that by showing what is happening, why it matters, and where to intervene before deals stall or targets slip.
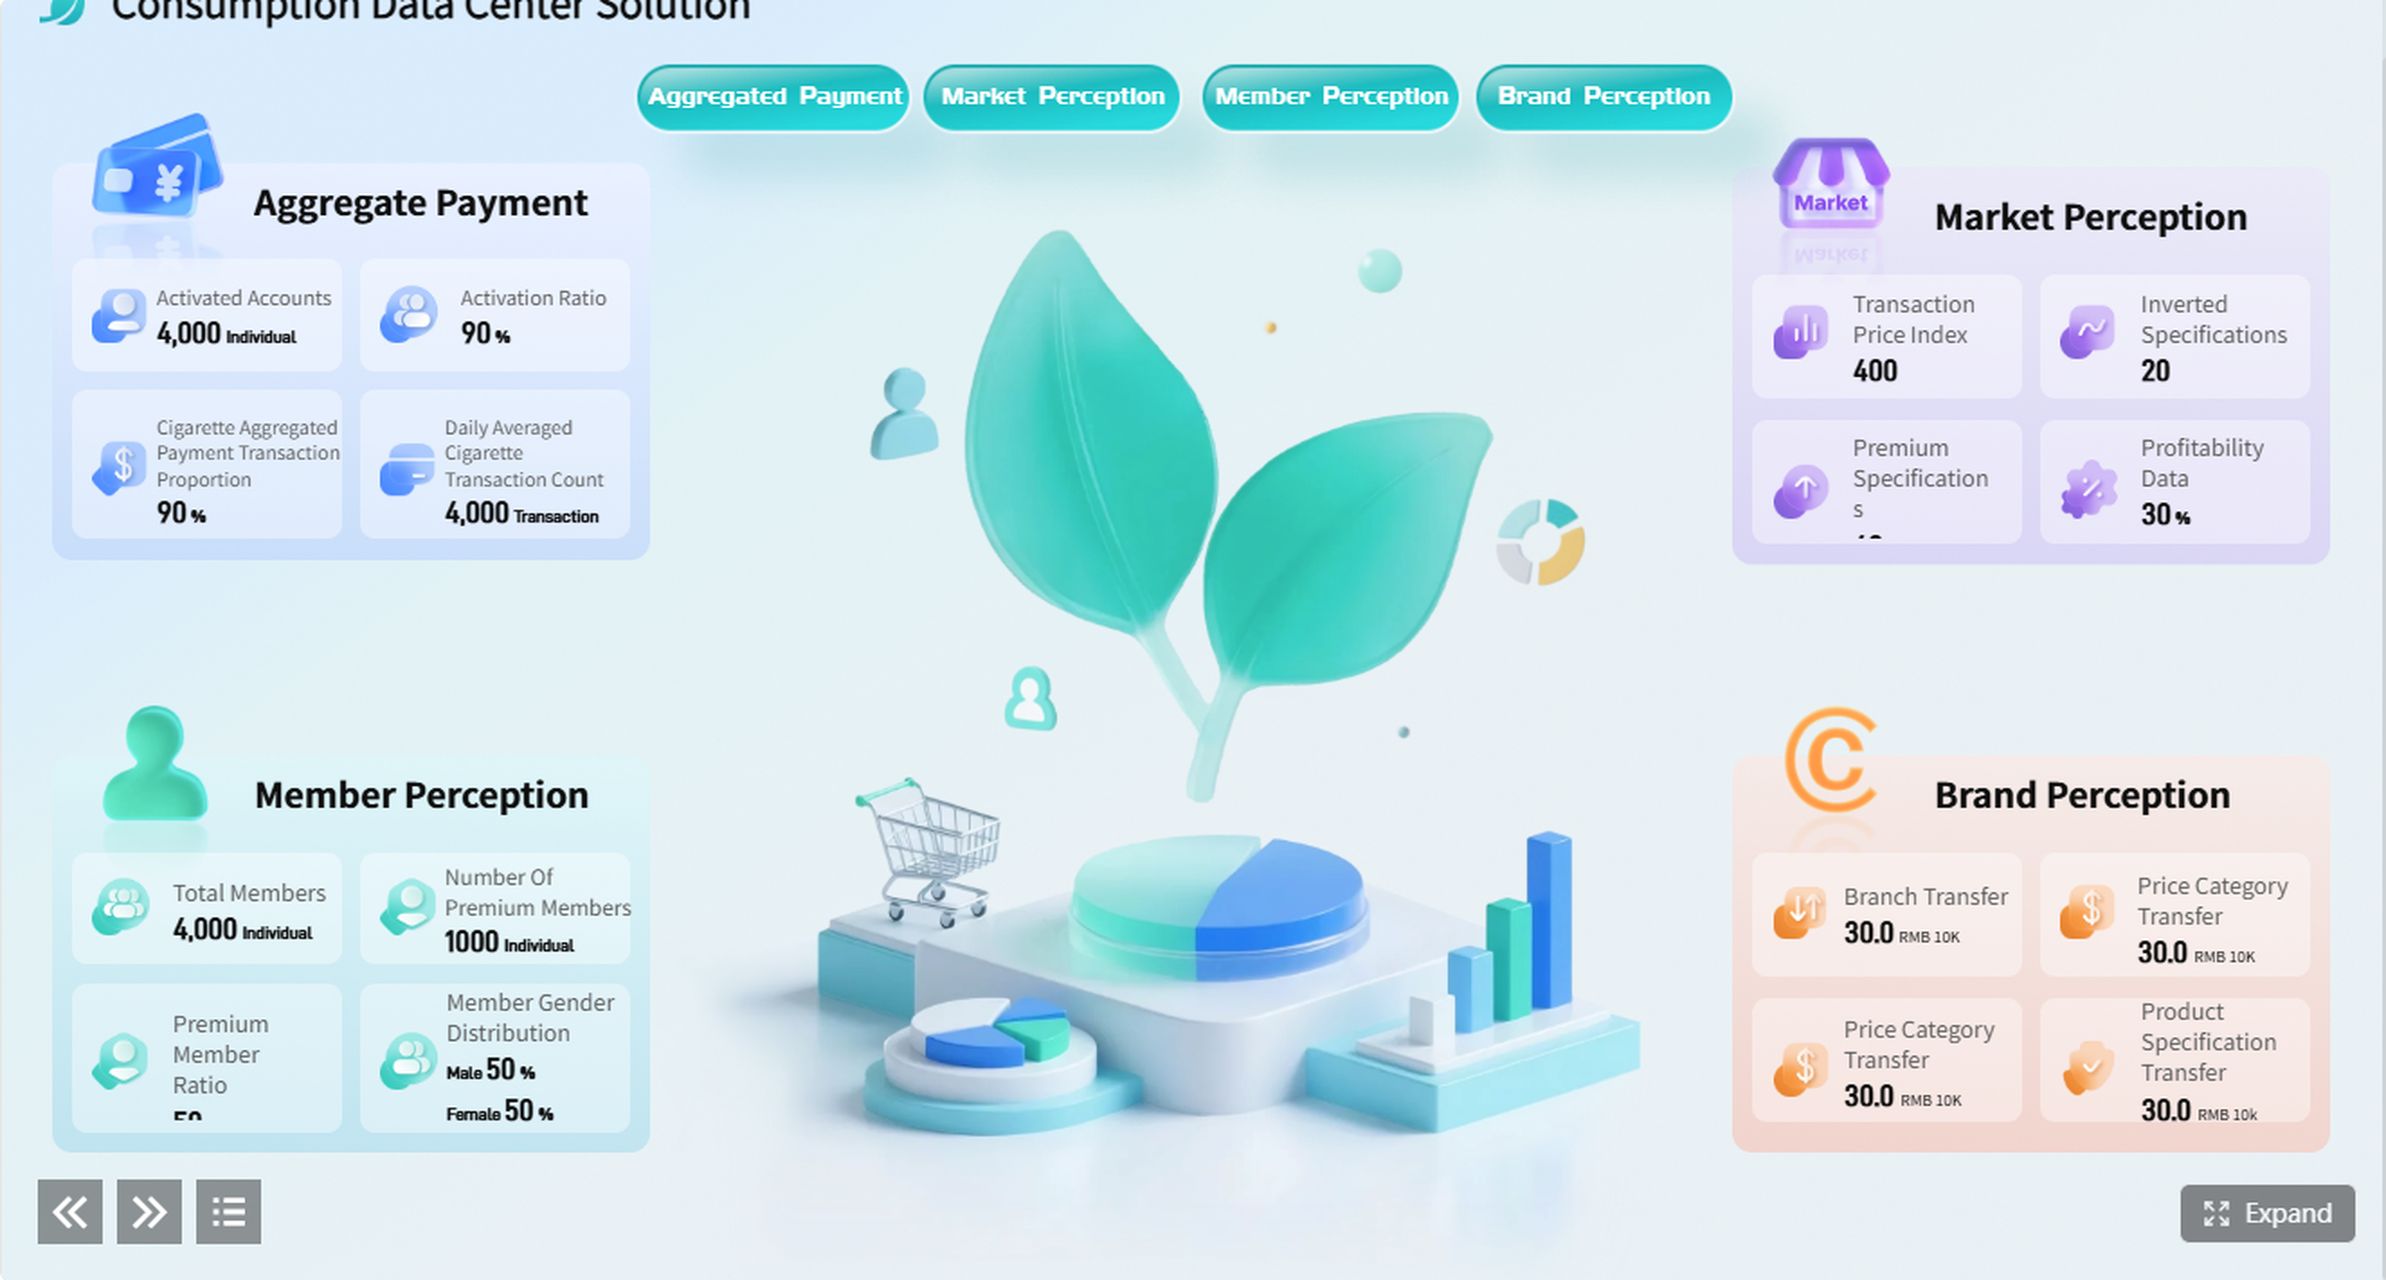
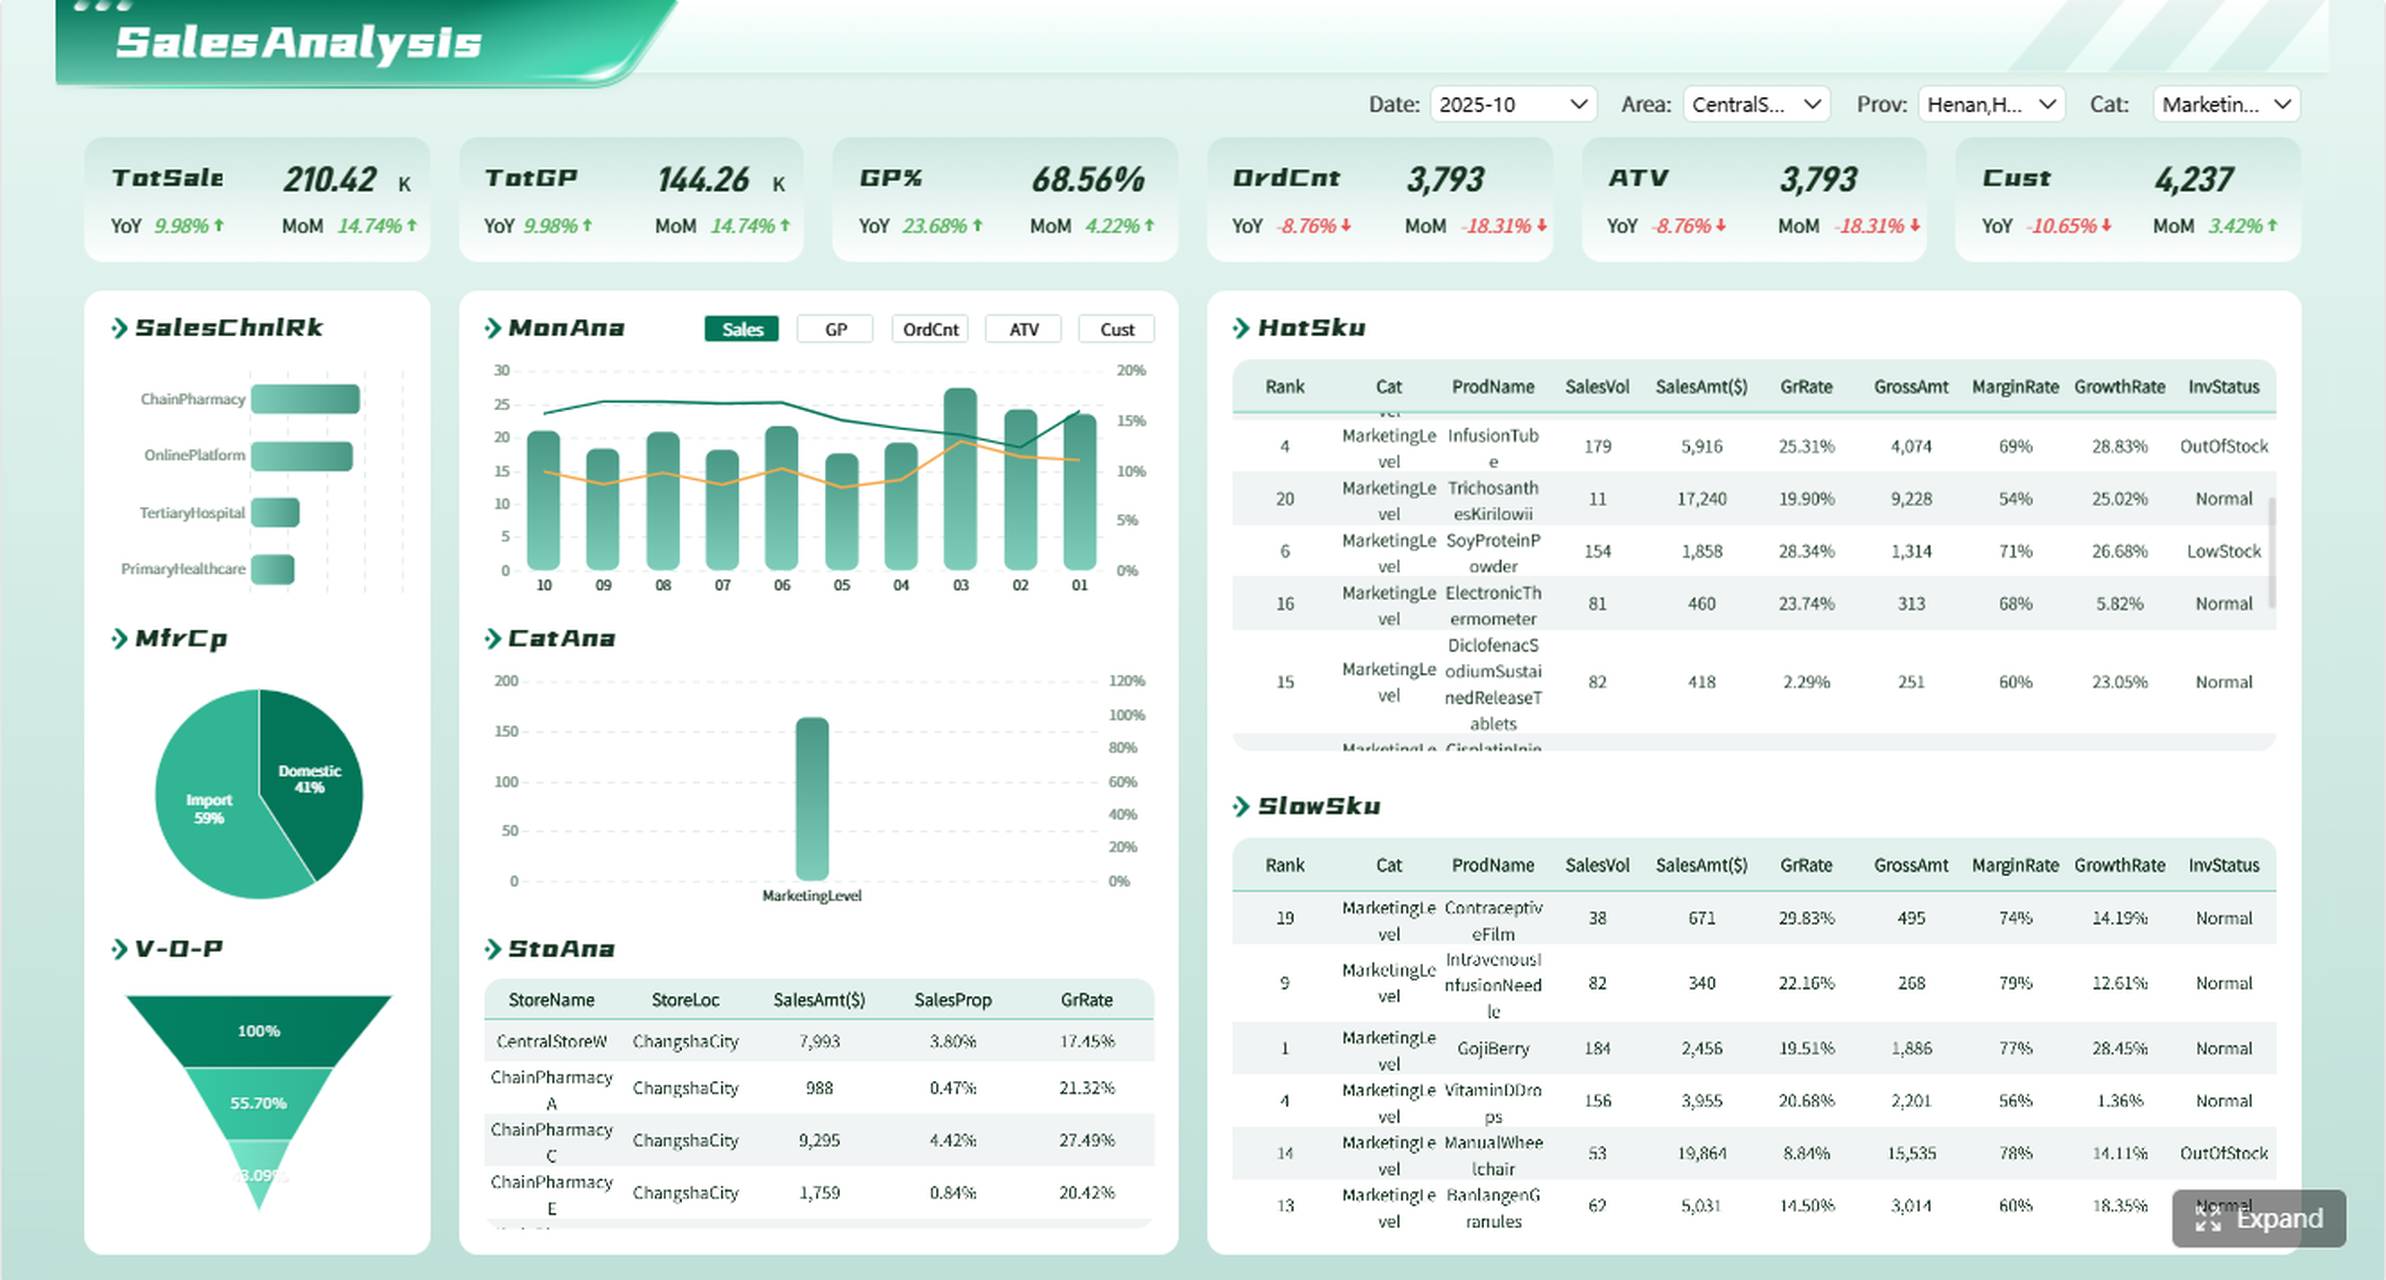
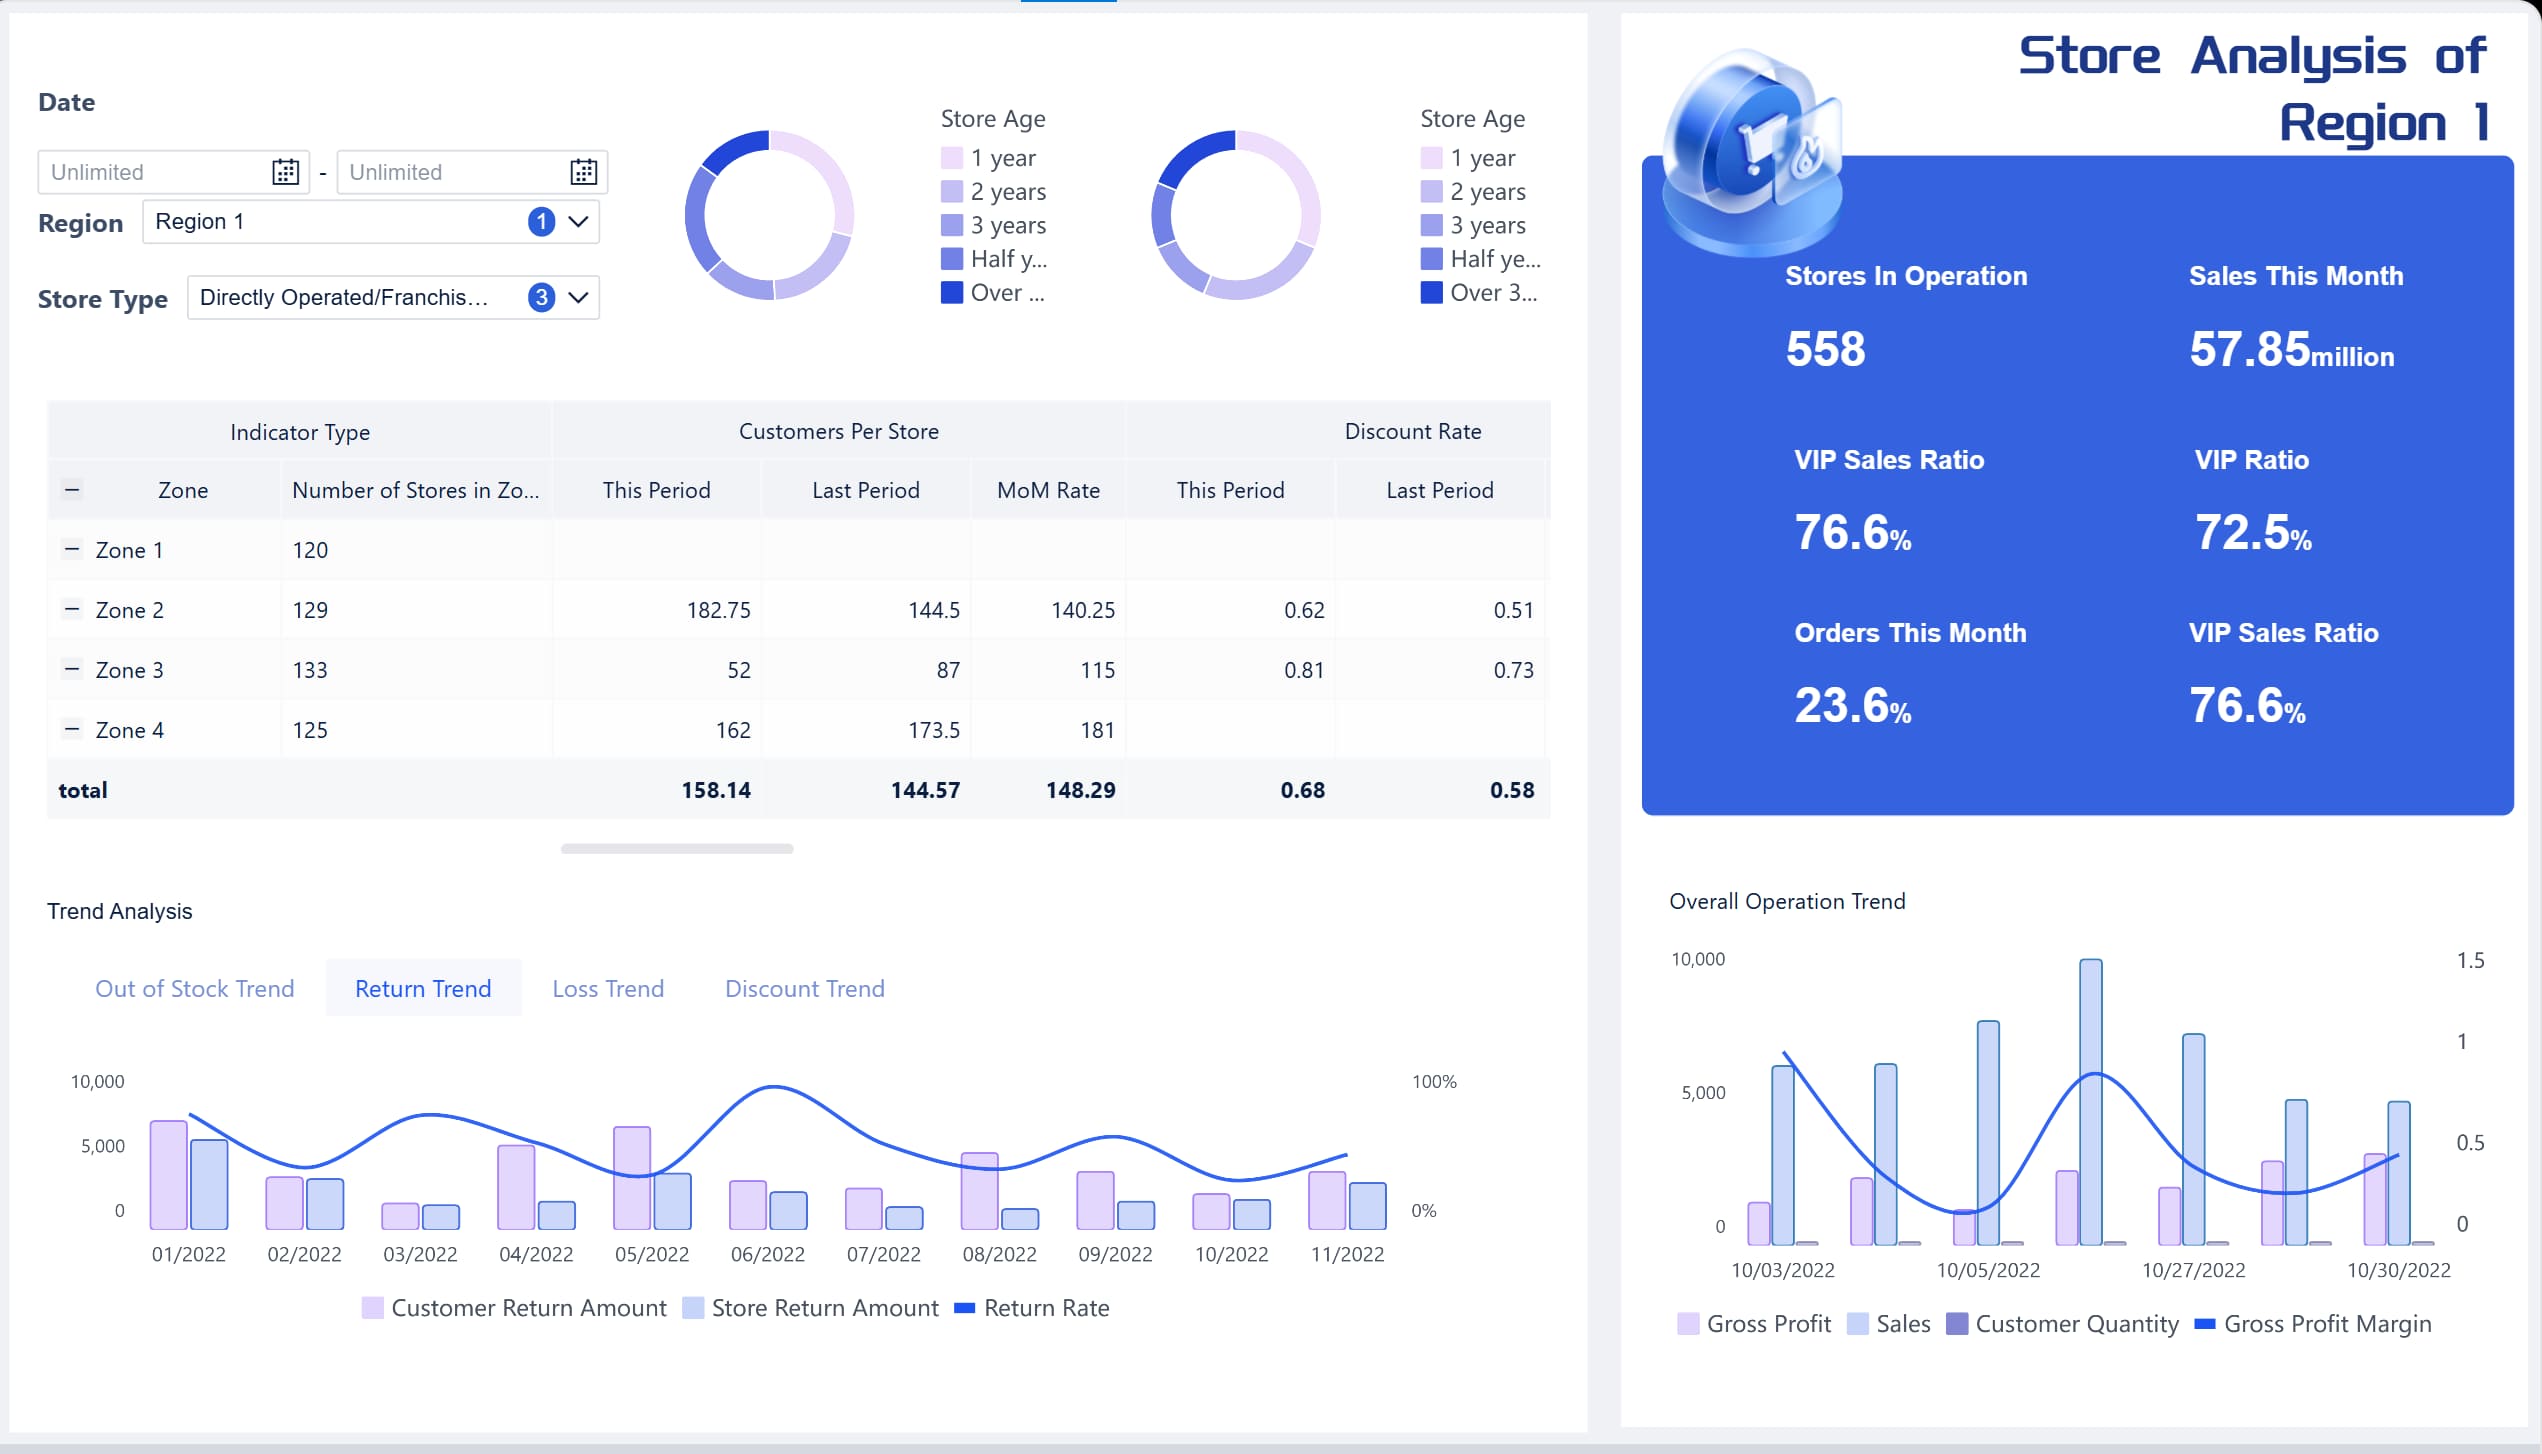
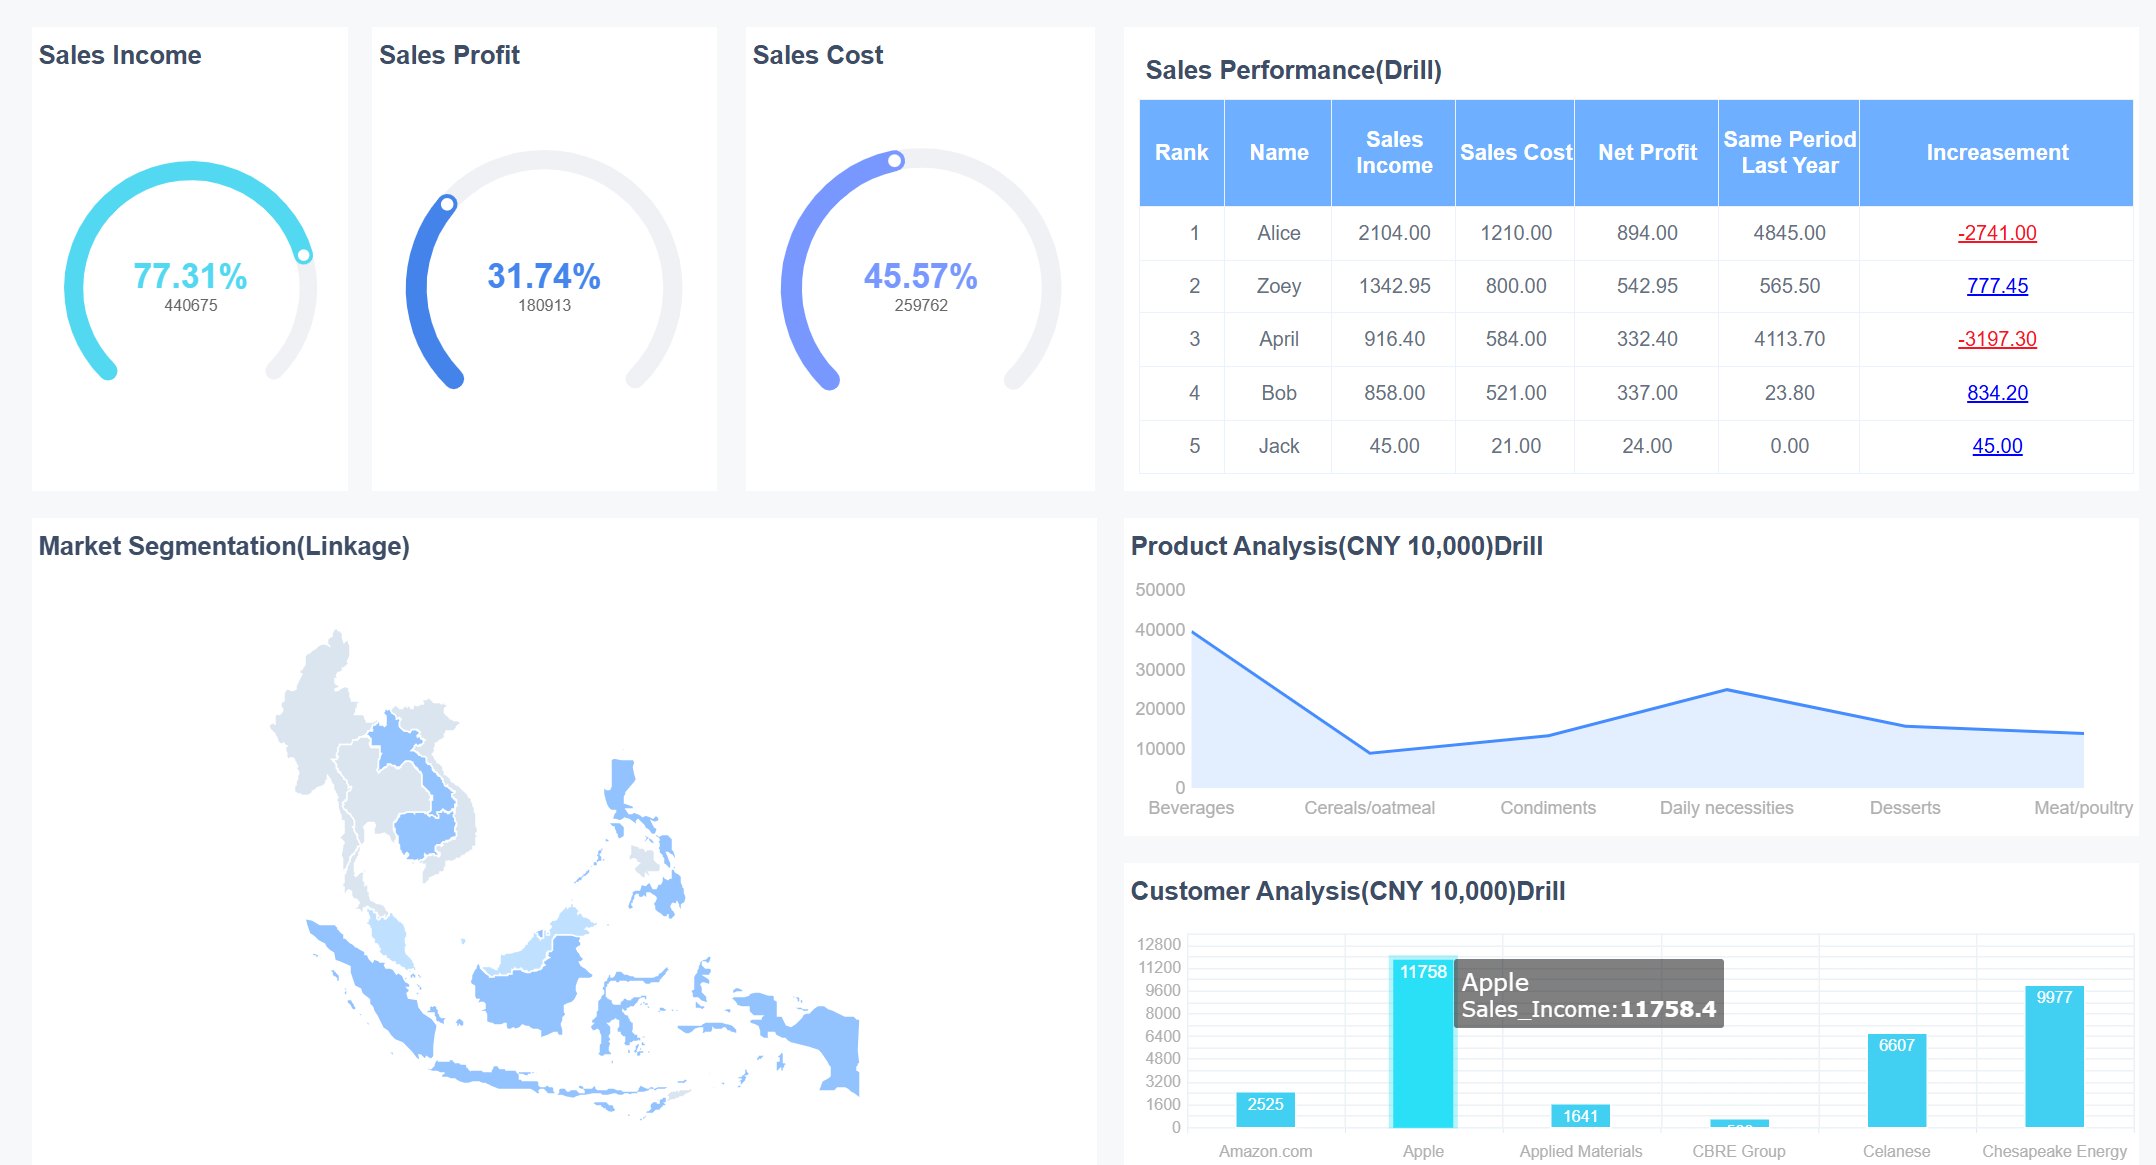
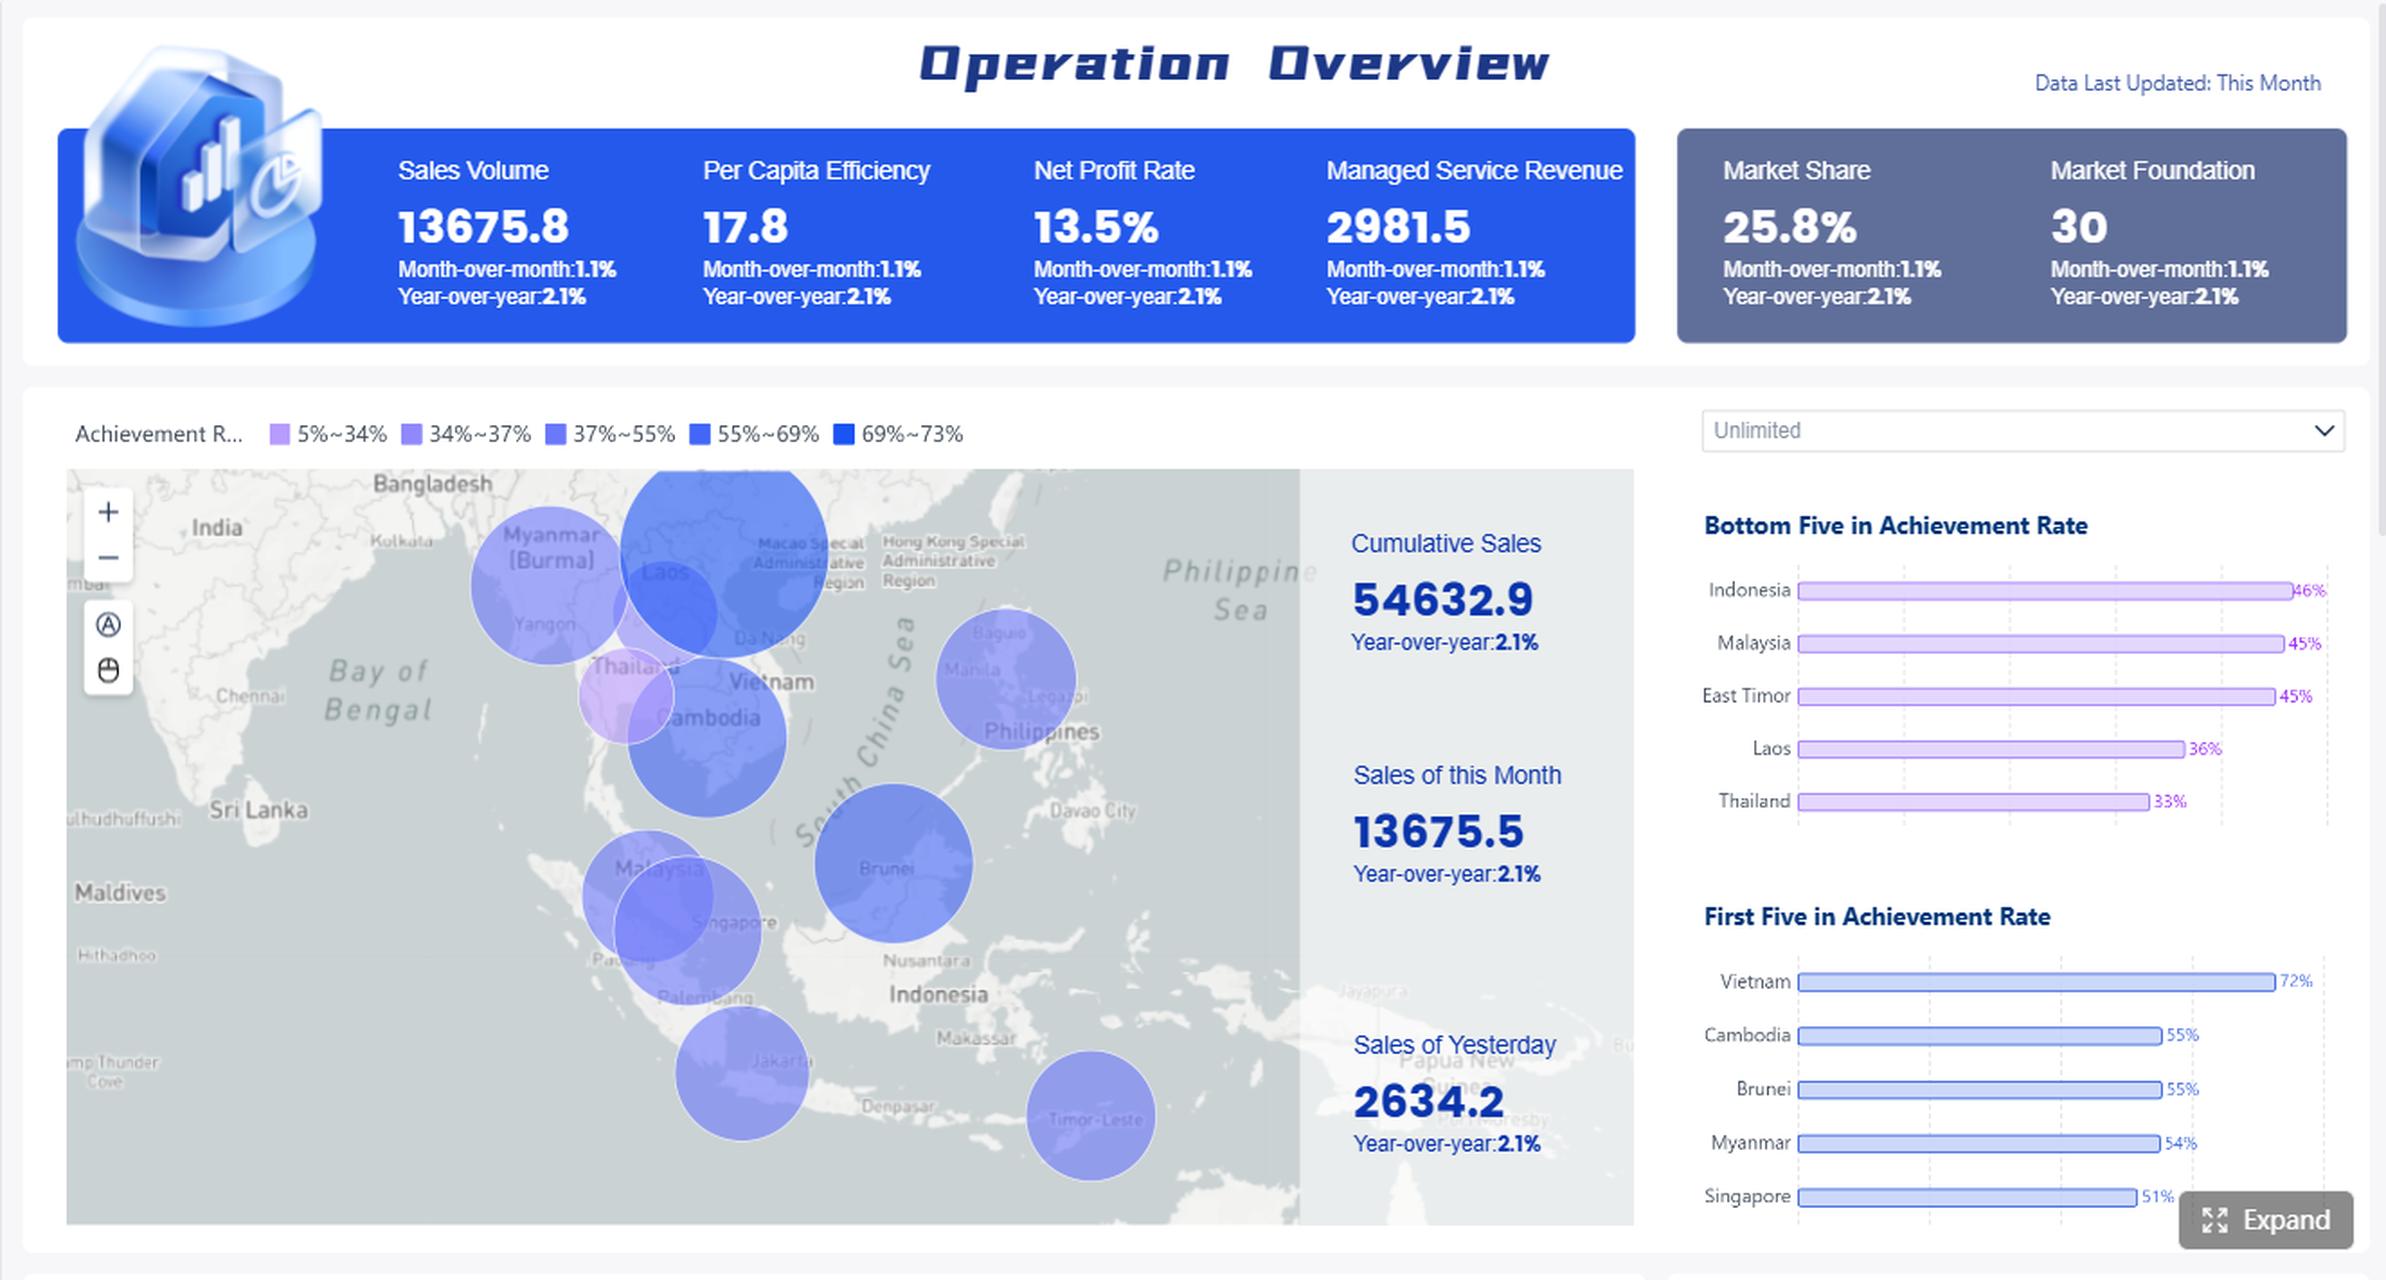
All reports in this article are built with FineReport.
What Is Sales Reporting and Why It Matters
At its simplest, sales reporting is the routine process of collecting, organizing, and presenting sales data over a specific period. That might be weekly activity, monthly bookings, quarterly forecast changes, or account health across a customer base. The goal is not just recordkeeping. The goal is better decisions.
For most organizations, sales reporting answers practical questions such as:
- Are we on track to hit target?
- Which deals are moving and which are stuck?
- Which reps or territories need support?
- How accurate is our forecast?
- Are retention and expansion trends improving or weakening?
Sales data vs dashboards vs structured reports
These terms are often used interchangeably, but they are not the same.
- Raw sales data: Individual CRM records, emails sent, calls made, meeting counts, opportunity values, stage changes, close dates, and account notes.
- Dashboards: Live visual views of metrics, often used for monitoring in real time.
- Structured reports: Formal, repeatable summaries built around a business question, a time period, and a decision-making audience.
A dashboard helps you watch performance. A report helps you review performance, explain performance, and act on performance.
Why consistent reporting matters for SaaS, B2B services, and small teams
Different sales models require different reporting depth, but consistency matters across all of them.
For SaaS companies, sales reporting supports pipeline analysis, recurring revenue visibility, forecast discipline, and customer expansion tracking.
For B2B service firms, it helps teams understand proposal conversion, project-based bookings, account profitability signals, and renewal opportunities.
For small teams, consistent reporting prevents leaders from managing by instinct alone. When headcount is lean, every rep, every deal, and every week matters more. A lightweight but reliable reporting rhythm creates focus without adding unnecessary admin work.
Core Benefits of Sales Reporting
Strong sales reporting does more than summarize numbers. It improves operating discipline across the revenue team.
Better visibility into pipeline and revenue health
Sales leaders need a fast read on whether opportunity volume, stage distribution, and deal quality are healthy enough to support revenue targets. Reporting makes hidden pipeline issues visible before they become quarter-end surprises.
Faster, more confident decisions
Weekly and monthly reports reduce debate over what is happening. Instead of reacting to anecdotes, managers can prioritize based on evidence: stalled enterprise deals, weak conversion in one stage, or a drop in meetings that will affect next month’s pipeline creation.
More accurate forecasting
Forecast quality improves when reporting connects expected close dates, historical conversion patterns, confidence levels, and deal movement. Leaders can distinguish between optimistic pipeline and probable revenue.
Stronger accountability without micromanagement
Good reports create transparency. Reps know what is being measured, managers can coach based on facts, and executives get a clear view without interrupting the team for ad hoc updates.
Better alignment with business goals
Sales reporting connects frontline activity to larger outcomes such as bookings, retention, expansion, and margin. That alignment matters especially when finance, operations, and commercial leadership need one version of the truth.
The Core Framework: Key Metrics Every Sales Reporting Setup Should Track
The exact report design will vary by company, but most teams should anchor sales reporting around a small set of operational KPIs.
Key Metrics (KPIs)
- Pipeline Value: Total value of open opportunities in the sales funnel.
- Pipeline Coverage: Ratio of open pipeline to target revenue for a given period.
- Stage Conversion Rate: Percentage of deals that move from one sales stage to the next.
- Win Rate: Percentage of qualified opportunities that close as won.
- Average Deal Size: Mean revenue value of closed-won deals.
- Sales Cycle Length: Average time from opportunity creation to close.
- Forecasted Revenue: Expected revenue based on projected close dates and confidence assumptions.
- Quota Attainment: Actual performance against assigned sales target.
- Activity Volume: Calls, emails, demos, meetings, and follow-ups completed by rep or team.
- Open Opportunity Aging: How long deals remain open, often by stage.
- Renewal Rate: Percentage of recurring accounts that renew within a period.
- Churn Rate: Percentage of customers or revenue lost over time.
- Expansion Revenue: Additional revenue from upsells, cross-sells, or account growth.
- Account Health Score: Composite measure of retention risk and growth potential where relevant.
Core elements of an effective sales report
A useful report should always include:
- A defined time period
- Clear metric definitions
- Segment views by rep, team, product, or region
- Trend comparison against prior periods
- A short interpretation of what changed
- Recommended next actions
That last point is often missed. A report that does not drive action is just formatted data.
Common Types of Sales Reporting Teams Use
Pipeline and opportunity reports
These reports track open deals by stage, value, owner, probability, and age. They help teams identify bottlenecks, inspect deal quality, and understand whether enough pipeline exists to support future goals.
Typical use cases include:
- Reviewing stalled opportunities
- Finding deals with no recent activity
- Checking stage balance across the funnel
- Prioritizing manager deal reviews
Revenue and forecast reports
Revenue and forecast reports compare targets against actuals and expected outcomes. They show what has closed, what is projected, and how much confidence leadership should place in the current quarter.
These reports are especially important for:
- Monthly revenue reviews
- Quarter-end planning
- Board or executive updates
- Sales and finance alignment
Activity and performance reports
Activity reports measure calls, emails, meetings, demos, proposals, and other rep-level outputs. Performance reports connect those inputs to outcomes like meetings booked, opportunities created, and wins closed.
They are valuable when managers need to answer questions like:
- Is low pipeline caused by low activity or poor conversion?
- Which reps are productive but inefficient?
- Which behaviors correlate with stronger results?
Customer and retention reports
For recurring-revenue businesses and service firms, new sales alone do not tell the full story. Customer reports track renewals, churn risk, account usage signals, and upsell potential.
These are particularly relevant for:
- SaaS account management teams
- Managed service providers
- Agencies with recurring contracts
- Hybrid sales plus customer success models
5 Sales Reporting Templates With Practical Use Cases
Below are five high-value templates that cover the most common reporting needs across SaaS, B2B services, and smaller commercial teams.
1. Weekly sales activity report
This is the best starting point for small teams that need a lightweight operational pulse check. It focuses on outreach and execution rather than heavy analysis.
What it includes:
- Calls completed
- Emails sent
- Meetings booked
- Follow-ups overdue
- Opportunities created
- Weekly trend by rep
Best use case: A founder-led sales team with three account executives wants a simple Monday review to see whether top-of-funnel activity is strong enough to support next month’s pipeline.
Why it works: It keeps the team accountable without forcing a complex reporting process. For small teams, speed and consistency matter more than dashboard sophistication.
2. Pipeline status report
This report is critical for SaaS and B2B services teams managing multiple open deals with varying close dates and stakeholders.
What it includes:
- Open opportunities by stage
- Deal value by stage
- Time in stage
- Next step date
- Stalled deals with no recent activity
- Top at-risk opportunities
Best use case: A B2B software company wants weekly visibility into enterprise opportunities that have stopped progressing during procurement or legal review.
Why it works: It turns the pipeline from a static list into a management tool. Instead of reviewing every deal, leaders can focus on bottlenecks and intervention points.
3. Monthly revenue summary report
This is the executive-friendly report that helps leadership assess performance against goals without getting lost in operational detail.
What it includes:
- Bookings for the month
- Closed-won revenue
- Average deal size
- Win rate
- Quota attainment
- Comparison to prior month and target
Best use case: A services firm leadership team needs a monthly commercial review to understand whether bookings are pacing toward quarterly objectives.
Why it works: It gives a concise performance summary while still highlighting changes in quality and efficiency, not just top-line output.
4. Sales forecast report
A forecast report supports planning decisions by translating pipeline into probable revenue.
What it includes:
- Expected revenue by period
- Forecast category or confidence level
- Close timeline
- Commit vs upside view
- Historical forecast accuracy
- Assumptions or risk notes
Best use case: A SaaS sales director needs to align sales expectations with finance and hiring plans for the next quarter.
Why it works: Forecasting is not just about optimism. A structured forecast report introduces discipline and makes assumptions visible.
5. Account performance report
This template is ideal for recurring-revenue and relationship-driven models where account value extends beyond the first sale.
What it includes:
- Renewal date
- Account revenue
- Product or service usage indicators
- Expansion opportunity
- Churn risk flag
- Customer health trend
Best use case: A B2B service provider wants to identify which clients are most likely to renew, expand, or require intervention before contract review.
Why it works: It shifts reporting from one-time wins to lifetime value management, which is essential for stable growth.
How to Build Better Sales Reporting
Most reporting problems are not caused by a lack of tools. They are caused by poor design choices, inconsistent definitions, or trying to track too much.
Choose the right metrics for your sales model
Do not copy another company’s dashboard blindly. Your report design should reflect your sales motion.
- A short-cycle SMB SaaS team may focus on lead-to-demo and demo-to-close conversion.
- A B2B services firm may care more about proposal win rate and average contract value.
- A small team may prioritize activity, pipeline created, and next-step discipline.
Start with a few metrics that directly support decisions. If a metric does not influence coaching, planning, or prioritization, it may not belong in the core report.
Keep reporting simple and consistent
Consistency beats complexity. Use the same definitions, cadence, and format over time so trend analysis stays clean.
Best practices include:
- Standardize stage names and close date logic
- Agree on definitions for pipeline, forecast, and closed revenue
- Set a regular review cadence such as weekly and monthly
- Limit each report to a specific audience and purpose
Turn reports into action
Every report should answer: what should we do next?
For example:
- If stage conversion drops, inspect qualification quality.
- If deal aging rises, escalate stuck opportunities.
- If activity is high but wins are low, review messaging or targeting.
- If renewals weaken, involve customer success earlier.
The numbers are only the starting point. The real value comes from linking each report to decisions, follow-ups, and owner accountability.
Use software when reporting becomes hard to manage manually
Spreadsheets still work for very small teams with stable reporting needs. But manual reporting starts to break when:
- Data comes from multiple systems
- Definitions differ across teams
- Reports need to refresh frequently
- Leadership wants self-service visibility
- Analysts spend too much time compiling rather than interpreting
At that point, the right reporting software should offer:
- CRM and business system integration
- Automated refresh and scheduling
- Dashboard and paginated report formats
- Drill-down analysis
- Role-based access
- Reusable templates
Actionable Best Practices for Implementing Sales Reporting
If I were advising a sales operations or commercial leadership team, I would recommend these four implementation steps first.
1. Start with the business question, not the chart
Before building any report, decide what decision it should support. Examples:
- Can we trust the current quarter forecast?
- Which stage is causing pipeline leakage?
- Which accounts need renewal intervention?
This prevents bloated reports filled with interesting but low-value visuals.
2. Define metric ownership and calculation logic
Assign clear ownership for each KPI. Someone should be responsible for maintaining definitions, validating inputs, and resolving disputes. This is how you prevent endless meetings about whose number is correct.
3. Build one weekly report and one monthly report first
Do not launch ten dashboards at once. Start with:
- A weekly operational report for activity and pipeline movement
- A monthly leadership report for revenue, forecast, and trend analysis
This creates immediate reporting rhythm and adoption.
4. Automate data collection before you automate storytelling
First make sure CRM fields, stage updates, owner assignment, and close dates are reliable. Then layer visualizations and commentary on top. Automation cannot fix broken inputs.
5. Review, refine, and retire low-value reports
Every quarter, ask:
- Which reports drive action?
- Which ones are ignored?
- Which metrics no longer match the sales motion?
Good reporting systems evolve with the business.
Tips for Using Sales Reporting Without Overcomplicating It
The best sales reporting systems are often the simplest.
Start with one or two reports
You do not need a full reporting library on day one. Begin with the reports that answer the most important business questions. Expand only when usage and process maturity justify it.
Avoid vanity metrics
Large activity numbers can look impressive, but not all metrics are equally useful. Focus on numbers the team can influence and that connect to outcomes, such as qualified pipeline, conversion rates, and aging risk.
Review reports on a schedule
A report only matters when it becomes part of a management habit. Weekly sales meetings, monthly business reviews, and quarterly planning cycles all need role-appropriate reporting built in.
Use templates to save time
Templates improve speed, consistency, and adoption. They reduce formatting work, standardize definitions, and make it easier to compare periods and teams.
Build Sales Reporting Faster With FineReport
Building this manually is complex; use FineReport to utilize ready-made templates and automate this entire workflow.
For most growing organizations, the pain is familiar: data lives in CRM, spreadsheets, finance files, and customer systems, while reporting still depends on someone manually stitching it together every week. That creates delays, version-control issues, and inconsistent metrics across stakeholders.
FineReport helps solve that by enabling teams to:
- Connect sales data from multiple systems
- Build standardized dashboards and formatted reports
- Reuse ready-made templates for common sales reporting scenarios
- Automate refresh, distribution, and scheduled delivery
- Support drill-down analysis for managers and executives
- Reduce manual admin while improving reporting accuracy
Whether you need a weekly sales activity view for a small team, a pipeline status report for B2B opportunities, or a revenue and forecast pack for leadership, FineReport makes the process more scalable and more reliable.
The real advantage is operational. Instead of spending hours formatting spreadsheets, your team can spend more time interpreting results, coaching reps, and improving conversion.
If your current process is manual, fragmented, or difficult to maintain, this is usually the point where automation delivers immediate value.
FAQs
Sales reporting is the process of organizing sales data into clear reports that show performance, pipeline movement, and revenue trends over a set period. It helps leaders understand what is happening and what actions to take next.
Sales reporting gives teams visibility into forecast accuracy, pipeline health, rep performance, and retention or expansion trends. That makes it easier to catch problems early and make better revenue decisions.
Most sales reports should track pipeline value, win rate, conversion rate, average deal size, sales cycle length, forecasted revenue, and quota attainment. Depending on the business model, retention, churn, and expansion revenue may also matter.
A dashboard is usually a live view for monitoring current metrics, while a sales report is a structured summary built for review and decision-making. Reports typically add more context, trends, and analysis than dashboards alone.
Most teams use a weekly and monthly reporting cadence, with quarterly reporting for broader planning and forecasting. The right frequency depends on sales cycle length, team size, and how quickly leaders need to act on changes.


The Author
Yida Yin
FanRuan Industry Solutions Expert
Related Articles

Best Lawn Care Reporting Software Compared: 8 Tools for Scheduling, Invoicing, and Performance Tracking
$1 is an $1 and dashboard platform that helps lawn care businesses turn scheduling, invoicing, crew, and revenue data into clear $1. Best lawn care reporting software at a glance Below is a quick comparison of the best l
Yida YIn
Jun 25, 2026

Hong Kong Financial Reporting Standards Explained: 9 Practical Rules Finance Teams Need to Know
Hong Kong $1 standards matter because they determine how your business recognises revenue, values assets, reports risk, and withstands audit scrutiny. For finance teams, controllers, and compliance leaders, the challenge
Yida YIn
Jun 25, 2026

What Are Regulatory Reporting Services? A Practical Guide for Financial Institutions
$1 services help financial institutions collect, validate, format, and submit required data to regulators in a controlled, repeatable way. For banks, insurers, asset managers, fintechs, and enterprise compliance teams, t
Yida Yin
Jun 25, 2026