FineReport is an enterprise reporting and dashboard platform that helps teams unify ad data, build highly customized reports, and automate distribution at scale.
8 ad reporting tool options compared
1. DashThis
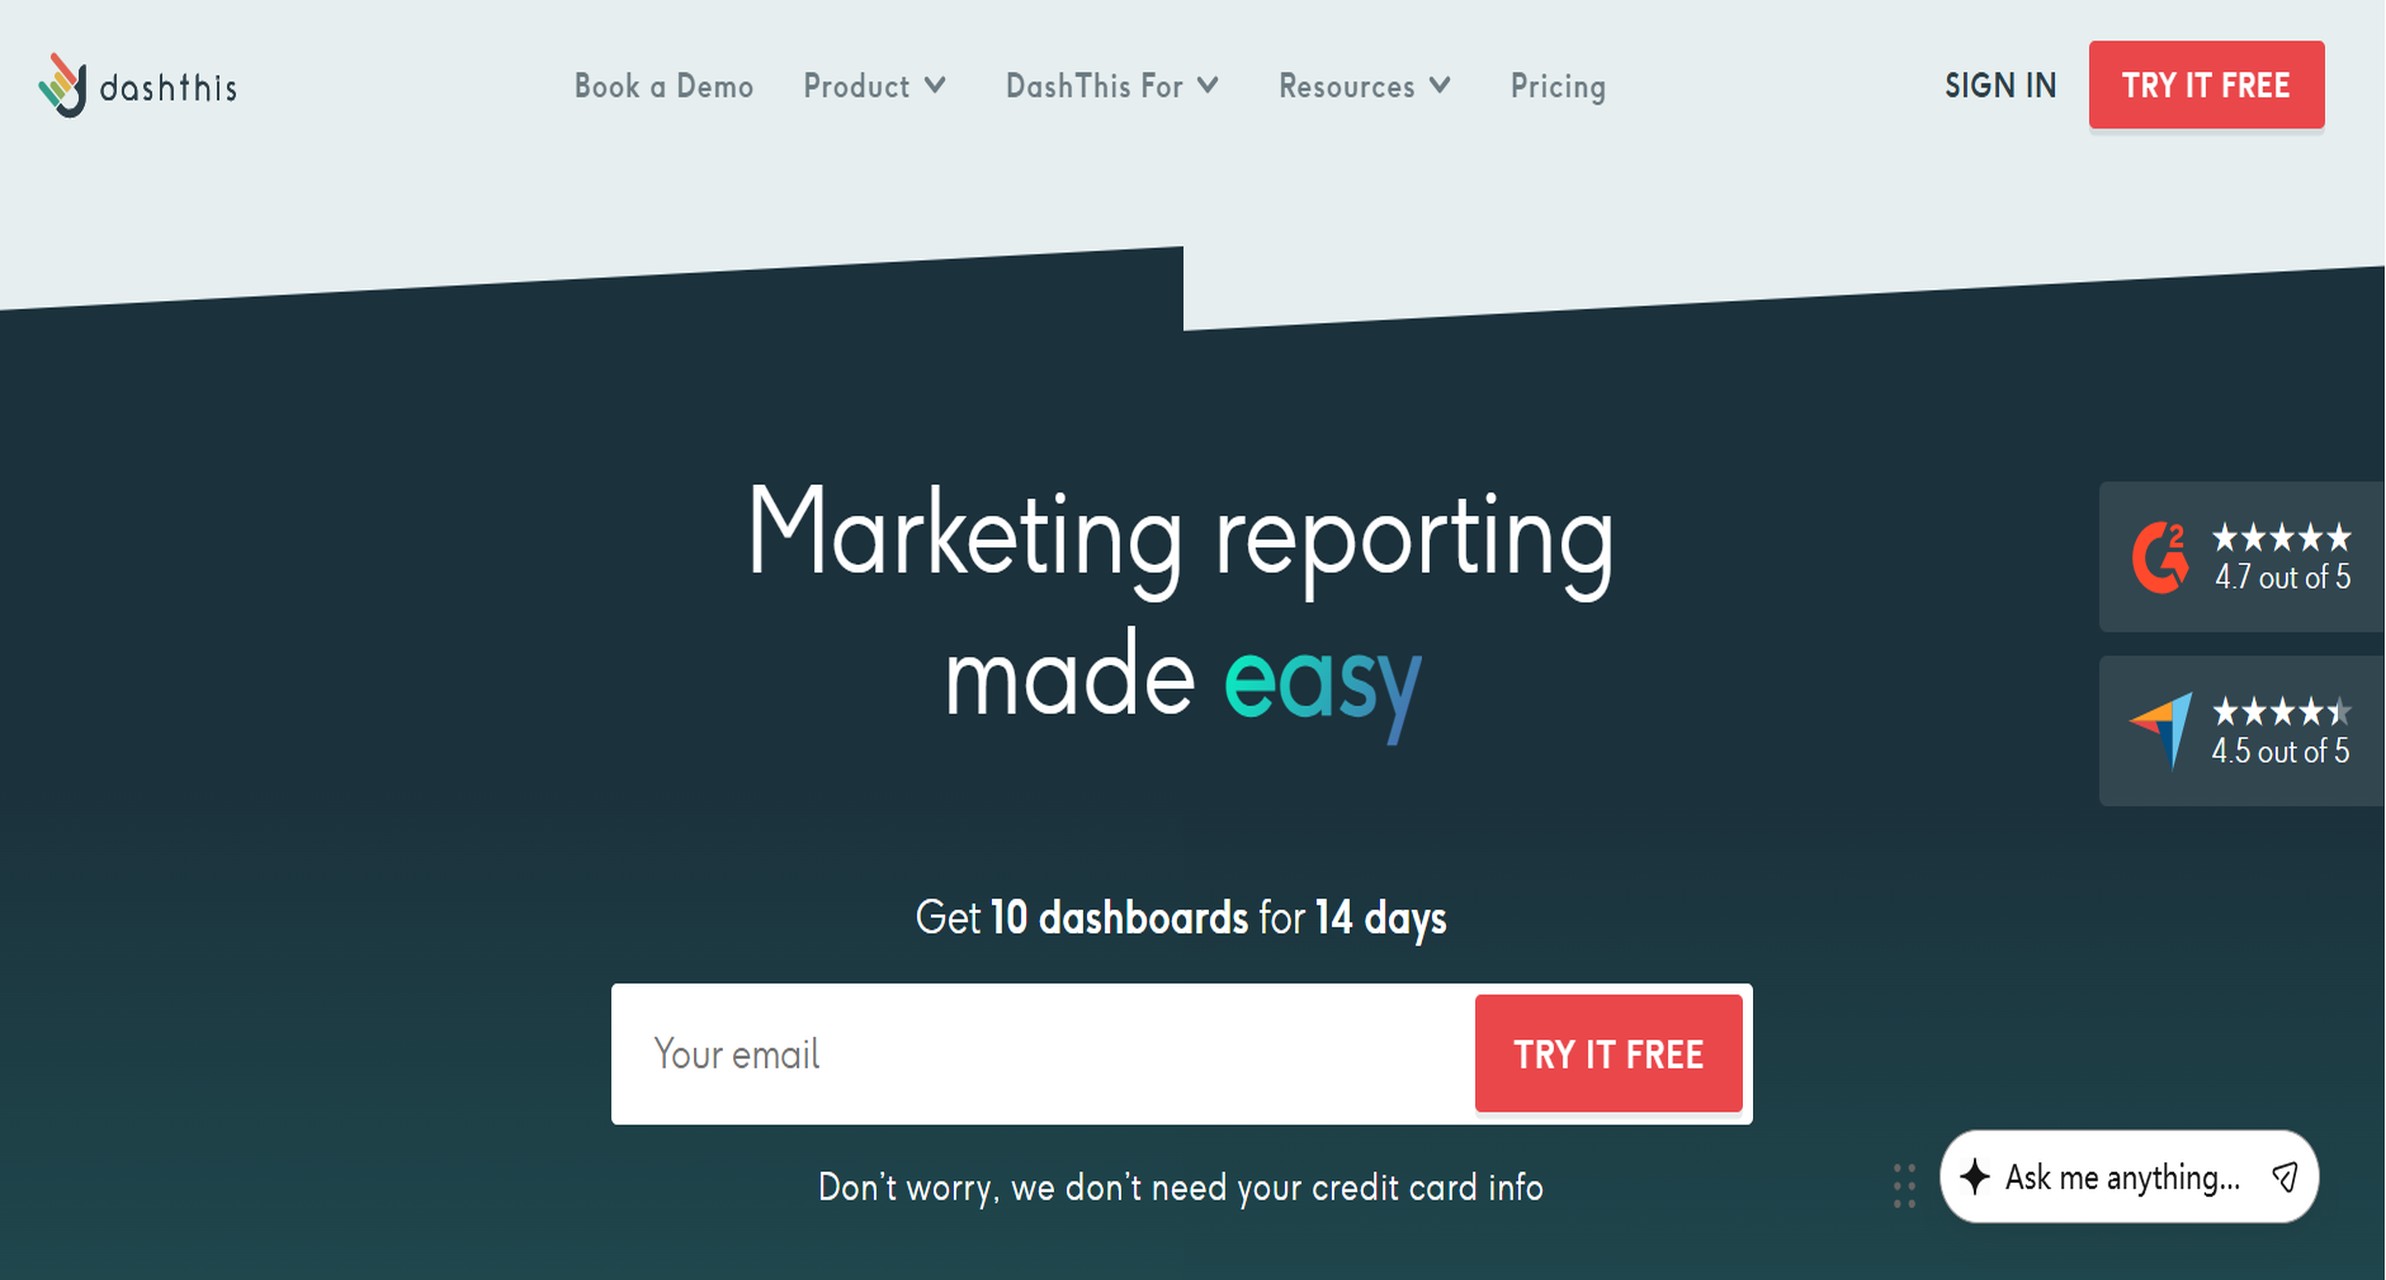
- One-sentence overview: DashThis is an ad reporting tool built for marketers and agencies that want fast, client-ready dashboards without a heavy technical setup.
- Key Features:
- Prebuilt marketing dashboard templates
- Multi-channel connectors for major ad and social platforms
- Automated report delivery
- White-label options for client-facing reporting
- KPI widgets and drag-and-drop dashboard editing
- Pros & Cons:
- Pros: Quick to launch, easy for non-technical users, strong for recurring client reports, clean visual presentation
- Cons: Less flexible for deep data modeling, limited for advanced attribution analysis, customization can feel constrained for complex reporting logic
- Best For (Target user/scenario): Small agencies, consultants, and in-house marketers that need simple cross-channel reporting with minimal setup.
DashThis stands out when speed matters more than analytical depth. If your team mainly needs to combine Google Ads, Meta Ads, LinkedIn Ads, and similar channels into a polished monthly or weekly report, it is a practical choice. As an ad reporting tool, it is strongest in presentation and efficiency rather than in advanced transformation or warehouse-style data management.
Pricing fit and ideal use cases are straightforward: it generally works best for teams that value convenience and can justify paying for packaged simplicity. If you need highly customized calculations or deeper BI workflows, you may outgrow it.
2. Supermetrics
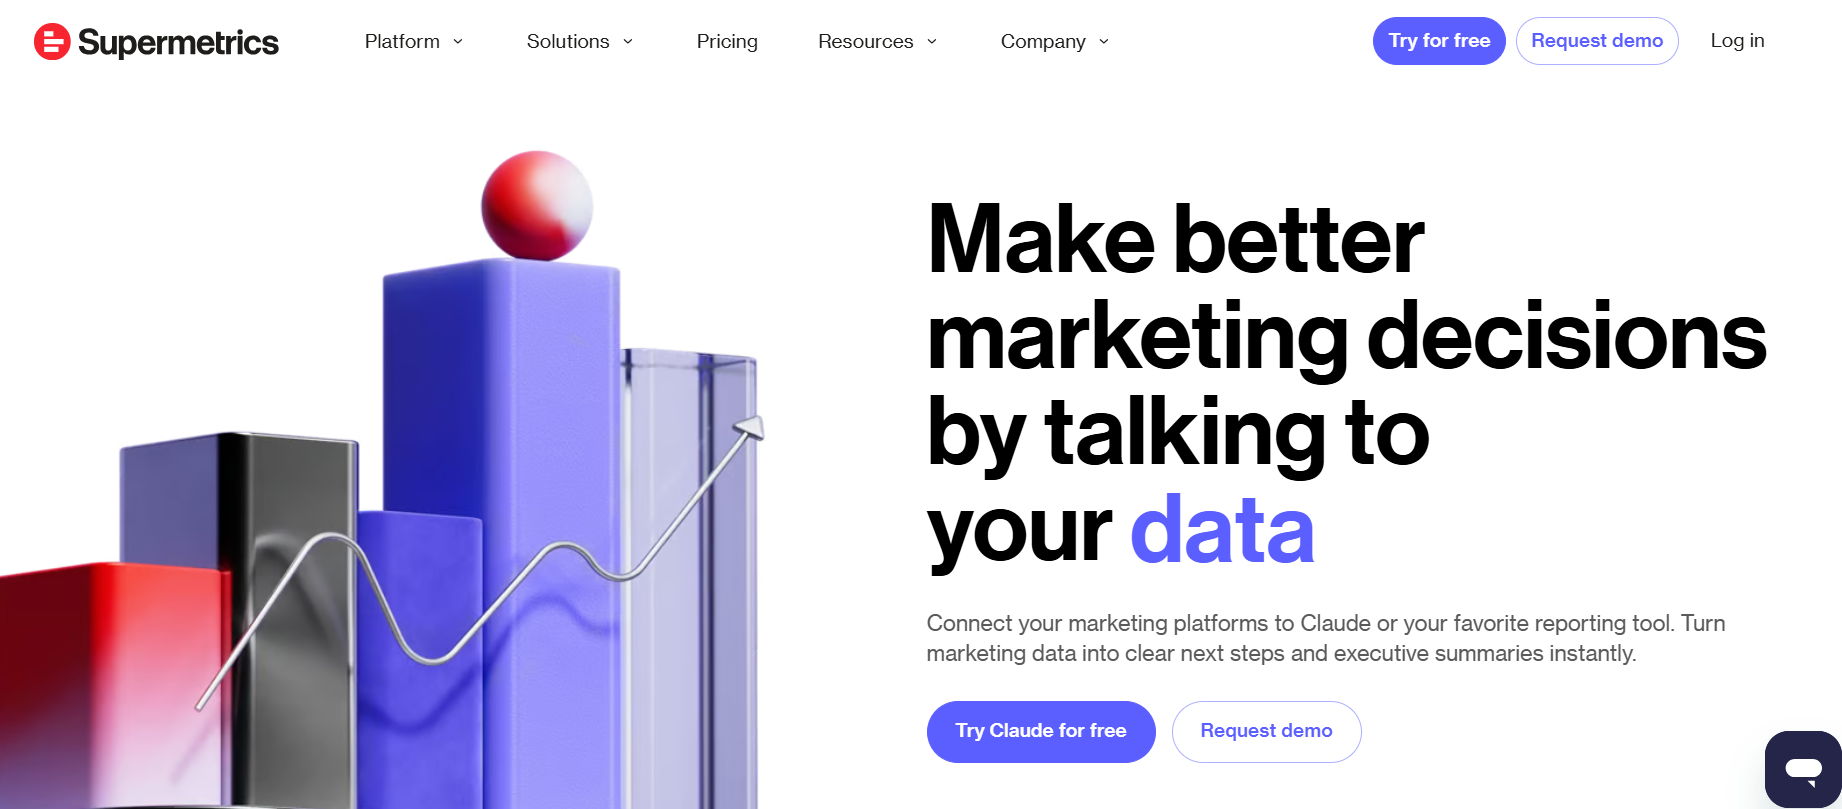
- One-sentence overview: Supermetrics is an ad reporting tool focused on extracting marketing data into spreadsheets, warehouses, and BI platforms for flexible analysis.
- Key Features:
- Broad connector library for ad, analytics, and ecommerce platforms
- Exports to Google Sheets, Excel, BigQuery, Looker Studio, and more
- Scheduled data refreshes
- Custom query controls for dimensions and metrics
- Data pipeline options for more advanced teams
- Pros & Cons:
- Pros: Flexible, widely used, strong connector ecosystem, excellent for teams that already work in spreadsheets or BI tools
- Cons: Reporting experience depends on the destination tool, costs can rise with connector needs, not a polished out-of-the-box dashboard layer by itself
- Best For (Target user/scenario): Performance marketers, analysts, and growth teams that want control over where ad data lives and how it is visualized.
Supermetrics is often less about the final dashboard and more about reliable movement of ad data. That makes it a strong option if your reporting workflow already centers on Google Sheets, Excel, or a business intelligence platform. Compared with a more packaged ad reporting tool, it offers more flexibility but expects users to build the final reporting layer elsewhere.
For teams evaluating long-term fit, Supermetrics can be a smart middle ground between manual exports and a fully engineered reporting stack. It is especially useful when stakeholders want channel data in familiar tools instead of learning a new reporting interface.
3. Whatagraph
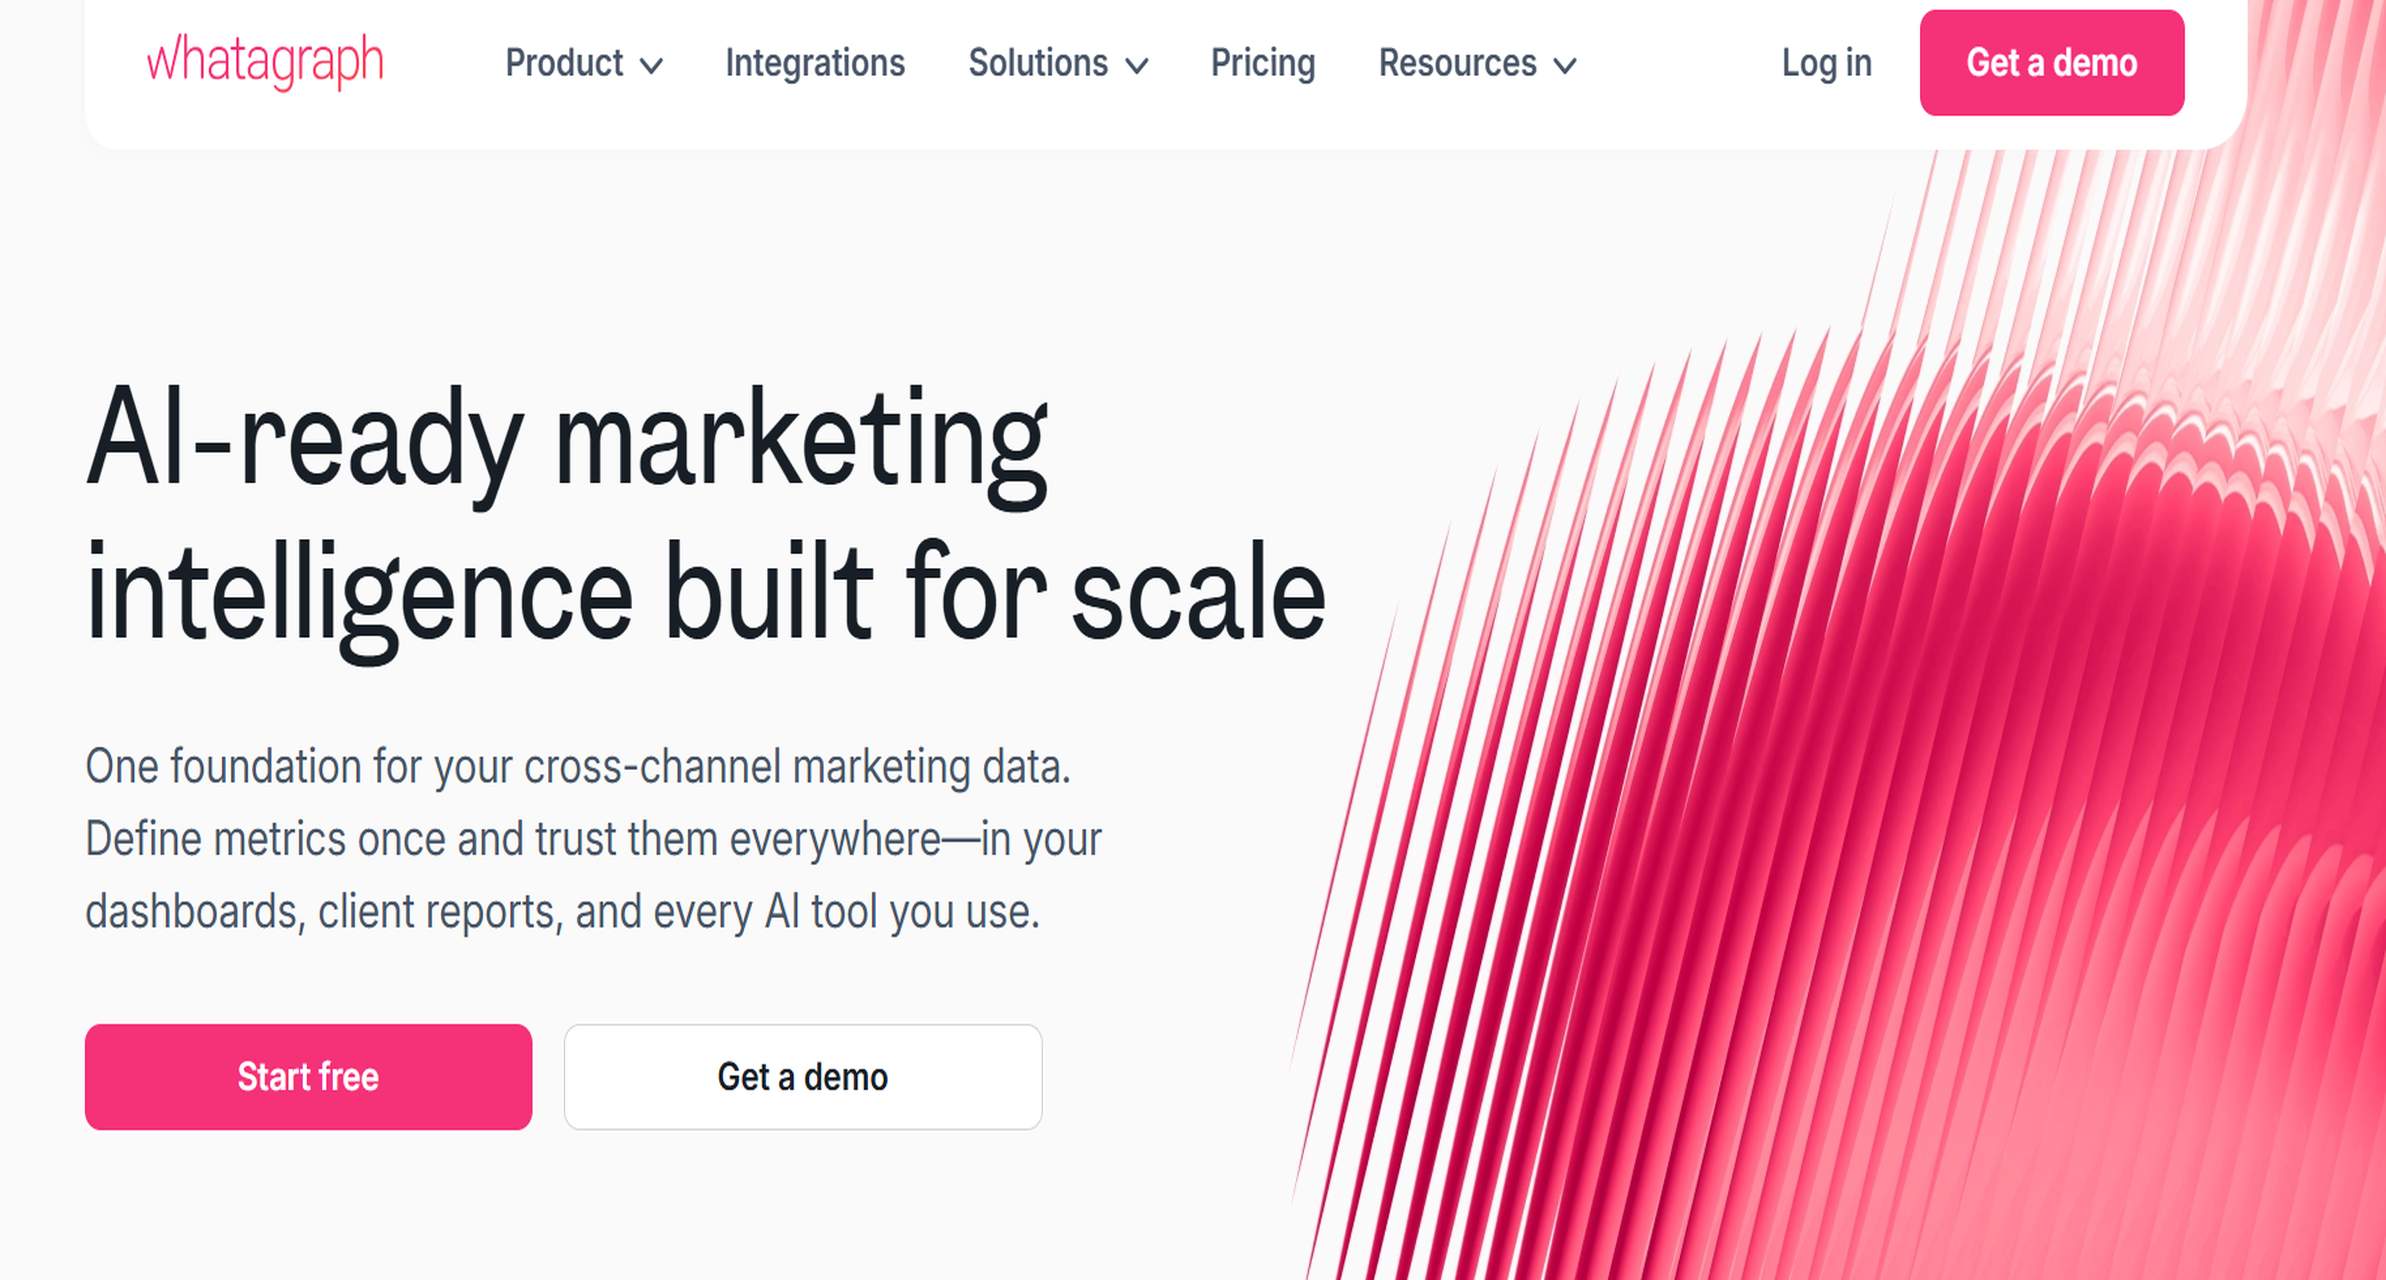
- One-sentence overview: Whatagraph is an ad reporting tool designed for agencies that need polished multi-channel reports, collaboration features, and client-friendly delivery.
- Key Features:
- Cross-channel reporting dashboards
- White-label reporting and shareable views
- Report templates for agencies
- Collaboration and commenting workflows
- Data blending across marketing sources
- Pros & Cons:
- Pros: Attractive dashboards, agency-oriented workflow, easier collaboration than many lightweight tools, useful templates
- Cons: Can become expensive for growing account volumes, advanced customization is not as deep as full BI platforms, some data handling use cases may require workarounds
- Best For (Target user/scenario): Agencies and service teams delivering recurring reports to multiple clients.
Whatagraph is built with presentation and workflow in mind. If client communication is central to your reporting process, it offers a more refined experience than many entry-level dashboard products. As an ad reporting tool, it balances usability and appearance well, especially for teams that need stakeholders to quickly understand campaign performance.
Its pricing fit tends to be strongest for agencies where reporting speed and client experience directly affect profitability. For internal analytics teams, however, a more modeling-focused platform may offer better long-term value.
4. Funnel
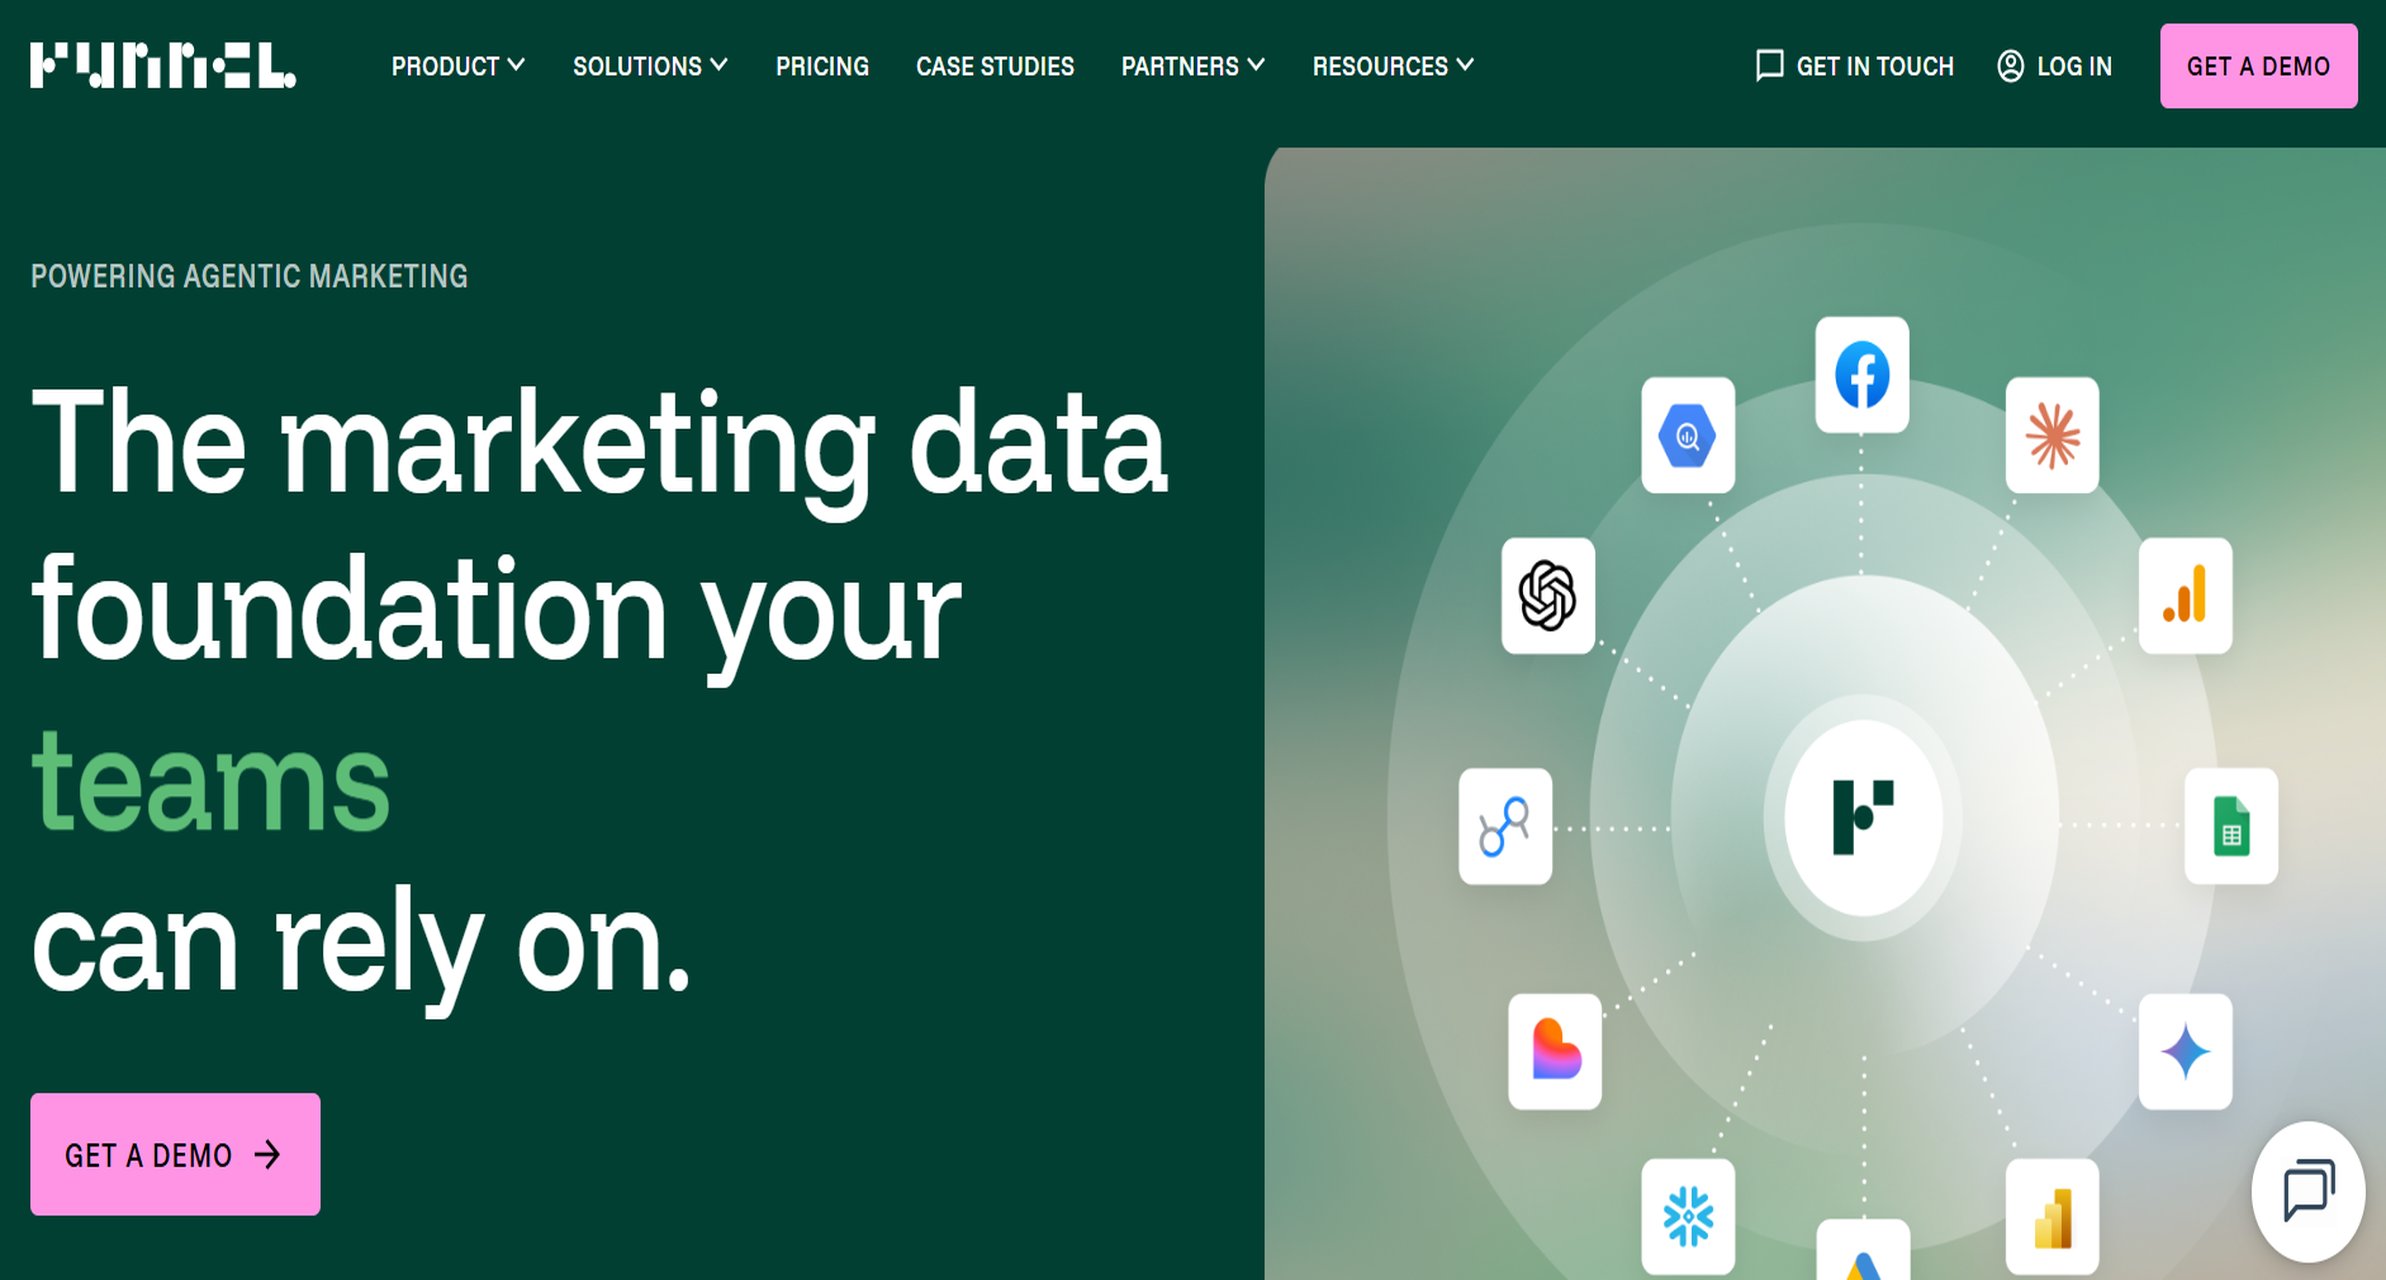
- One-sentence overview: Funnel is an ad reporting tool and marketing data platform focused on normalization, governance, and scalable reporting infrastructure.
- Key Features:
- Data collection from many advertising and marketing platforms
- Automated data normalization and mapping
- Centralized metric governance
- Exports to BI tools, spreadsheets, and data warehouses
- Support for scalable reporting operations
- Pros & Cons:
- Pros: Strong for data consistency, reduces manual cleanup, scalable for growing teams, useful governance features
- Cons: Higher cost than lightweight tools, setup can require planning, may be more infrastructure than smaller teams need
- Best For (Target user/scenario): Mid-market and enterprise marketing teams that need trusted, unified ad data across many channels and stakeholders.
Funnel is a stronger fit when reporting complexity grows beyond dashboard assembly. Teams managing many accounts, regions, or naming conventions often need an ad reporting tool that can standardize data before it reaches the reporting layer. That is where Funnel performs well.
It is particularly useful when leaders want consistent KPI definitions across channels and markets. Smaller teams may find it more than they need, but larger organizations can benefit from the control it brings.
5. Looker Studio
- One-sentence overview: Looker Studio is a customizable ad reporting tool for budget-conscious teams that want interactive dashboards with low entry cost.
- Key Features:
- Free dashboard builder
- Native Google ecosystem integrations
- Shareable interactive reports
- Custom charts, filters, and blended data
- Broad connector support through partners
- Pros & Cons:
- Pros: Low cost to start, flexible visuals, easy sharing, accessible for many marketers
- Cons: Performance can vary with larger datasets, governance is limited, some connectors require third-party fees, complex dashboards can become hard to maintain
- Best For (Target user/scenario): In-house teams and freelancers that need affordable ad reporting dashboards and can tolerate some maintenance.
Looker Studio remains one of the most common starting points for ad reporting. It is attractive because teams can assemble a useful dashboard without large software costs. As an ad reporting tool, it works best when requirements are moderate and when users are comfortable handling some setup and troubleshooting on their own.
Its biggest advantage is flexibility relative to price. Its biggest drawback is that complexity can pile up over time, especially once many stakeholders, blended sources, and custom metrics enter the picture.
6. Power BI
- One-sentence overview: Power BI is an advanced ad reporting tool option for analysts who need deep modeling, strong governance, and enterprise-grade reporting control.
- Key Features:
- Powerful data modeling and transformation
- Large ecosystem of connectors
- Interactive dashboards and scheduled refreshes
- Role-based access and governance features
- Tight integration with Microsoft environments
- Pros & Cons:
- Pros: Strong analytics depth, enterprise control, scalable semantic modeling, excellent for complex reporting environments
- Cons: Steeper learning curve, more setup effort than plug-and-play tools, may require technical ownership for best results
- Best For (Target user/scenario): Analysts, BI teams, and enterprises that treat ad reporting as part of a broader business intelligence strategy.
Power BI is not the simplest ad reporting tool on this list, but it is one of the most capable for complex analysis. If your team needs to join ad data with CRM, sales, finance, or product data, Power BI can provide much more than a dashboard-only product.
For many organizations, Power BI becomes more valuable as reporting maturity increases. It is less ideal for teams that only want a quick client report and more ideal for those building a durable reporting system.
7. TapClicks
- One-sentence overview: TapClicks is an ad reporting tool built for agencies and media organizations managing high-volume reporting, pacing, and performance workflows.
- Key Features:
- Multi-channel marketing reporting
- Automated report generation
- White-label dashboards
- Workflow and operations support for agencies
- Broad integration support
- Pros & Cons:
- Pros: Agency-focused scale, automation-friendly, useful for account-heavy operations, good fit for recurring reporting demands
- Cons: Can be expensive, interface complexity may be higher than simple dashboard tools, customization depth varies by use case
- Best For (Target user/scenario): Agencies, franchise marketing groups, and media teams managing many clients or locations.
TapClicks is typically evaluated by organizations with operational reporting needs, not just analytical ones. That includes teams that need to automate dashboards across many accounts and standardize reporting processes. As an ad reporting tool, it often appeals to larger service environments where process efficiency matters as much as the final dashboard.
Its value is most visible when reporting volume is high. For a small in-house team, it may be more platform than necessary.
8. AgencyAnalytics
- One-sentence overview: AgencyAnalytics is an all-in-one ad reporting tool for marketing teams and agencies that want dashboards, client reporting, and monitoring in one platform.
- Key Features:
- Marketing and PPC reporting dashboards
- White-label client access
- Automated reports and scheduled emails
- Goal tracking and monitoring
- Built-in integrations across common marketing channels
- Pros & Cons:
- Pros: Easy to use, agency-friendly structure, strong all-in-one experience, efficient for recurring reporting
- Cons: Limited advanced modeling, can become costly with scale, less suitable for highly customized enterprise reporting
- Best For (Target user/scenario): Agencies and marketing teams that prioritize convenience and broad reporting coverage over deep technical flexibility.
AgencyAnalytics offers a well-rounded experience for teams that want to avoid stitching together multiple tools. As an ad reporting tool, it is practical for recurring reporting, account oversight, and stakeholder visibility. It is especially appealing when users want a balance of dashboarding, reporting automation, and account management.
For teams with advanced analytics requirements, however, it may function better as a delivery layer than as the foundation of a sophisticated data strategy.
How to choose the best ad reporting tool in 2026
Choosing the best ad reporting tool in 2026 depends less on who has the most connectors and more on how well the platform fits your reporting workflow, technical resources, and growth plans.
What marketers and analysts should evaluate before committing to a platform
Before selecting a platform, marketers and analysts should define what problem they are solving. Some teams mainly need executive visibility. Others need client-facing dashboards. Others need clean data for attribution, forecasting, and performance analysis.
Key evaluation questions include:
- How many ad platforms need to be included?
- Do you need only dashboards, or also data transformation and storage?
- Will non-technical users build reports?
- Do stakeholders need white-label or self-serve access?
- How often must reports refresh?
- Do you need to blend ad data with CRM, revenue, or offline conversion data?
A lightweight ad reporting tool may be enough for weekly media updates. A larger team with multiple brands or regions may need stronger governance, reusable metrics, and scalable connectors. This is also where FineReport deserves attention. FineReport is especially useful for teams that need pixel-level layout control, complex report logic, and enterprise-grade report distribution beyond standard marketing dashboards.
The core reporting, attribution, and automation features that matter most
The most important features usually fall into four buckets:
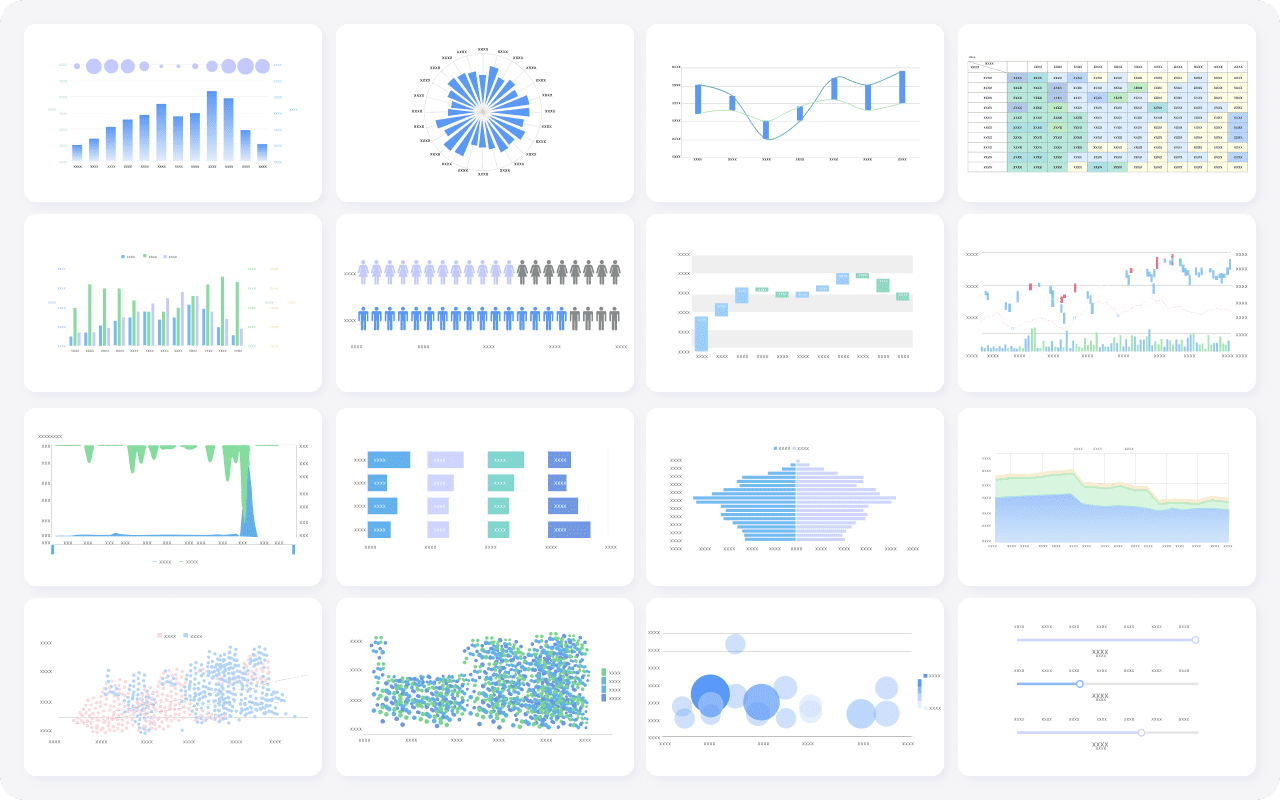
- Reporting: customizable dashboards, drill-downs, exports, stakeholder views, and mobile-friendly access
- Attribution: support for conversion paths, blended data, campaign-level comparisons, and integration with analytics or CRM data
- Automation: scheduled refreshes, alerts, recurring report delivery, and workflow efficiency
- Data management: normalization, metric consistency, field mapping, and API or warehouse compatibility
If your team wants to evolve from surface-level reporting to more advanced performance intelligence, the best ad reporting tool is often the one that supports both current dashboards and future data maturity.
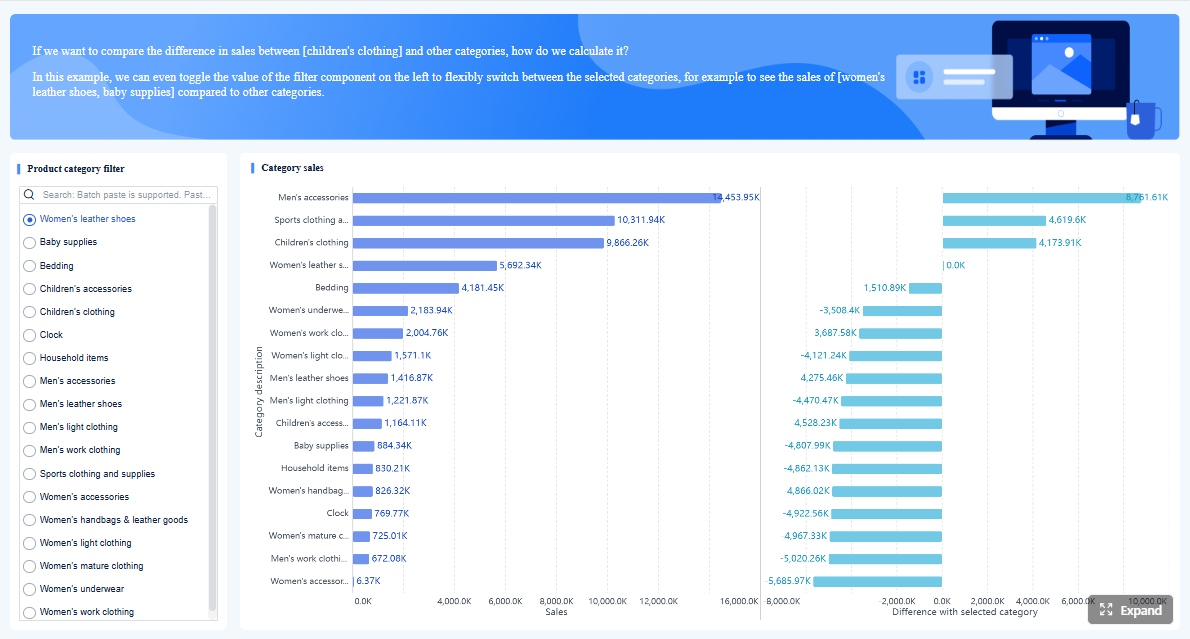 Click To Try The Dashboard
Common trade-offs between ease of use, customization, and cost
Most tools force a trade-off between three things:
- Ease of use: faster setup, simpler interfaces, lower training needs
- Customization: deeper metric logic, more visual control, broader data modeling
- Cost: lower entry pricing versus rising costs for connectors, users, refresh frequency, or scale
A simple dashboard product is usually easier to launch but may have limited flexibility. A BI tool offers more customization but often requires more technical skill. A managed marketing reporting platform may reduce operational burden but cost more over time.
This is why many enterprises consider FineReport when standard dashboard tools become restrictive. It can bridge the gap between business-friendly reporting and advanced customization, especially when teams need structured reports, dashboards, parameterized analysis, and large-scale distribution in one environment.
Side-by-side comparison: features, pricing, and best-fit users
Reporting capabilities
When comparing each ad reporting tool, reporting capability should include more than visual appeal.
Look at:
- Dashboard flexibility: Can users build custom layouts and calculations?
- Scheduled exports: Can reports be sent automatically in PDF, link, or embedded formats?
- White-labeling: Is branding available for agencies or client services teams?
- Stakeholder views: Can executives, clients, and channel managers each see the right level of detail?
DashThis, Whatagraph, TapClicks, and AgencyAnalytics perform well for presentation and delivery. Looker Studio offers flexibility at low cost. Power BI and FineReport offer deeper reporting control for organizations that need complex logic and governed reporting outputs.
Data coverage and integrations
The best ad reporting tool should cover both your current stack and your future stack.
Compare platforms on:
- Supported ad networks such as Google Ads, Meta Ads, LinkedIn Ads, TikTok Ads, and programmatic sources
- CRM connectors for systems like Salesforce and HubSpot
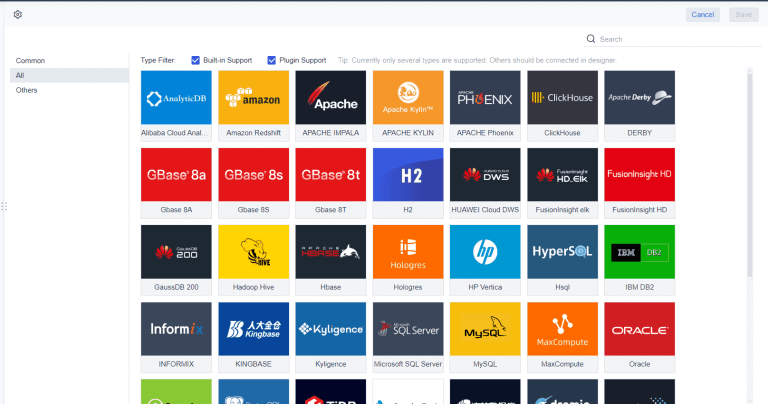
- Data warehouse options such as BigQuery, Snowflake, or Amazon Redshift
- API depth for custom sources and internal systems
Supermetrics and Funnel are strong in data connectivity and movement. Power BI is strong when data comes from many business systems. FineReport is particularly effective when ad data must be integrated into broader enterprise reporting environments rather than kept only within marketing dashboards.
Usability and team workflow
Usability is often the deciding factor after features and price.
Assess:
- Setup speed
- Template quality
- Collaboration tools
- Governance and permissions
- Learning curve for business users and analysts
DashThis and AgencyAnalytics score well on ease of adoption. Whatagraph is strong for collaborative client reporting. Power BI has a steeper curve but more analytical power. FineReport is a compelling option for organizations that need business-user accessibility plus structured governance for larger reporting operations.
Cost and scalability
Pricing for an ad reporting tool can be deceptive if you only compare entry plans.
Consider:
- Base subscription cost
- Connector or source limits
- User seats and stakeholder viewers
- Data refresh frequency
- Data volume handling
- Long-term cost as more clients, brands, or regions are added
Looker Studio can be the cheapest starting point but may require paid connectors and maintenance time. Supermetrics costs can scale with connector usage. Funnel and TapClicks often fit larger budgets. Power BI can be cost-effective for Microsoft-centric teams with in-house expertise. FineReport is often worth evaluating when reporting becomes business-critical and the organization needs long-term scalability rather than just a low starting price.
Pros and cons by use case
Best options for in-house marketing teams
For in-house teams, the best ad reporting tool usually balances speed, affordability, and visibility across major channels.
Top fits include:
- Looker Studio: best for low-cost customization
- Supermetrics: best if the team works in Sheets, Excel, or BI tools
- AgencyAnalytics: best for convenience and all-in-one reporting
- FineReport: best for organizations that want ad reporting to connect with broader operational and executive reporting
In-house teams should avoid overbuying. If campaign reporting is relatively simple, a lightweight tool may be enough. But if paid media reporting must be tied to revenue, regional operations, or enterprise KPIs, a more capable platform becomes more attractive.

Best options for agencies and client reporting
Agencies need strong white-label dashboards, automation, and account management efficiency.
Top fits include:
- DashThis: best for fast, polished recurring reports
- Whatagraph: best for presentation and collaboration
- TapClicks: best for reporting operations at scale
- AgencyAnalytics: best all-in-one experience for many agencies
The right ad reporting tool for an agency depends on reporting volume and service model. Boutique agencies may prioritize speed and appearance. Larger agencies may need more automation, governance, and operational standardization.
Best options for analysts and BI-focused teams
Analysts and BI teams usually need modeling power, custom metrics, and scalability.
Top fits include:
- Power BI: best for advanced modeling and enterprise reporting
- Funnel: best for normalized marketing data infrastructure
- Supermetrics: best for flexible extraction into existing analysis environments
- FineReport: best for teams that need advanced enterprise reporting, highly customized dashboards, and multi-department reporting workflows
For these users, the best ad reporting tool is rarely the easiest one to start with. It is the one that best supports trusted metrics, reusable logic, and growth in complexity over time.
Final verdict: which tool is right for your team?
If you need a quick recommendation, start with your team’s reporting maturity.
- Choose DashThis if you want fast, client-ready dashboards with little setup.
- Choose Supermetrics if you want flexible data extraction into spreadsheets or BI tools.
- Choose Whatagraph if your agency values polished reporting and collaboration.
- Choose Funnel if you need normalized, scalable marketing data infrastructure.
- Choose Looker Studio if budget is tight and customization matters.
- Choose Power BI if analysts need deeper modeling and enterprise control.
- Choose TapClicks if you manage reporting at agency or media-team scale.
- Choose AgencyAnalytics if you want an easy all-in-one reporting experience.
- Choose FineReport if your team needs a more advanced reporting platform that can unify ad data with broader business reporting, deliver highly customized dashboards, and support enterprise-level distribution and governance.
Quick recommendations based on budget, reporting complexity, and technical resources
- Low budget, simple needs: Looker Studio
- Moderate budget, simple recurring reports: DashThis or AgencyAnalytics
- Data extraction first, dashboard second: Supermetrics
- Agency collaboration and white-labeling: Whatagraph
- Scalable marketing data operations: Funnel
- Advanced analytics and BI ownership: Power BI
- Enterprise reporting beyond marketing dashboards: FineReport
When to choose a lightweight dashboard tool versus a more advanced reporting stack
Choose a lightweight ad reporting tool when:
- You mainly report on a few ad channels
- Stakeholders need simple KPI visibility
- The team has limited technical support
- Speed matters more than deep customization
Choose a more advanced stack when:
- You need to join ad data with CRM, finance, or product systems
- Metric definitions must be standardized across teams
- Reporting must scale across brands, clients, or regions
- Governance, security, and complex formatting matter
This is where FineReport can become especially relevant. It is not just a dashboard maker. It is a reporting platform suited to organizations that need both detailed operational reports and executive dashboards in the same ecosystem.
Key questions to ask before making a final shortlist
Before you decide on any ad reporting tool, ask:
- What reports do we need in 30 days versus 2 years?
- Who will build and maintain the reports?
- How many data sources must be connected?
- Do we need self-service analysis, pixel-perfect reports, or both?
- How important are white-labeling and client access?
- What happens to cost as our reporting footprint grows?
- Can the platform support broader reporting needs beyond paid media?
The best ad reporting tool in 2026 is not simply the one with the longest feature list. It is the one that matches your team’s workflow, supports trusted decision-making, and scales without forcing a rebuild later. For teams with straightforward needs, a lightweight option can work well. For teams planning a more durable reporting foundation, FineReport is a strong platform to shortlist alongside the leading marketing-focused tools.
FAQs
The best tool depends on your workflow, team size, and reporting complexity. Marketers who want fast client-ready dashboards may prefer DashThis or Whatagraph, while teams needing deeper data control may lean toward Supermetrics, Funnel, or FineReport.
Start by checking which ad platforms you need to connect, how much customization you require, and whether reports are mainly for internal analysis or client delivery. Budget, automation needs, and data governance requirements should also guide the decision.
Agencies often benefit most from tools that support white-label dashboards, recurring report delivery, and easy cross-channel views. DashThis and Whatagraph are common fits because they focus on presentation speed and client-friendly reporting.
An ad reporting tool is usually built to connect marketing channels quickly and present campaign results with less setup. A BI platform offers more flexibility for modeling, analysis, and custom dashboards but often requires more technical work.
Yes, many ad reporting tools can pull data from multiple ad platforms, refresh it on a schedule, and send reports automatically. This helps teams reduce manual exports and keep stakeholders updated with consistent performance reporting.


The Author
Yida YIn
FanRuan Industry Solutions Expert
Related Articles

Financial Reporting Valuation Explained: A Practical Guide to ASC 820, ASC 805, ASC 350, and ASC 718
$1 valuation is the process companies use to measure assets, liabilities, equity instruments, and reporting units for compliant $1. For CFOs, controllers, finance directors, and audit facing accounting teams, the challen
Yida Yin
Jun 25, 2026
Office 365 Reporting Tool Guide: Track Usage, Security, and License Waste in One Dashboard
An office 365 $1 should do more than generate static usage charts. For IT managers, operations leaders, and Microsoft 365 administrators, the real value is operational visibility: who is actually using the platform, wher
Yida Yin
Jun 25, 2026

Marketing Automation Reporting Framework: 7 KPIs, Dashboard Templates, and Workflow Steps
Marketing automation reporting gives enterprise marketing teams a repeatable way to prove impact, spot bottlenecks, and act faster without waiting for analysts to rebuild the same report every week. If you manage demand
Yida Yin
Jun 24, 2026