Inventory reporting is the operating system behind smarter replenishment, tighter working capital control, and more reliable customer service. For supply chain leaders, finance managers, and operations directors, the challenge is not a lack of inventory data. It is the lack of a structured reporting framework that turns daily stock movements into clear decisions. When reporting is fragmented across spreadsheets, disconnected ERP exports, and delayed warehouse updates, businesses end up reacting too late to stockouts, carrying too much slow-moving inventory, and quietly losing margin through poor purchasing and fulfillment decisions.
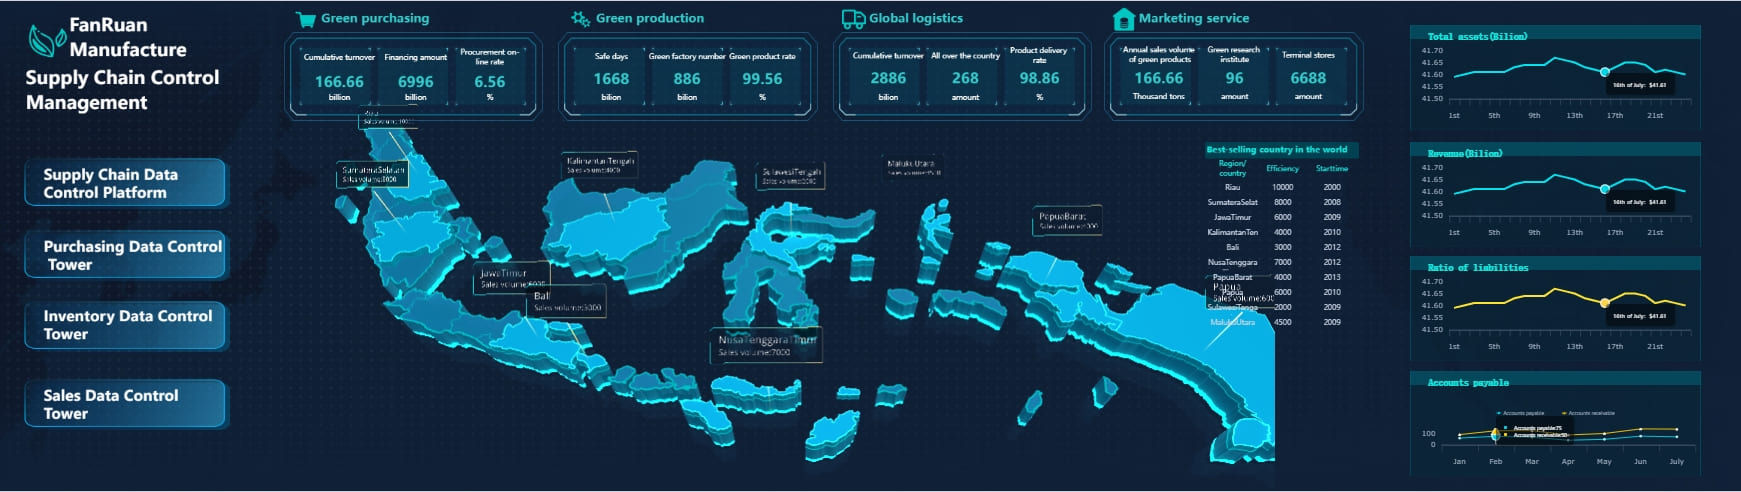
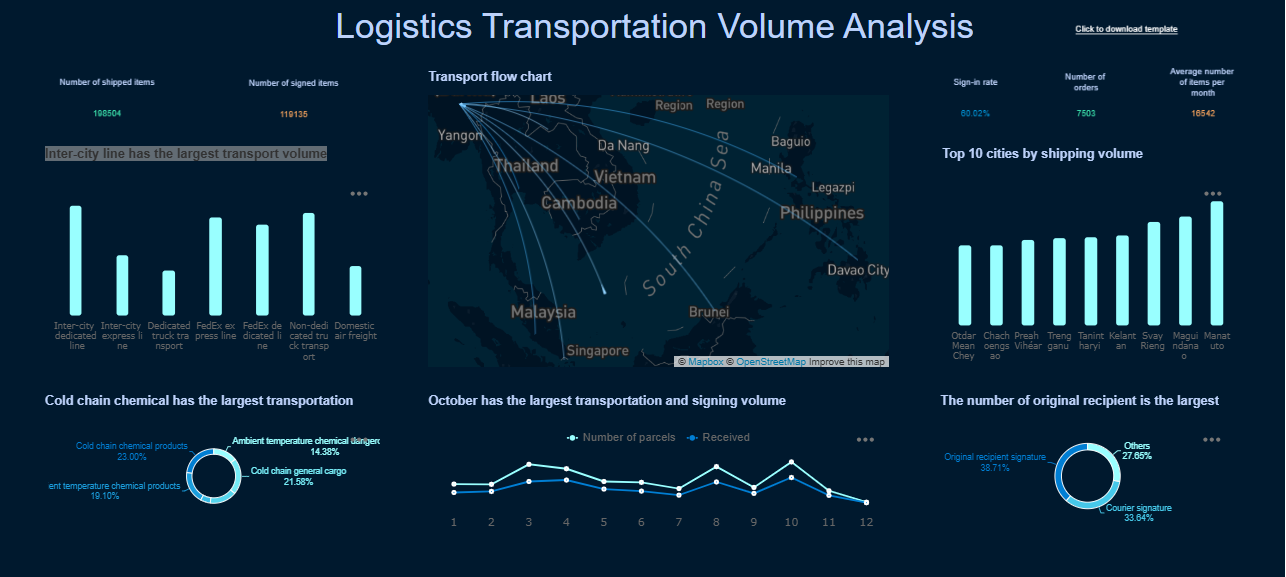
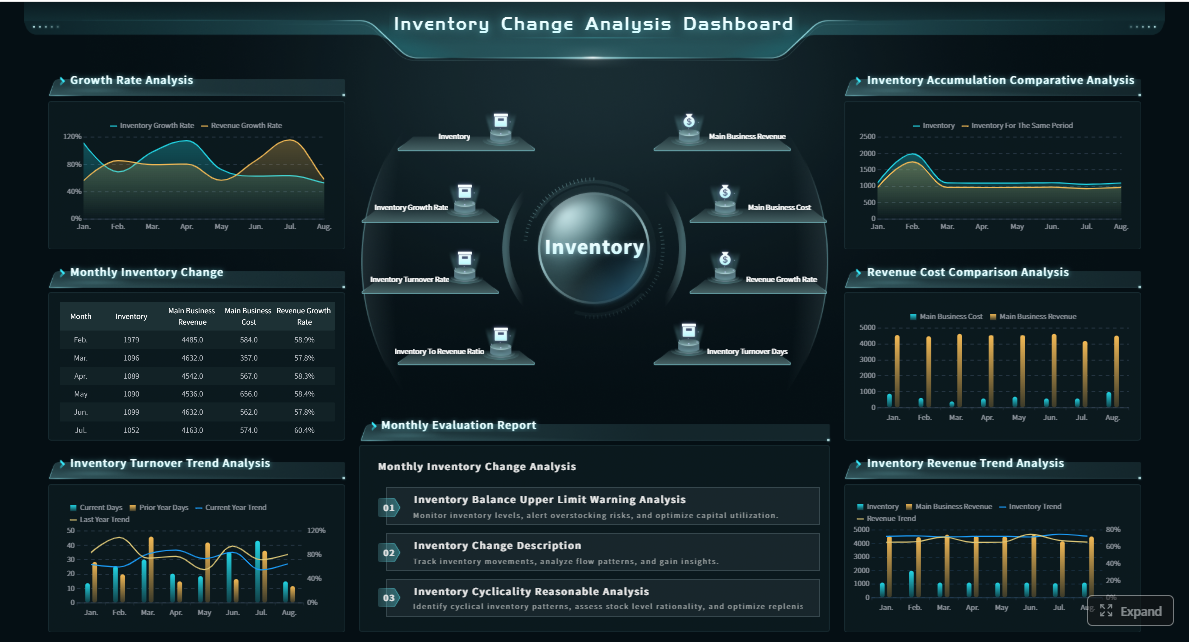 Click To Try The Dashboard
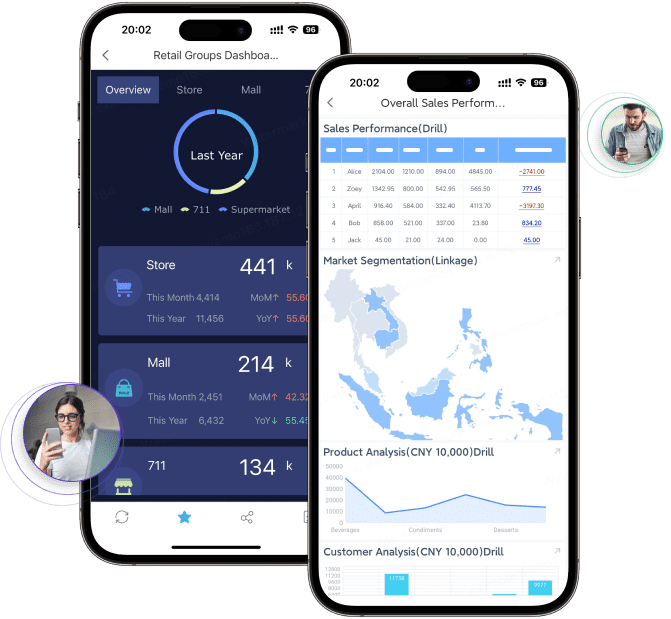
All reports in this article are built with FineReport
What inventory reporting is and why it matters in enterprise operations
Inventory reporting is the process of collecting, organizing, and visualizing inventory data so teams can monitor stock health, identify risk, and make better operational and financial decisions. In practical enterprise terms, it means giving supply chain, finance, procurement, merchandising, and warehouse teams a shared view of what inventory exists, where it sits, how fast it moves, what it costs, and where action is needed now.
For supply chain leaders, inventory reporting answers questions such as which SKUs are most at risk of stockout, which suppliers are causing service failures, and where safety stock needs recalibration. For finance, it reveals how much capital is tied up in inventory, how much is aging, and where carrying cost is undermining profitability. For operations teams, it provides day-to-day control over stock positions, replenishment urgency, warehouse movements, and exception handling.
Strong inventory reporting reduces three enterprise pain points:
- Stockouts: Lost sales, delayed fulfillment, and damaged customer trust
- Overstock: Cash tied up in low-velocity inventory and rising storage costs
- Margin leakage: Erosion caused by markdowns, emergency freight, shrinkage, and poor allocation
Without a reporting framework, teams often rely on isolated spreadsheets that show only snapshots. That creates conflicting definitions, slow updates, and inconsistent action. A KPI framework solves this by standardizing the metrics, ownership, refresh cadence, and escalation rules required to run inventory as a controlled business process rather than a reactive fire drill.
The KPI framework for inventory reporting
A high-performing inventory reporting system starts with a disciplined KPI structure. The best frameworks balance customer service, inventory productivity, and control accuracy. That combination helps enterprises avoid optimizing one area at the expense of another.
Availability and service-level metrics
Availability metrics show whether inventory is supporting customer demand as expected. These are the KPIs operations teams monitor to prevent missed orders and service failures.
Key Metrics (KPIs)
- In-stock rate: The percentage of SKUs or locations with available inventory when needed. This indicates baseline product availability.
- Fill rate: The percentage of customer demand fulfilled immediately from available stock. This connects inventory directly to service performance.
- Backorder rate: The share of orders or order lines delayed due to insufficient stock. A rising backorder rate often signals replenishment or forecasting issues.
- Stockout frequency: How often a SKU or location runs out of stock within a period. This helps identify recurring supply risk.
- Order service level: The percentage of orders delivered in full and on time. This is a practical measure of how well inventory supports fulfillment.
- Safety stock breach rate: The frequency with which inventory falls below planned buffer levels. This highlights where risk tolerance is being exceeded.
These metrics matter because customer service outcomes are often inventory outcomes in disguise. If fill rate drops or backorders rise, the issue may be supplier reliability, forecast bias, poor allocation, or delayed internal data. Reporting must expose those links quickly.
Inventory productivity and cost metrics
These metrics show how efficiently the business converts inventory into revenue and how much capital is being consumed in the process.
Key Metrics (KPIs)
- Inventory turnover: How many times inventory is sold and replaced in a period. Higher turnover generally indicates healthier inventory flow.
- Days on hand: The average number of days inventory remains before being sold or used. This helps quantify capital lockup.
- Carrying cost: The total cost of holding inventory, including storage, insurance, obsolescence, and capital cost. This reveals the true burden of excess stock.
- Aging inventory: Inventory grouped by how long it has been in stock, such as 0–30, 31–60, 61–90, or 90+ days. This helps identify dormant or risky stock.
- Dead stock value: The value of inventory with little or no movement over a defined period. This is often one of the clearest indicators of hidden waste.
- Gross margin at risk: Margin exposure tied to markdown-prone, aging, or overstocked products. This helps connect inventory to profitability.
These KPIs show where working capital is trapped and where margin is leaking. A business can appear well-stocked on the surface while carrying too much low-yield inventory underneath. Productivity reporting makes that visible.
Accuracy and control metrics
No inventory reporting framework is trustworthy unless the underlying records are accurate and timely. Control metrics establish whether teams can rely on the numbers before taking action.
Key Metrics (KPIs)
- Cycle count accuracy: The percentage match between system inventory and physical counts. This measures baseline inventory record reliability.
- Shrinkage rate: Inventory loss caused by theft, damage, spoilage, or administrative error. This directly impacts margin.
- Adjustment rate: The frequency or value of manual corrections made to inventory records. A high rate often points to upstream process weaknesses.
- Data latency: The time gap between a physical transaction and its reflection in reporting. Low latency is essential for fast-moving operations.
- Transaction error rate: The percentage of receiving, picking, transfers, or returns recorded incorrectly. This shows where process discipline is breaking down.
- Location accuracy: The percentage of stock stored in the correct bin, warehouse, or location in the system. This supports efficient fulfillment and counting.
If cycle count accuracy is poor or data updates lag by several hours, decision-makers may be working with false certainty. Enterprises should improve reporting trust before scaling KPI-driven interventions.
The core inventory reports every enterprise team should use
A KPI framework becomes useful only when translated into repeatable reports. Enterprise inventory reporting should combine operational control reports with financial and strategic reports, each mapped to specific decisions.
Operational reports for day-to-day control
Operational reports help teams detect issues early and act before service or cost problems escalate.
The most important day-to-day reports include:
- Stock status report: Shows on-hand, available, committed, inbound, and at-risk inventory by SKU and location
- Reorder report: Flags items approaching reorder points based on demand, lead time, and safety stock logic
- Exception report: Highlights stockouts, negative inventory, abnormal adjustments, delayed receipts, and urgent replenishment risks
- Warehouse movement report: Tracks transfers, receipts, picks, returns, and bin-level movements to support execution control
These reports should be refreshed frequently and designed for action, not just observation. Warehouse and planning teams need prioritized exceptions, not static tables with hundreds of rows and no escalation logic.
Financial and strategic reports for planning
Financial and strategic reports help leadership assess inventory as a capital and profitability lever, not just an operational variable.
Core enterprise reports include:
- Inventory valuation report: Summarizes inventory value at a point in time by SKU, category, location, or business unit
- Aging report: Identifies slow-moving and obsolete inventory by age bucket
- Turnover report: Shows how quickly inventory moves across product lines, regions, or channels
- Dead stock report: Isolates non-moving items consuming working capital and storage space
- Margin impact report: Links inventory performance to markdown exposure, service failures, emergency replenishment costs, and gross margin pressure
These reports are essential for S&OP, budgeting, procurement reviews, and executive decision-making. They create a common language between operations and finance.
How to choose the right report for the question being asked
The best inventory reporting environments are built around decisions. Start with the business question, then choose the report that supports it.
Examples include:
- Replenishment decision: Use stock status, reorder, and supplier lead-time reports
- Purchasing decision: Use forecast consumption, days on hand, and aging reports
- Pricing decision: Use dead stock, margin impact, and inventory aging reports
- Network allocation decision: Use location-level stock status, demand velocity, and transfer activity reports
This approach prevents report sprawl. Instead of generating dozens of dashboards that no one uses, build a focused reporting layer where every output supports a real business action.
How inventory reports drive informed decision-making across teams
Inventory reporting delivers the most value when each function can use the same data to solve different business problems. That is how reporting moves from passive visibility to active coordination.
For operations and supply chain teams
Operations and supply chain teams use inventory reporting to identify immediate execution risks and correct them quickly. Trend signals in fill rate, stockout frequency, and safety stock breaches can trigger replenishment actions before service levels collapse.
Typical actions include:
- Prioritize replenishment for high-velocity items with rising stockout risk
- Adjust safety stock where demand variability or supplier reliability has changed
- Escalate supplier follow-up when backorders or delayed receipts exceed thresholds
- Reallocate inventory across warehouses or channels to reduce imbalances
For finance and executive leadership
Finance leaders and executives use inventory reporting to balance service, working capital, and profitability. They need to know whether higher inventory investment is creating better service outcomes or simply increasing carrying cost and markdown risk.
Reporting helps leadership:
- Evaluate how much capital is tied up in aging or low-turn stock
- Track whether service-level gains justify inventory increases
- Identify categories where shrinkage, excess stock, or emergency freight are hurting margin
- Support quarterly planning, budgeting, and inventory reduction initiatives
At the executive level, inventory reporting should simplify trade-offs. Leadership needs a clear line of sight from stock decisions to balance sheet impact and customer outcomes.
For sales, merchandising, and procurement
Sales, merchandising, and procurement teams depend on inventory reporting to align demand plans and buying behavior with operational reality. Promotions fail when inventory is unavailable. Procurement overspends when reorder signals are inaccurate. Merchandising underperforms when aging stock is not surfaced in time.
Reporting supports these teams by helping them:
- Align promotions with actual stock readiness
- Reduce overbuying by reviewing aging and dead stock before placing new orders
- Improve assortment decisions using turnover and margin impact data
- Coordinate demand planning with operational constraints and lead-time realities
When these teams operate from shared inventory reporting, decision quality improves across the enterprise.
How to build your own inventory reporting system
Building an effective inventory reporting system requires governance as much as technology. The goal is not to create more dashboards. It is to create a repeatable decision framework.
Start with business goals and reporting users
Begin by defining the decisions the reporting system must support. That means identifying the user groups, their operating rhythms, and the KPIs they own.
As a practical implementation approach:
- Define the business outcomes you want to improve, such as reducing stockouts, lowering days on hand, or increasing cycle count accuracy
- Map users to decisions, including planners, warehouse managers, finance analysts, procurement leads, and executives
- Assign KPI ownership so every critical metric has a responsible owner
- Set action thresholds that determine when exceptions require intervention
This prevents the common mistake of building reports that are technically correct but operationally irrelevant.
Standardize data sources, definitions, and refresh cadence
Most inventory reporting problems are actually data definition problems. If teams disagree on what counts as available stock, lead time, or backorder status, the reports will never drive aligned action.
Standardization should cover:
- Data sources: ERP, WMS, procurement systems, POS, ecommerce channels, and spreadsheets that still hold critical inputs
- Definitions: SKU, location, available-to-promise, committed stock, aging bucket logic, safety stock, and replenishment status
- Refresh cadence: Real-time, hourly, daily, or weekly depending on the business process
- Master data governance: Naming, hierarchy, and category consistency across systems
Consistency is the foundation of trust. Without it, every meeting becomes a debate about data rather than a decision about action.
Design dashboards, exceptions, and review routines
Good inventory reporting design balances simplicity with drill-down capability. Executives need summaries. Analysts need root-cause detail. Frontline teams need alerts and priorities.
A strong design model includes:
- Summary KPI dashboards for enterprise visibility
- Drill-down analysis by SKU, location, supplier, or category
- Exception views that isolate urgent risks
- Escalation thresholds for stockouts, aging, shrinkage, and late receipts
- Review routines such as daily control meetings, weekly inventory reviews, and monthly executive performance checks
This is where reporting becomes operational muscle rather than passive monitoring.
Evaluate tools and ERP reporting options
Enterprises should evaluate reporting options based on scale, flexibility, and speed to insight. Built-in ERP reports may be useful for baseline visibility, but they often struggle with customization, dashboard usability, and cross-functional distribution.
Typical options include:
- ERP-native reporting: Good for standard transaction outputs and core snapshots
- BI platforms: Better for flexible modeling, visualization, and cross-source analysis
- Warehouse-level views: Useful for execution detail and operational exceptions
- Dedicated reporting platforms: Best when the goal is to standardize templates, automate delivery, and enable self-service analysis at scale
The right tool should reduce manual preparation, improve trust in inventory data, and make reporting easier to consume for every stakeholder.
Common mistakes to avoid and the next steps to improve reporting
Many enterprises damage inventory reporting effectiveness not by tracking too little, but by tracking too much without clarity on ownership or action.
Common mistakes include:
- Too many metrics with no thresholds: If every KPI is important, none of them is actionable
- No clear owners: Reports without accountability do not change outcomes
- Poor data quality: Inaccurate counts and inconsistent status logic destroy trust
- Delayed updates: Stale data causes teams to respond after the problem has already escalated
- Disconnected department goals: Operations may pursue service levels while finance pushes inventory reduction without a shared trade-off framework
- Overreliance on spreadsheets: Manual consolidation slows reporting, increases errors, and makes scaling difficult
A better path is to start small and build discipline. Focus first on a concise KPI set, such as in-stock rate, fill rate, turnover, days on hand, cycle count accuracy, and aging inventory. Review those metrics regularly, define action thresholds, and expand the report set only when teams are consistently making better decisions from the data.
Build inventory reporting faster with FineReport
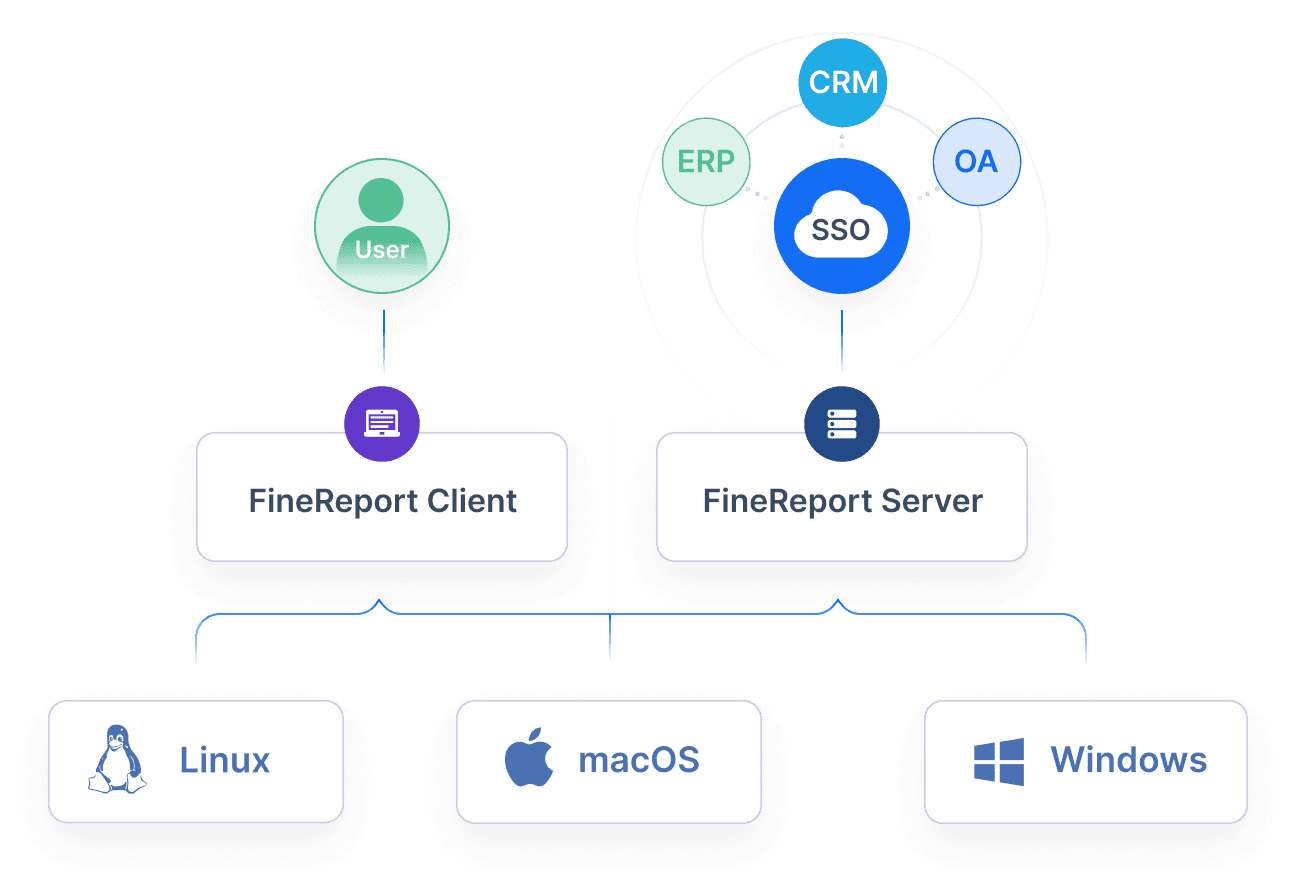
Building this manually is complex; use FineReport to utilize ready-made templates and automate this entire workflow. For enterprise teams, the real challenge is not just creating an inventory dashboard once. It is maintaining a reporting system that integrates ERP and warehouse data, refreshes on schedule, supports drill-down analysis, and delivers role-based views for operations, finance, procurement, and leadership.
FineReport helps organizations operationalize inventory reporting with:
- Ready-made dashboard templates for KPI tracking, stock analysis, and executive reporting
- Flexible data integration across ERP, WMS, databases, and business systems
- Automated report distribution to reduce manual spreadsheet work
- Interactive drill-down dashboards for SKU, warehouse, supplier, and category analysis
- Pixel-perfect enterprise reports for operational reviews and leadership presentations
After the KPI framework is defined, FineReport becomes the execution layer that helps scale it reliably across the business.

Get Ready-to-Use Dashboard Templates in Fine Gallery
If your current inventory reporting still depends on manual exports, inconsistent definitions, or static spreadsheets, this is the right time to redesign it around a KPI-led operating model. Start with a focused metric set, align reports to decisions, automate distribution, and give each team a shared source of truth.
FAQs
Inventory reporting organizes stock data into usable views so teams can track availability, inventory value, movement, and risk. It matters because it helps prevent stockouts, reduce excess inventory, and protect margin through faster, better decisions.
Start with a balanced set of KPIs that covers service, productivity, and control, such as in-stock rate, fill rate, inventory turnover, days on hand, aging inventory, and shrinkage. These measures show whether inventory is supporting demand without tying up too much cash.
Reporting frequency depends on sales volume and operational complexity, but high-velocity businesses often need daily or near real-time updates. Slower-moving environments may review some reports weekly while still monitoring critical exceptions more frequently.
Good reporting highlights low-stock risks, safety stock breaches, slow-moving items, and demand trends before they become costly problems. That visibility helps teams adjust reorder points, purchasing, and allocation earlier.
A useful inventory report should include SKU, location, quantity on hand, demand or sales movement, inventory value, aging, and replenishment status. Many teams also add backorders, supplier performance, and margin-related metrics for better decision-making.


The Author
Yida Yin
FanRuan Industry Solutions Expert
Related Articles

Best Oil and Gas Production Reporting Software in 2026: 7 Tools Compared for Operators
$1 is an $1 and dashboard platform that helps oil and gas teams turn production, operations, and business data into governed, shareable reports and real time $1. Best oil and gas production reporting software in 2026 at
Yida Yin
Jun 24, 2026

Environmental Social and Governance Reporting: A Step-by-Step Guide to Building an ESG Reporting Dashboard
Environmental social and governance reporting is no longer a side project for sustainability teams. It is now a management discipline that affects investor confidence, regulatory readiness, capital access, brand trust, a
Yida Yin
Jun 23, 2026

ESG Reporting Process: A 7-Step Operating Model for Cross-Functional Teams
The $1 process is no longer a year end publishing task. It is an operating model for collecting decision useful data, coordinating multiple business functions, maintaining control over disclosures, and producing reports
Yida Yin
Jun 23, 2026