You use management information systems, or MIS tools, to organize your data and turn it into smart decisions. These tools help you see the big picture and respond quickly to what your business needs. Today, AI and automation change the game. The following list highlights the best mis tools for organizations seeking to see the big picture, leverage intelligent automation, and respond quickly to business needs.
What Are MIS Tools?
MIS Tools in Organizations
You probably hear a lot about data these days. But what do you actually do with all that information? That’s where MIS tools come in. Management Information Systems (MIS) tools help you collect, organize, and use data to run your business better. These tools act like the brain of your organization, turning numbers and facts into smart actions.
Here’s how MIS tools make a difference in your daily work:
Enhanced Decision-Making: You get clear insights that help you make better choices.
Improved Efficiency and Productivity: You can automate boring tasks and cut down on mistakes.
Better Strategic Planning: You spot trends early and plan for the future.
Enhanced Communication and Collaboration: You share information easily across teams.
Data-Driven Decision Support: You use real data, not just guesses, to guide your next steps.
Risk Management and Compliance: You catch problems early and stay on top of rules.
Competitive Advantage: You move faster than your competitors and adapt to changes quickly.
MIS tools give you the power to see what’s happening in your business and act fast.
Role in Business Intelligence
MIS tools do more than just store data. They help you turn raw numbers into useful information. This is the heart of business intelligence. You can track sales, watch customer behavior, and spot market trends in real time. That means you can adjust your strategy before problems grow.
Here’s a quick look at how MIS tools boost business intelligence and decision-making:
Contribution of MIS to Business Intelligence and Decision-Making
Description
Accurate and Timely Data
MIS gives you real-time updates on sales, customers, and trends so you can act fast.
Streamlining Operations
You connect different parts of your business, cut out extra steps, and speed up work.
Advanced Data Analysis
You use smart tools to find patterns and predict what might happen next.
MIS tools also help you spot new opportunities and avoid risks. You can automate routine jobs, which frees up your time for bigger ideas. When you bring data from different sources together, you get a full picture of your business.
Tip: Use MIS tools to focus on what matters most. Let the system handle the details while you drive the big decisions.
Trends in Management Information Systems in 2026
The world of MIS keeps changing. In 2026, you’ll see even more exciting features. Flexibility will be key. You can pick the workflow that fits your team, whether you like Scrum, Kanban, or something else. Unified dashboards will let everyone—from engineers to business leaders—see the same data and make smarter choices together.
Integration will get easier, too. You’ll connect your MIS tools with platforms like GitHub or CI/CD pipelines. This means less manual work and smoother operations. Resource management will help you balance workloads and avoid burnout. You’ll also see tools that link every part of your business, making sure your daily work matches your big goals.
Stay ready for these trends. They’ll help you work smarter, not harder, and keep your business ahead of the curve.
How We Selected the Best MIS Tools
This list is not a random compilation. Each tool was evaluated against six factors that matter for real-world MIS deployments:
Evaluation Factor
Why It Matters
Reporting depth
MIS tools must support recurring, structured, and management-ready reports
Dashboard capability
Managers need visual KPI tracking, not only static tables
MIS depends on ERP, CRM, finance, HR, and operations data
Automation
Scheduled reports and alerts reduce manual reporting work
Governance
Permissions, KPI definitions, and auditability matter for enterprise use
AI readiness
Modern MIS should support summaries, anomaly alerts, and decision follow-up
Tools that excel in only one dimension (e.g., visualization without integration, or automation without governance) were included but noted with limitations. The goal is to help you match tools to your specific MIS requirements, not to declare a universal winner.
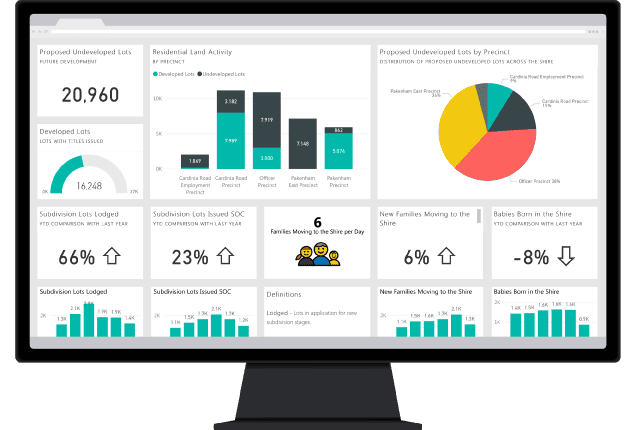
Pros: Low entry cost (free Desktop version), massive community and learning resources, seamless integration with Excel, Teams, and SharePoint, strong AI capabilities with Copilot.
Cons: Complex licensing (Pro vs. Premium vs. Fabric capacity), DAX learning curve for advanced calculations, limited pixel-perfect formatted reporting, performance degrades with very large datasets without premium capacity.
Ideal users: Mid-to-large organizations using Microsoft 365 that need self-service analytics and interactive dashboards.
Pricing: Power BI Desktop free; Pro ~$10/user/month; Premium ~$20/user/month or $4,995/capacity/month for large organizations.
Best for: Large enterprises running SAP ERP that need centralized, compliance-grade reporting and analytics.
Key features include:
Centralized report management
Advanced analytics and dashboards
Integration with SAP ERP and other systems
Role-based access and permissions
Scheduling and automated distribution
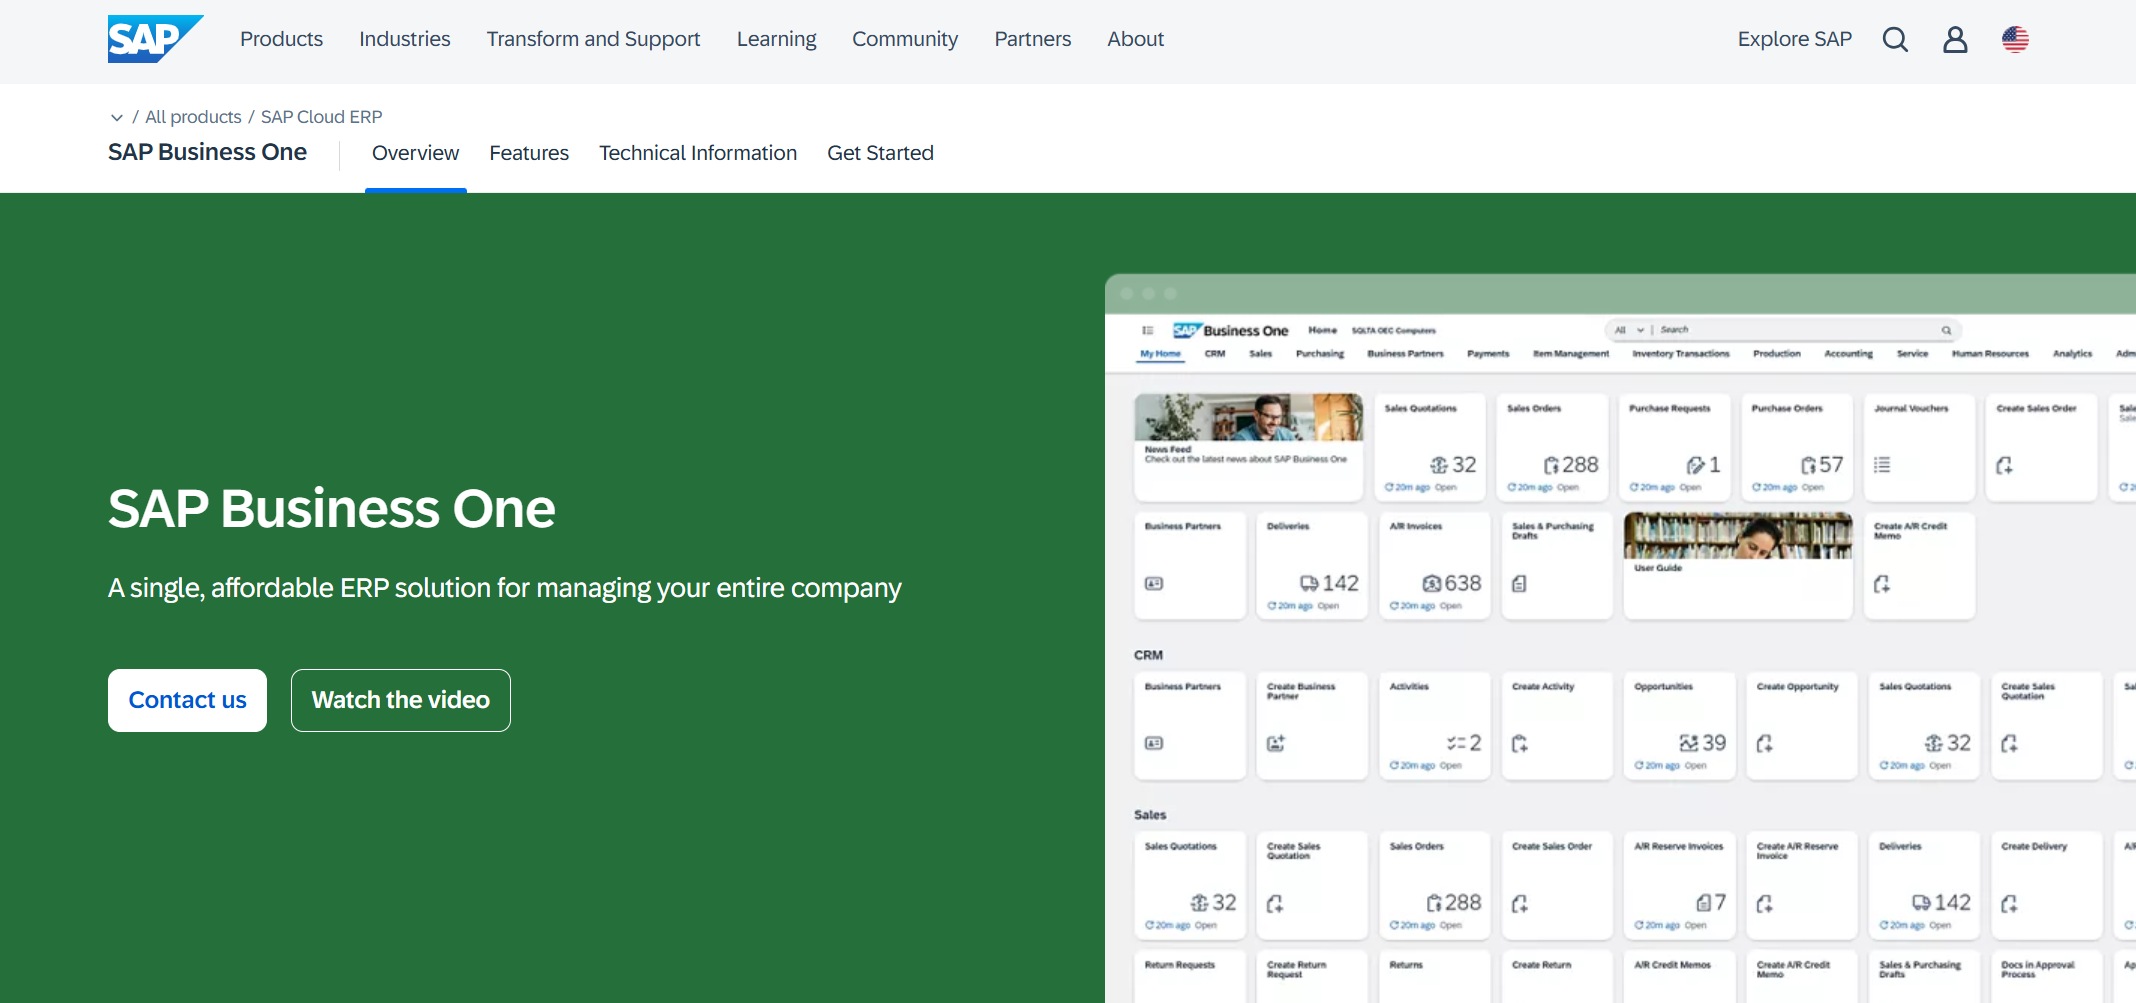
Pros: Deep SAP ecosystem integration, enterprise-grade security and compliance, handles complex multi-source reporting at scale, mature platform with decades of deployment history.
Cons: High total cost of ownership, steep learning curve, aging UI compared to modern BI tools, requires specialized SAP expertise to administer.
Ideal users: Large enterprises in regulated industries (pharma, finance, manufacturing) already running SAP infrastructure.
Pricing: Custom quote based on users, modules, and deployment model.
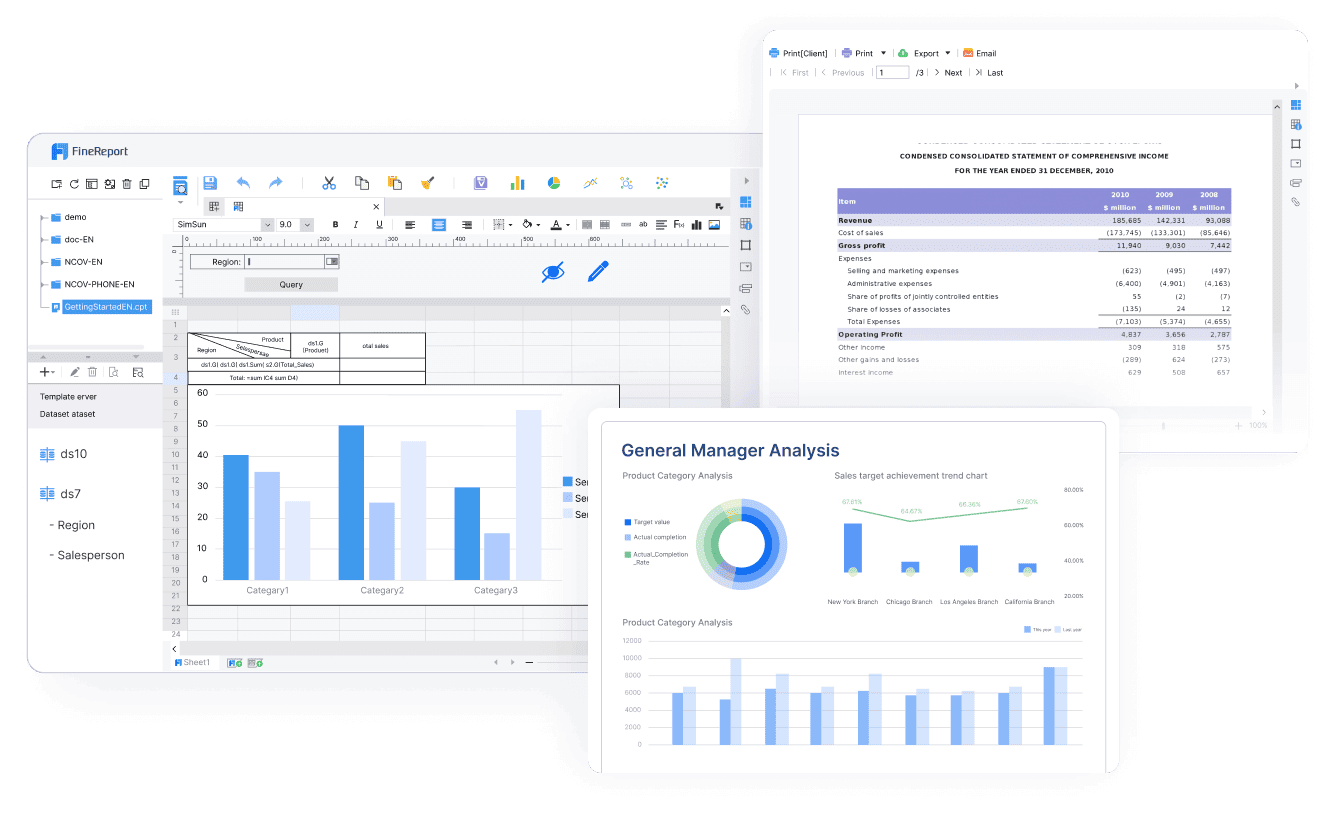
You can customize every report to fit your business needs. FineReport supports both standard and complex reporting scenarios, making it a great fit for any organization.
Pros: Pixel-perfect formatted reports that match exact business requirements, true multi-source integration without separate ETL, built-in data entry for write-back workflows, flexible perpetual or subscription licensing, strong China and APAC market presence with growing global adoption.
Cons: Less emphasis on self-service exploration compared to pure-play BI tools, smaller English-language community than Power BI or Tableau, 3D dashboard features require additional configuration.
Ideal users: Enterprises that need scheduled, formatted MIS reports connected to multiple business systems, especially in manufacturing, finance, and operations-heavy industries.
FineReport is especially useful when MIS reports must be generated regularly, distributed to managers, and connected to multiple business systems. For teams exploring enterprise reporting at scale, it bridges the gap between spreadsheet-based reporting and full BI platforms.
Pricing: Flexible licensing (perpetual or subscription); custom quote based on users and deployment. Many organizations find FineReport cost-effective because it covers a wide range of software development management tools in one platform.
What Makes FineReport Stand Out
FineReport stands out for its user-friendly design and deep customization. You can create complex reports without coding. The drag-and-drop interface makes report building fast and easy. FineReport supports real-time data integration, so you always work with the latest information. The platform’s 3D dashboards and mobile BI features keep you connected anywhere.
Support for multi-language and multi-currency reporting
FineReport has earned recognition from Gartner and Forbes, and serves over 45,000 clients worldwide. Companies like BOE, Red Bull, and Omron use FineReport to drive digital transformation and boost efficiency. You get a trusted partner for your software development management tools needs.
Tip: FineReport helps you turn data into action. You can empower your team to make informed decisions and stay ahead in a fast-changing world.
Pros: Single platform for ERP + MIS eliminates integration overhead, strong financial reporting and compliance, cloud-native with automatic updates, scalable from mid-market to upper-mid-market.
Cons: Limited customization compared to dedicated BI tools, reporting flexibility constrained by NetSuite's data model, higher cost than standalone MIS tools, implementation requires certified partners.
Ideal users: Mid-market companies that want ERP and MIS in one platform and do not need deep custom reporting.
Pricing: Subscription-based; custom quote depending on modules and user count.
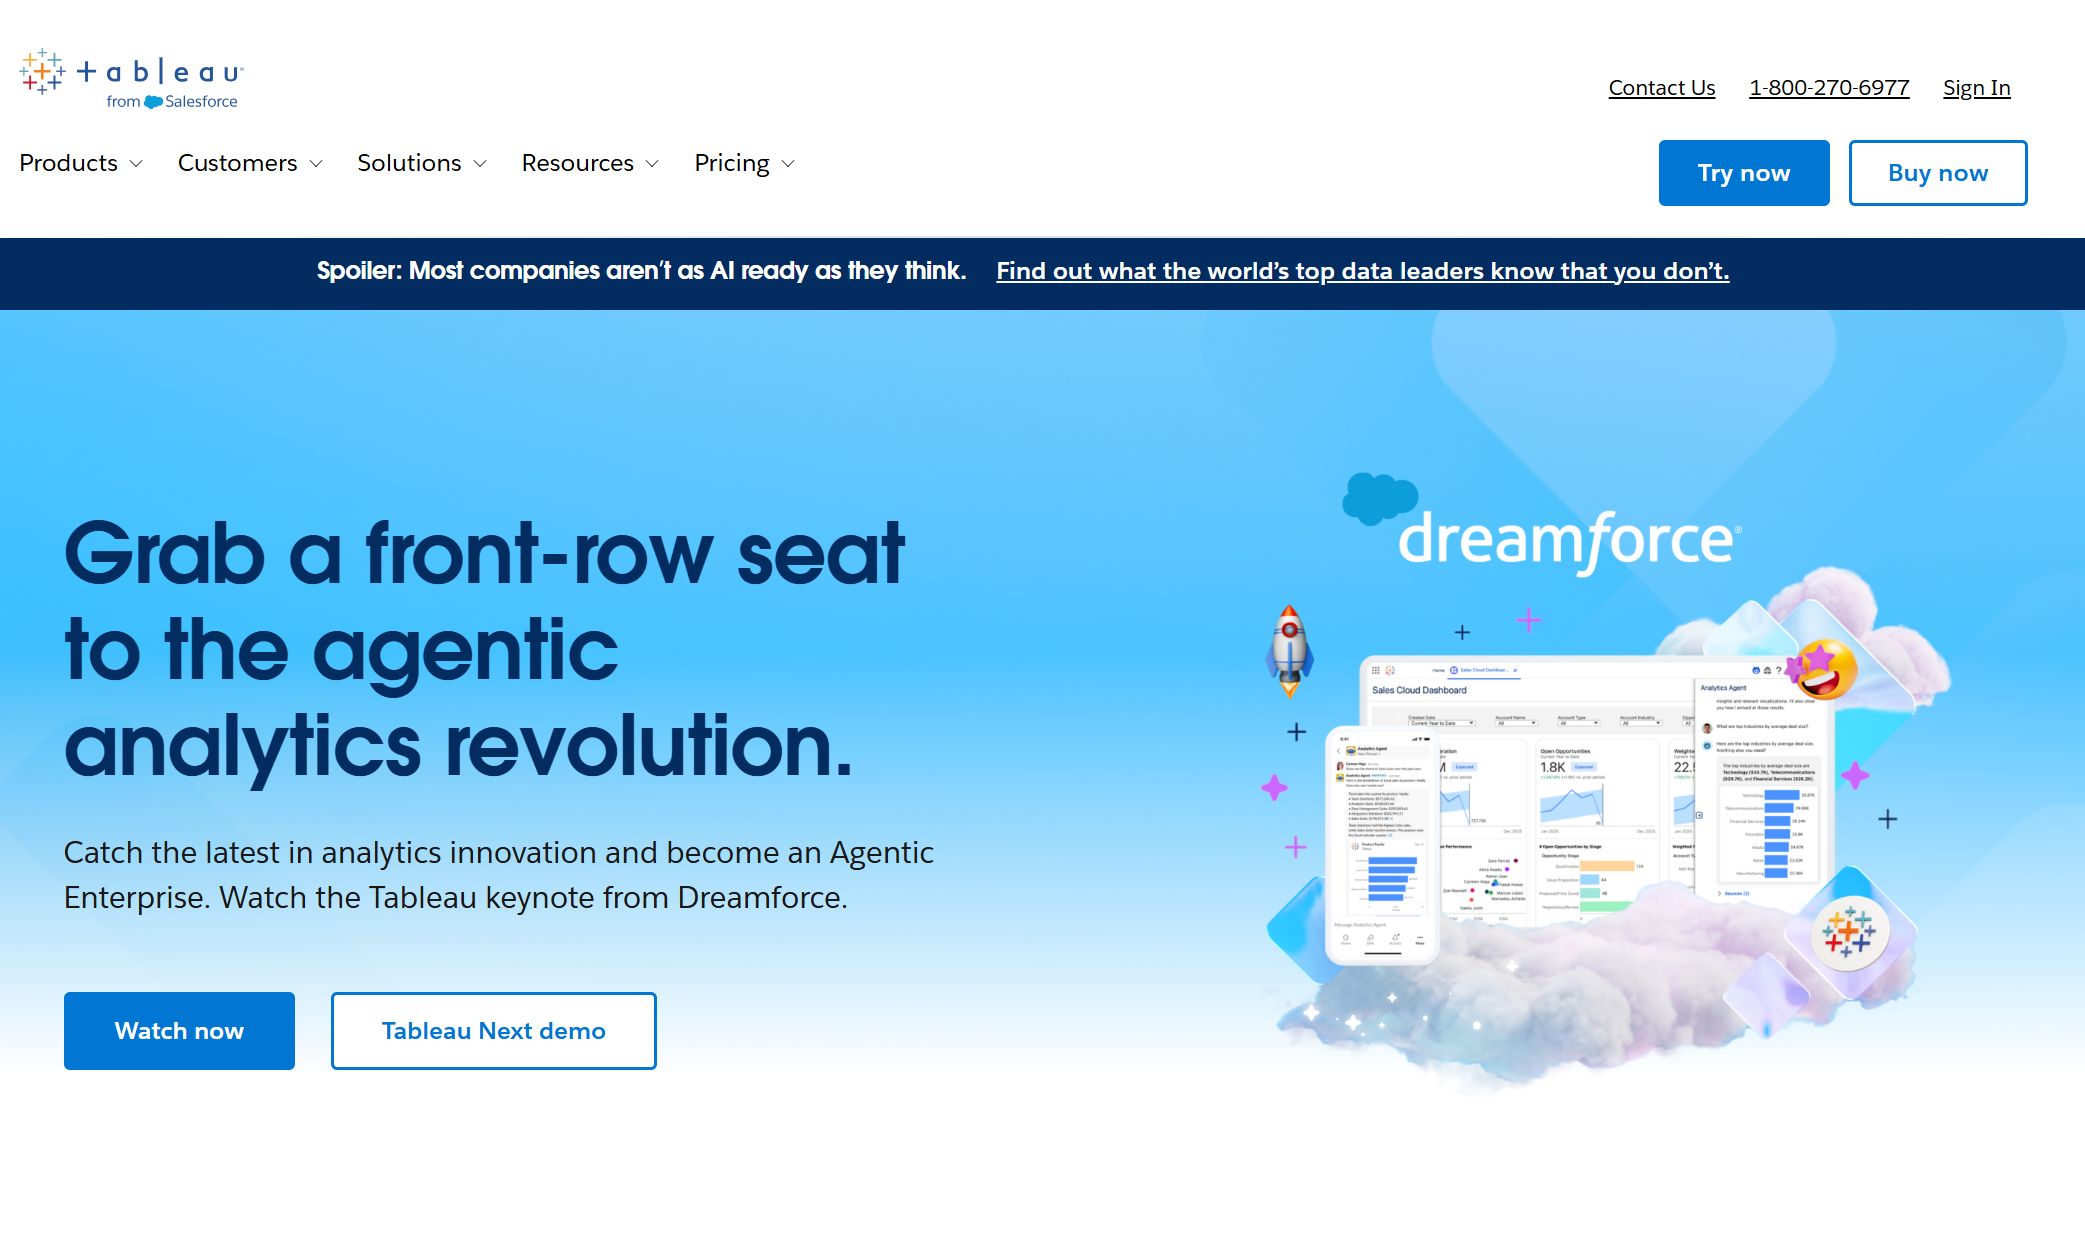
You do not need to be a data expert to use Tableau. The interface feels simple and friendly. You can share dashboards with your team or publish them online.
Pros: Unmatched visualization quality and flexibility, strong data exploration capabilities, large community and marketplace of extensions, integrates with Salesforce ecosystem.
Cons: Expensive at scale (Creator + Explorer + Viewer licensing adds up), limited native formatted/paginated reporting, data preparation can be complex, governance requires Tableau Server or Cloud investment.
Ideal users: Analytics-first organizations where visual exploration matters more than formatted operational reporting.
Pricing: Creator $75/user/month, Explorer $42/user/month, Viewer $15/user/month (annual billing).
You can set up dashboards that refresh automatically. Your team always sees up-to-date KPIs as new data comes in.
Pros: Affordable pricing, tight integration with Zoho CRM/Books/Desk, easy onboarding for non-technical users, good balance of features and simplicity.
Cons: Less capable for complex enterprise reporting, limited advanced data modeling, smaller third-party ecosystem, performance constraints with very large datasets.
Ideal users: SMBs already using Zoho products that need quick, affordable dashboards and reports.
Pricing: Basic $24/month (2 users); Standard $48/month (5 users); Professional $115/month (15 users); Enterprise $455/month (50 users).
Integration with many databases and cloud services
Automated report scheduling and distribution
Strong security and compliance controls
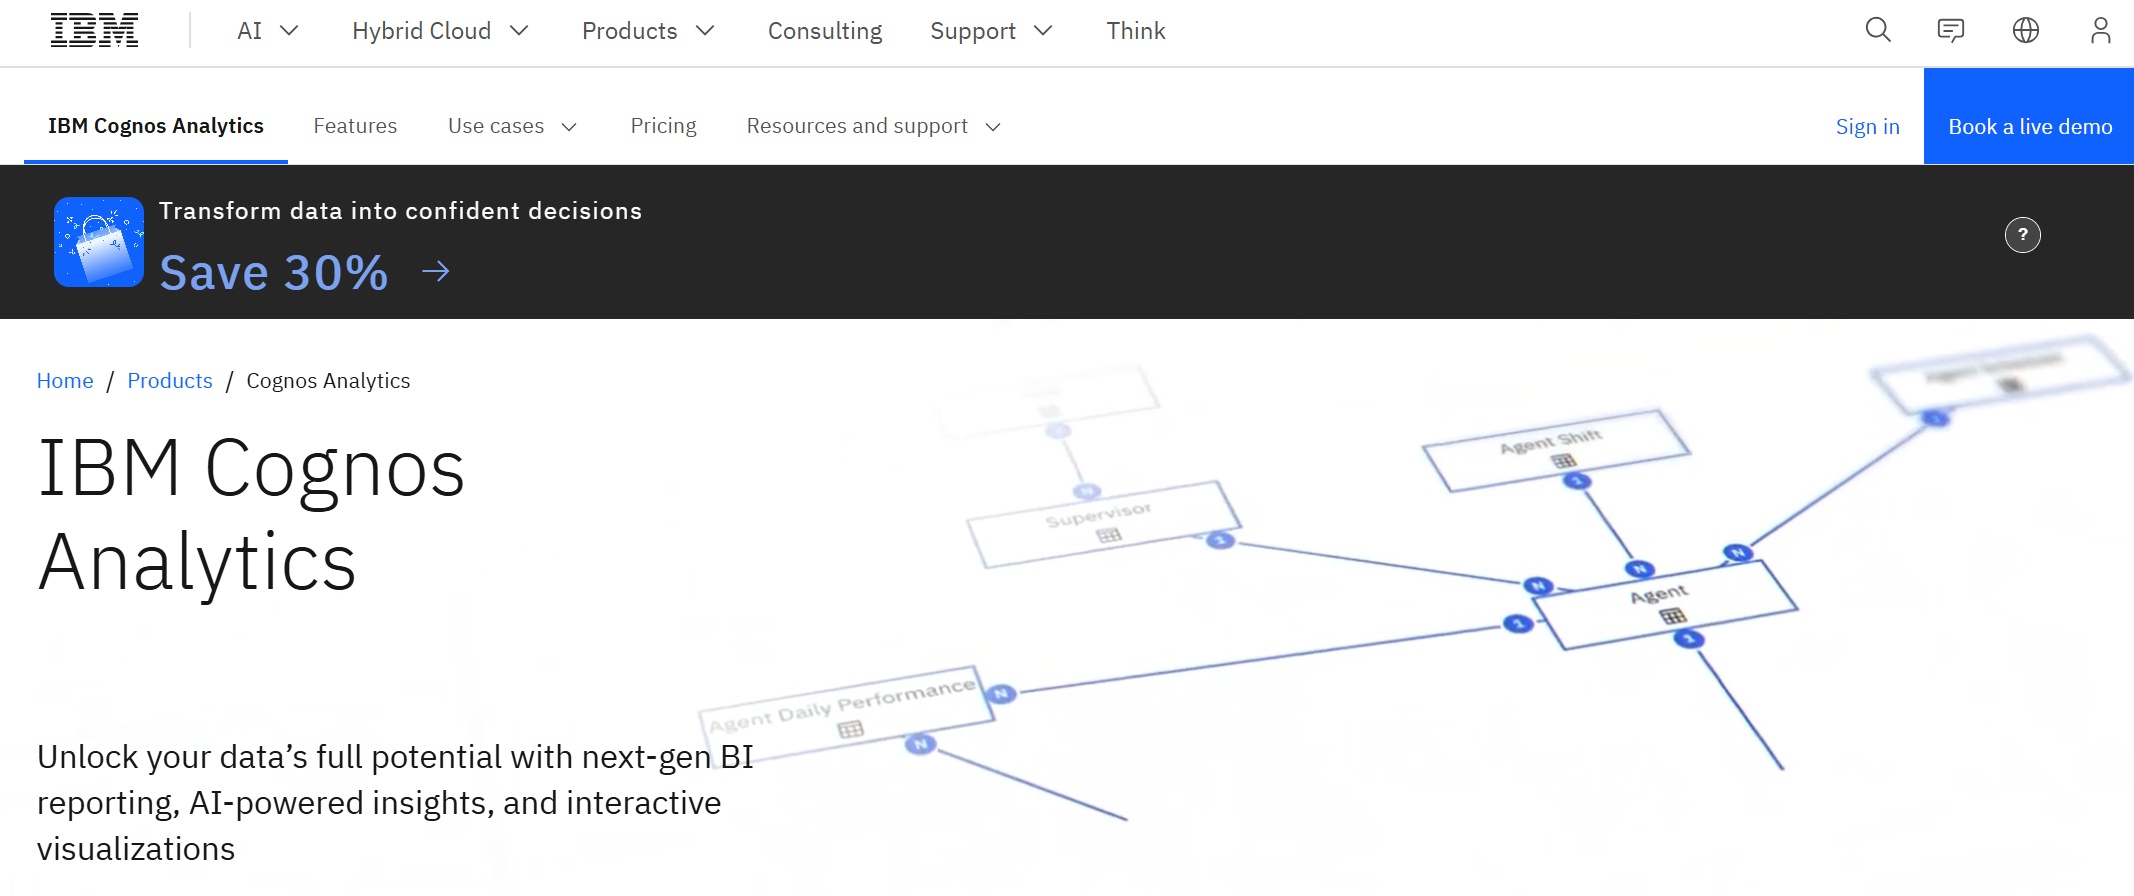
You can use Cognos Analytics even if you are not a data expert. The platform guides you with smart suggestions and easy-to-use tools.
Pros: Strong AI and cognitive capabilities, integrated planning module reduces tool sprawl, enterprise-grade governance and security, handles complex data models.
Cons: Steep learning curve, higher cost, smaller community than Power BI/Tableau, legacy perception despite modern updates.
Ideal users: Large enterprises in finance, insurance, and government that need governed BI with integrated planning.
Pricing: Custom quote; typically per-user or capacity-based licensing.
Get tailored insights that match your business needs.
Automate routine analysis so you can focus on strategy.
Integrate with Salesforce CRM for a seamless workflow.
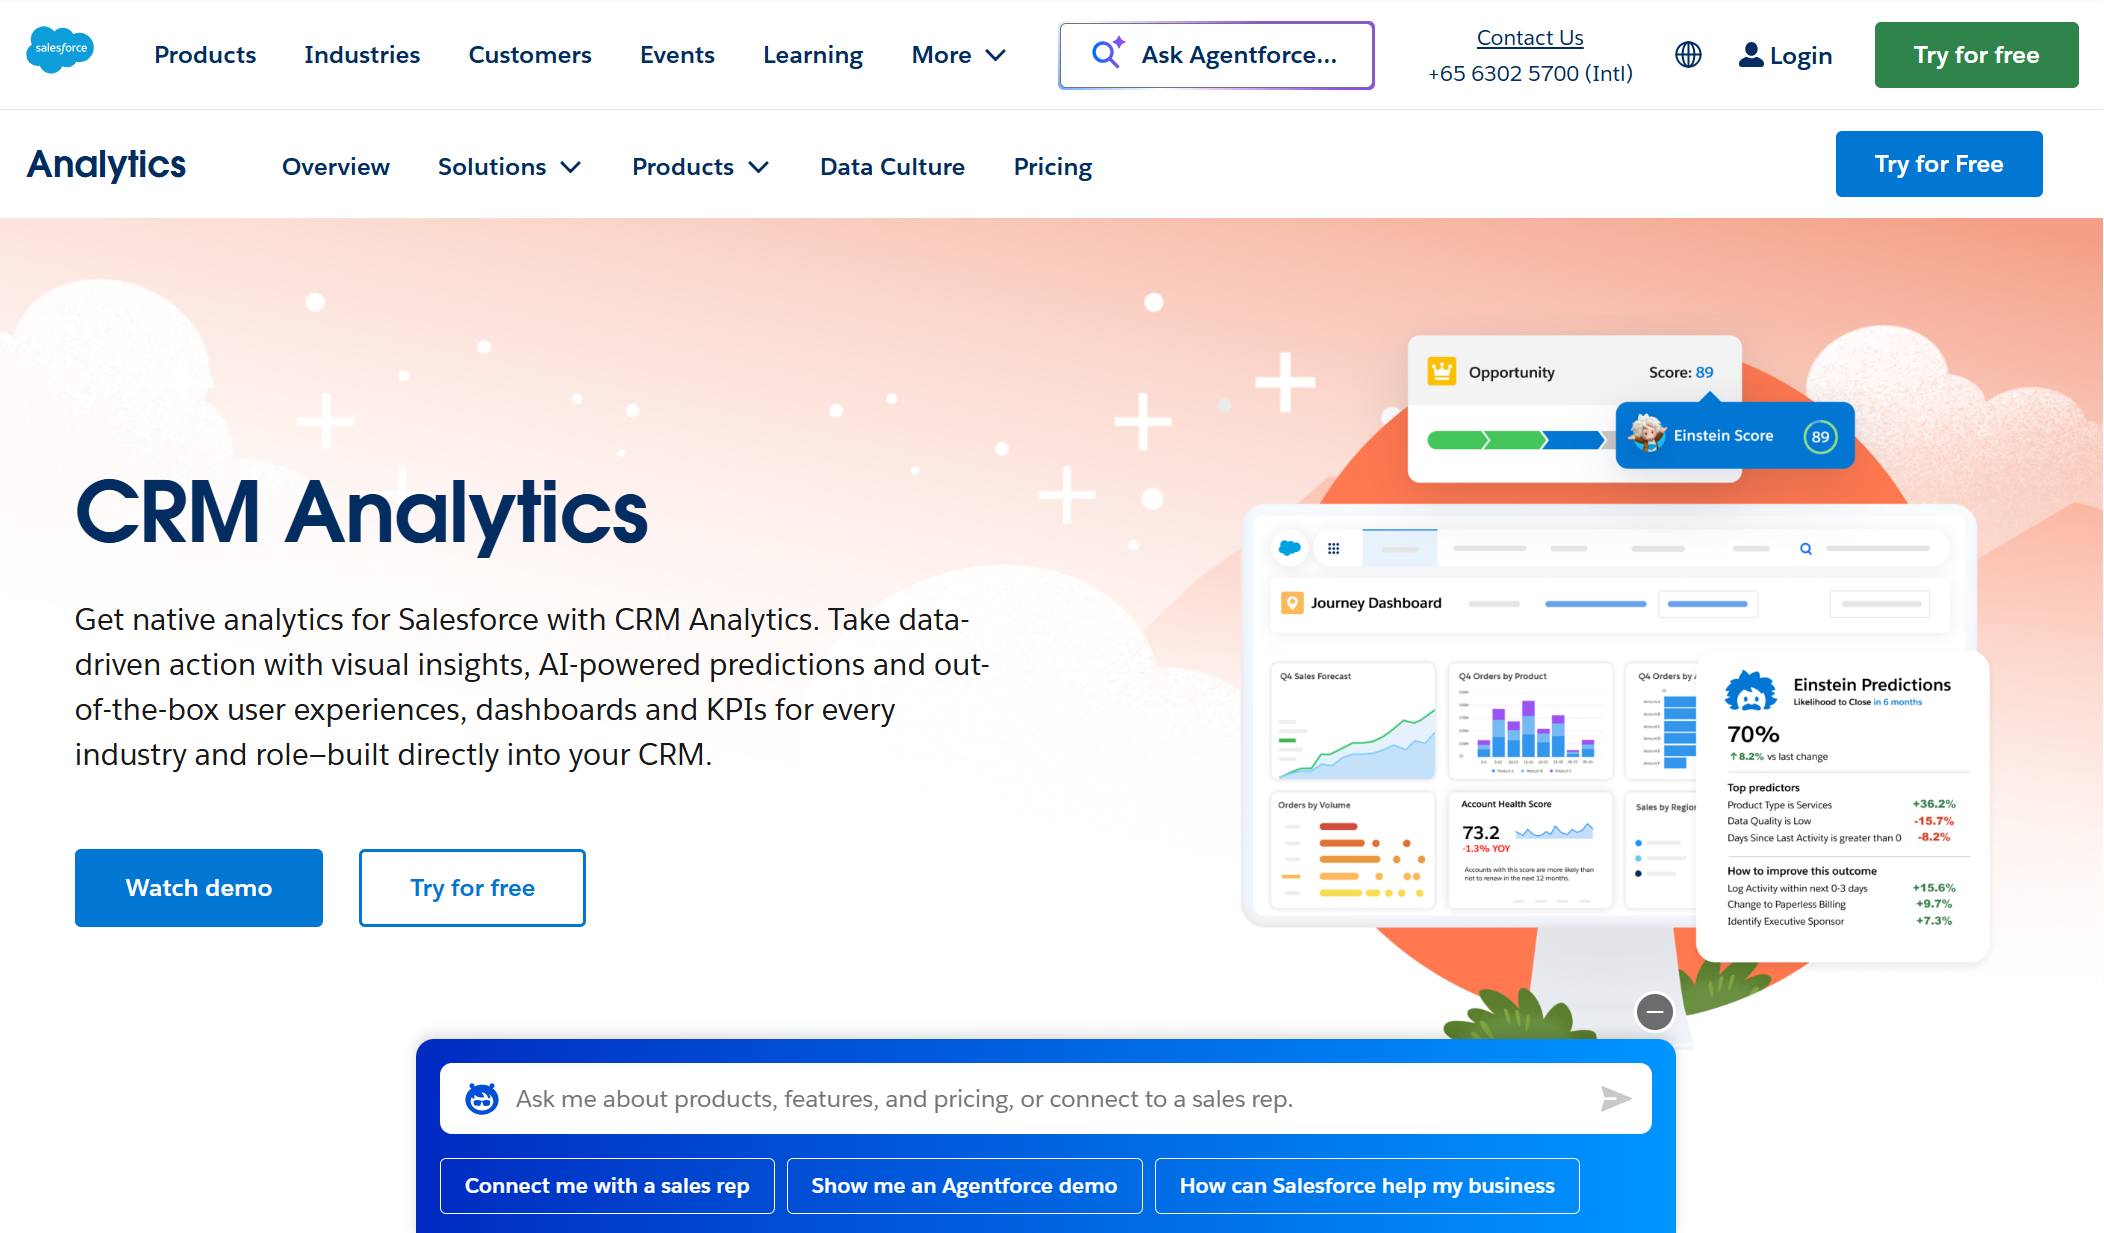
Einstein Analytics helps you make decisions based on facts, not just guesses.
Pros: Native Salesforce data access without extraction, AI insights contextualized within CRM records, actionable analytics embedded in sales/service workflows.
Cons: Primarily useful within Salesforce ecosystem, expensive add-on licensing, limited general-purpose MIS capability outside CRM, complex setup for non-Salesforce data.
Ideal users: Sales and service teams deeply embedded in Salesforce that need CRM-integrated analytics.
Pricing: Einstein Analytics Plus $75/user/month; bundled with certain Salesforce editions.
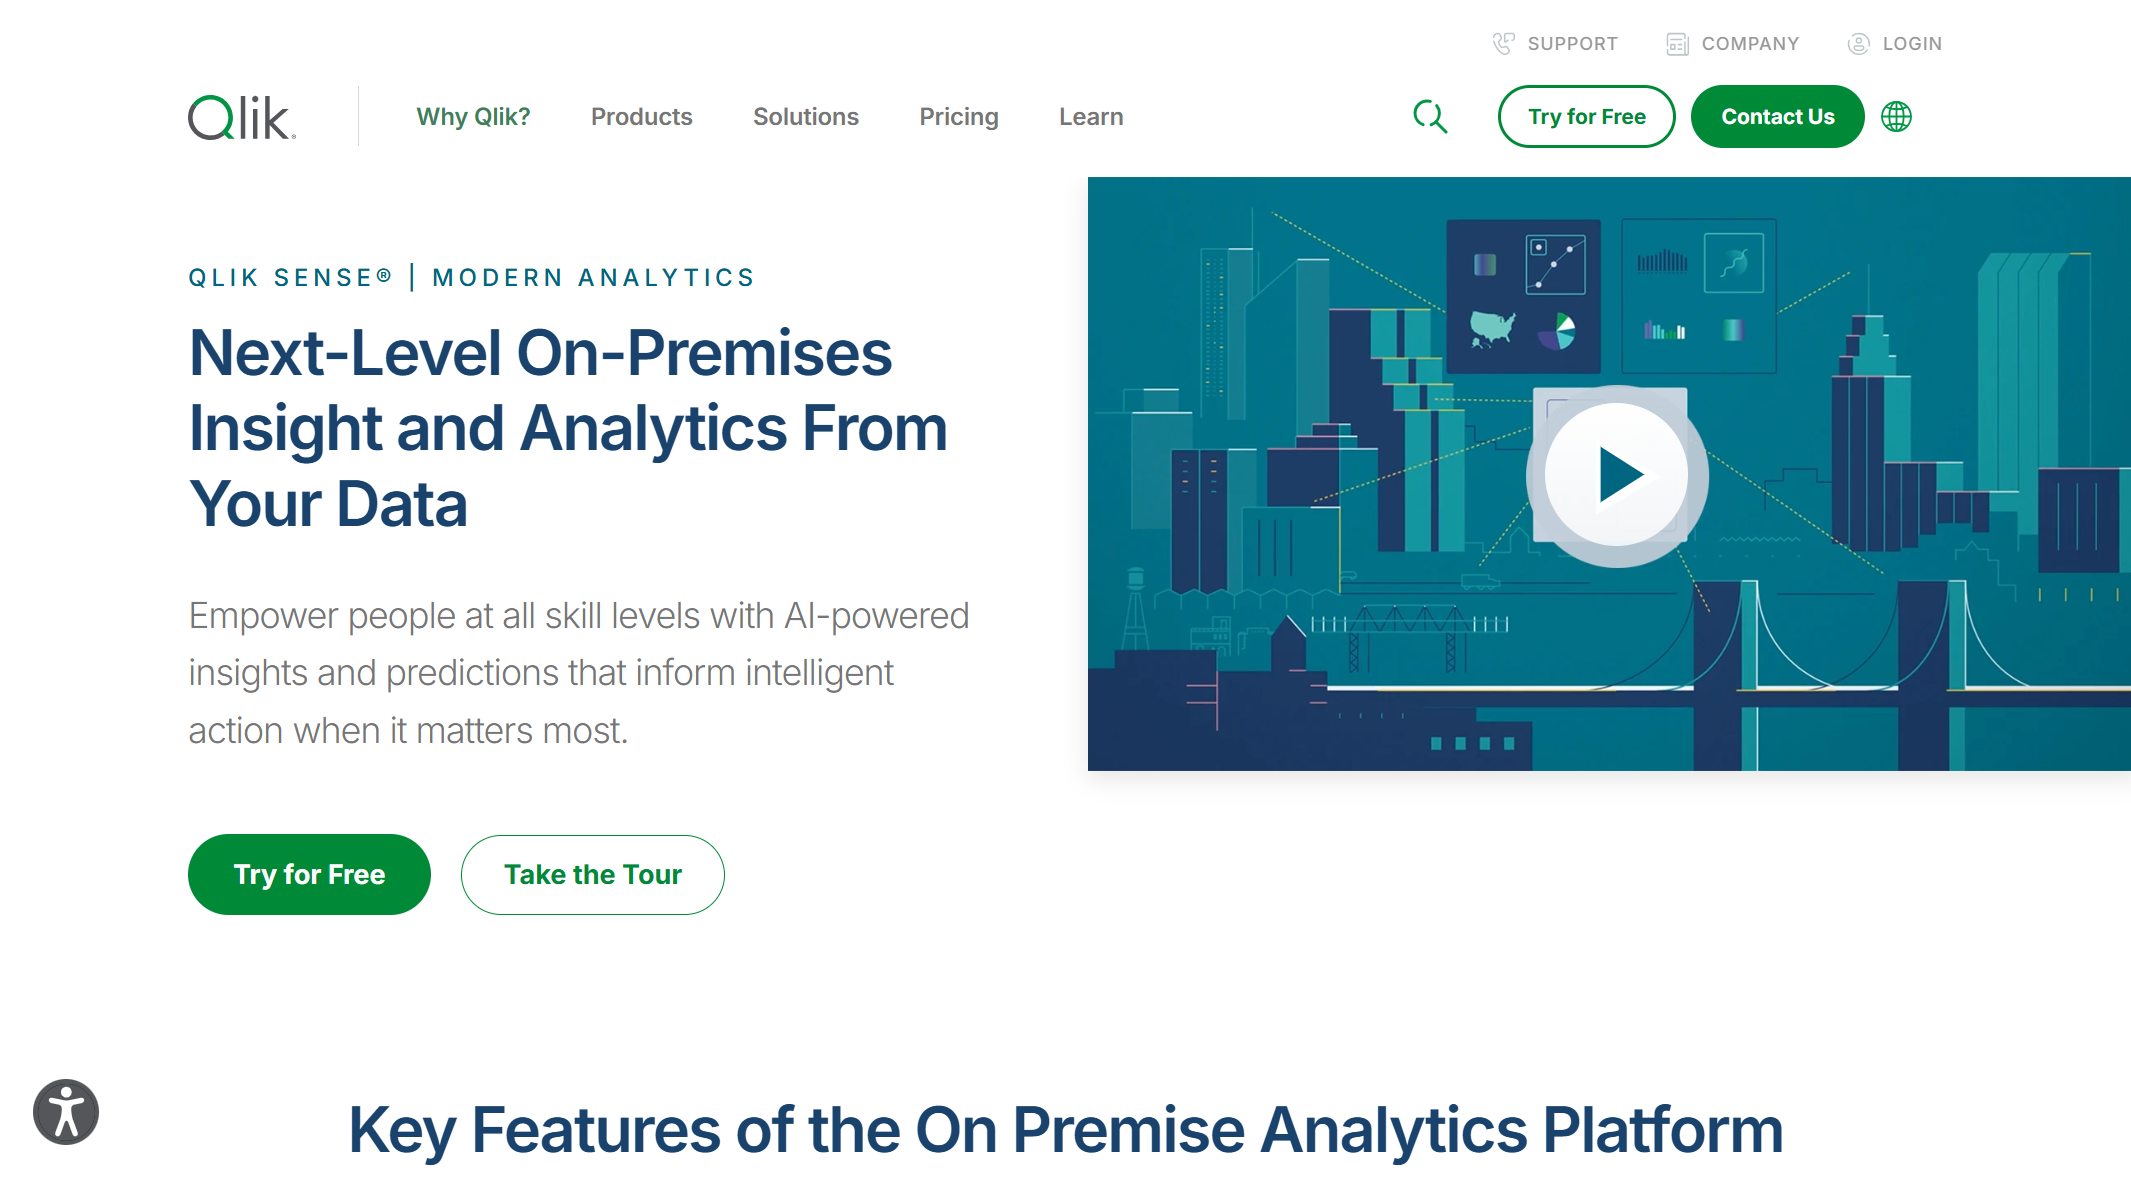
You don’t need to write code or rely on IT for every report. Qlik Sense makes analytics easy and flexible.
Pros: Unique associative model reveals hidden relationships, strong governance framework, flexible deployment (cloud, on-prem, hybrid), good for complex data discovery.
Cons: Learning curve for associative thinking model, smaller visualization library than Tableau, licensing complexity, less intuitive for simple reporting use cases.
Ideal users: Organizations where data discovery and finding hidden patterns matter more than pre-built formatted reports.
Pricing: Qlik Sense Business $30/user/month; Enterprise custom quote.
Best for: Executive-focused organizations wanting an all-in-one cloud BI platform with rapid deployment.
Key features include:
Pre-built connectors for fast data integration.
Visual ETL tools for easy data prep.
Real-time dashboards and alerts.
Customizable apps for unique business needs.
Mobile access to insights anytime, anywhere.
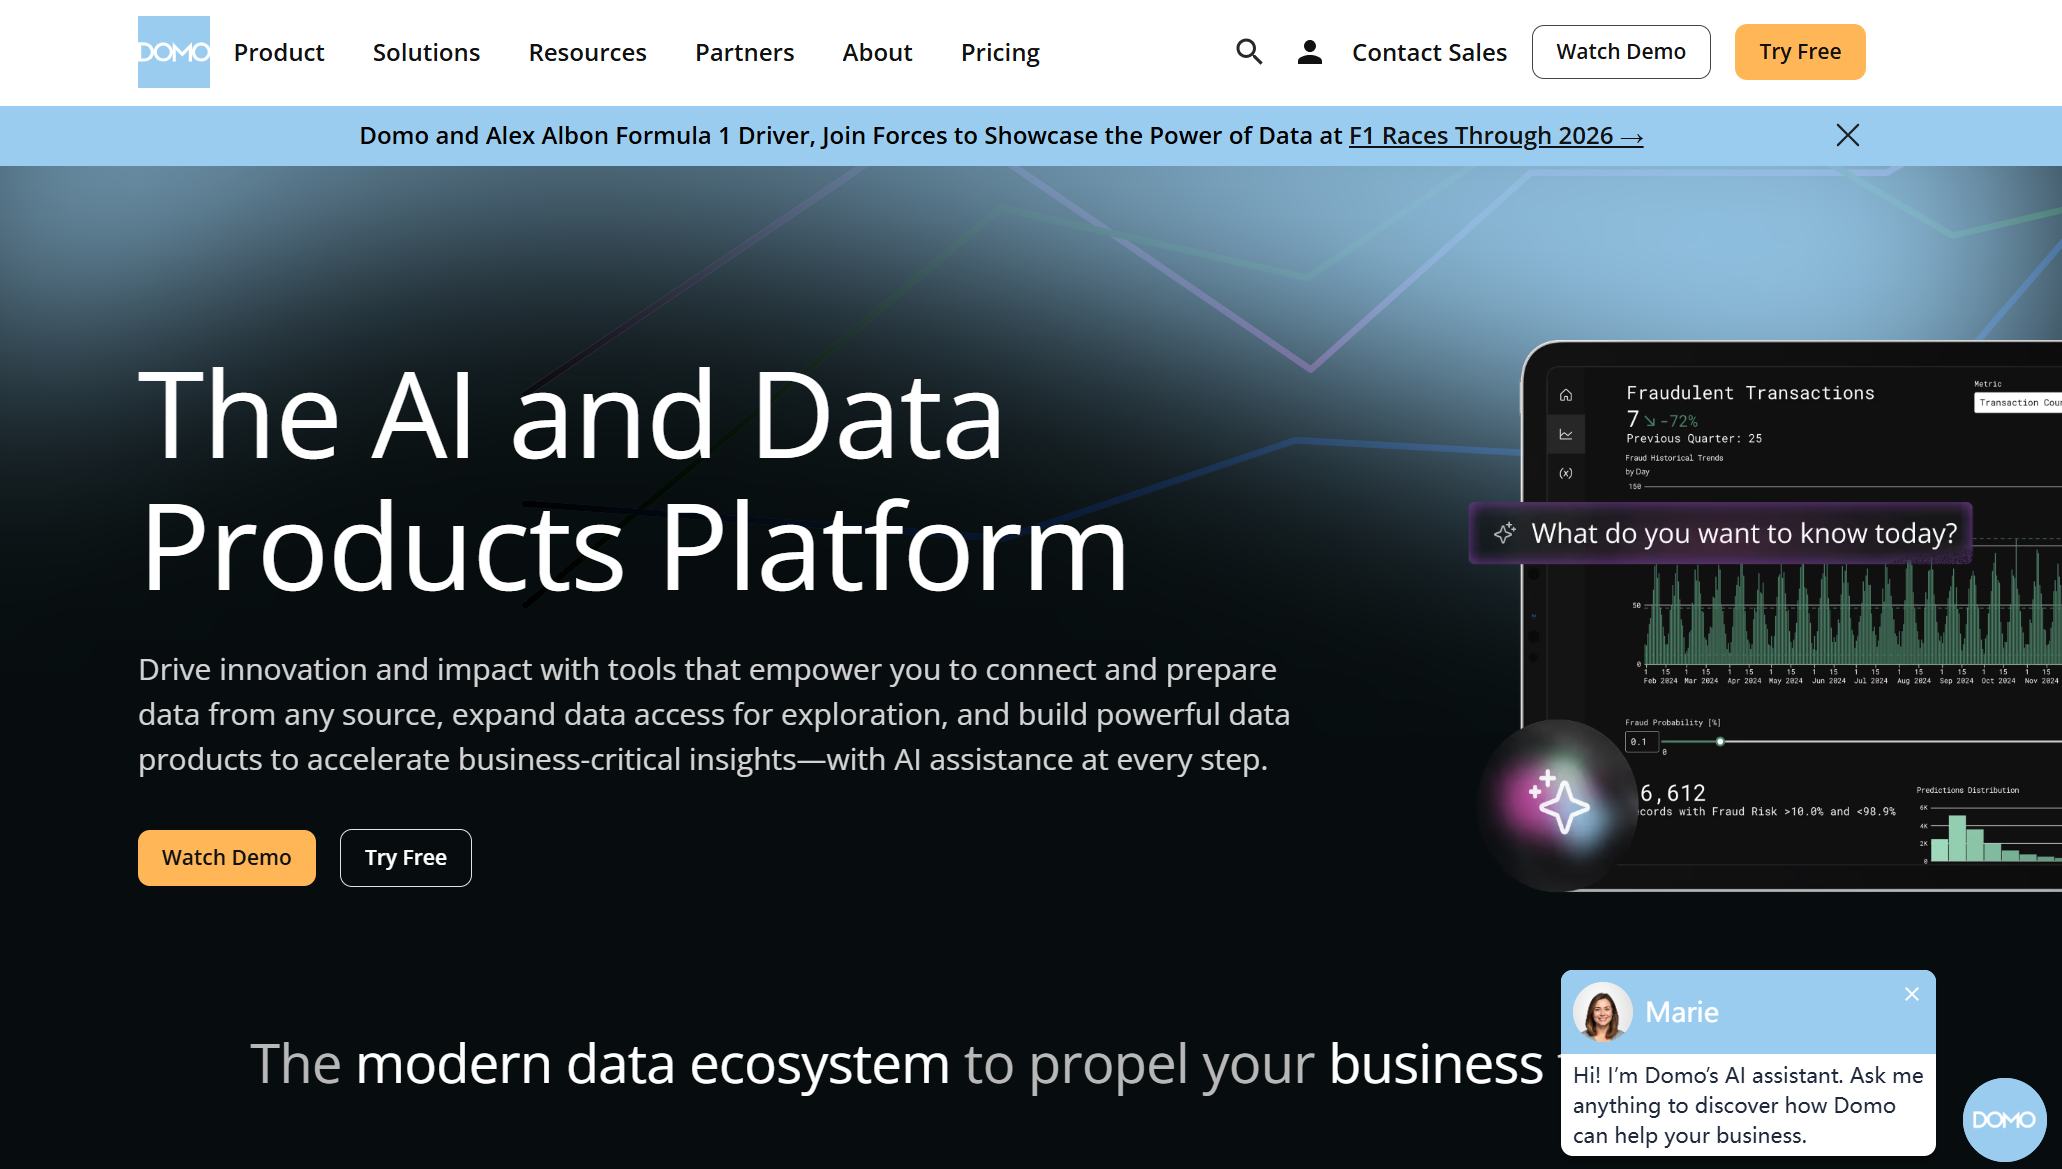
Domo makes it simple for everyone—from beginners to experts—to work with data.
Pros: Fast time-to-value with extensive connector library, polished executive-facing UX, strong mobile experience, combines BI with lightweight app building.
Cons: Premium pricing, less customizable than open-platform alternatives, vendor lock-in risk, limited community compared to major players.
Ideal users: Executive teams and mid-to-large companies prioritizing fast deployment and polished dashboards over deep customization.
Pricing: Custom quote; typically annual subscription based on users and data volume.
11.Sisense
Website: https://www.sisense.com/
Best for: Product teams and SaaS companies embedding analytics into customer-facing applications.
Pros: Real-time transactional data without extraction, deep operational process coverage, unified ERP + MIS in one system, strong for manufacturing and supply chain.
Cons: Extremely high TCO, requires SAP expertise, limited flexibility outside SAP ecosystem, long implementation cycles.
Ideal users: Large enterprises fully committed to SAP S/4HANA as their operational backbone.
Pricing: Custom quote; significant infrastructure and licensing investment.
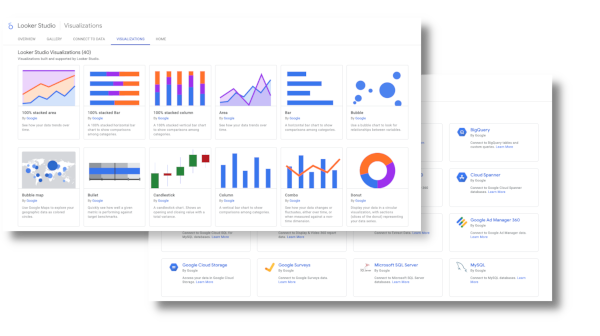
Pros: Strong governance through LookML, excellent for BigQuery-centric architectures, clean and consistent UX, good for data engineering-led organizations.
Cons: Requires LookML knowledge (not truly no-code), limited visualization variety, less suited for formatted/paginated reports, Google Cloud dependency.
Ideal users: Data engineering teams on Google Cloud who value governed semantic models over drag-and-drop flexibility.
Pricing: Looker Standard custom quote; typically $3,000+/month base + per-user fees.
Best for: Industry-specific enterprises (manufacturing, healthcare, hospitality) needing vertical MIS with embedded analytics.
Key features include:
Industry-specific solutions for manufacturing, healthcare, distribution, and more
Integrated ERP, CRM, and supply chain management
AI-driven automation and analytics
Mobile access for work on the go
Flexible deployment options (public, private, or hybrid cloud)
Advanced security and compliance tools
You can customize dashboards and reports to fit your needs. The platform grows with your business, making it a strong choice for companies that want to scale.
Pros: Deep vertical functionality out-of-the-box, embedded analytics tuned to industry KPIs, reduces need for separate BI tool in core operational areas.
Cons: Limited general-purpose BI capability, smaller ecosystem, less flexibility for cross-industry or custom analytics, vendor-specific roadmap.
Ideal users: Companies in Infor's target verticals that want ERP-integrated MIS without adding a separate BI platform.
Pricing: Custom quote based on industry module and user count.
15.TIBCO Spotfire
Website:https://www.spotfire.com/
Best for: Technical analysts and data scientists needing advanced analytics with streaming data support.
You don’t need to be a data scientist to use Spotfire. The interface feels friendly, and you can drag and drop your way to insights.
Pros: Powerful for technical users, strong streaming and real-time analytics, good for IoT and industrial use cases, flexible scripting environment.
Cons: Steep learning curve for non-technical users, smaller community, less polished UX for business consumers, declining market share.
Ideal users: Technical analysts and data scientists in industrial, energy, or IoT environments needing advanced analytics.
Pricing: Custom quote; analyst and consumer licensing tiers available.
MIS Tools Comparison Table
Choosing the right MIS tool can feel overwhelming. You want to see the differences quickly. This section gives you a clear side-by-side look at features, use cases, and pricing. Let’s break it down so you can pick the best fit for your business.
Feature Comparison Table
Tool
Reporting depth
Dashboard capability
Data integration
Automation
Governance
AI readiness
Power BI
Medium
Strong
Strong
Strong
Medium
Strong
SAP BusinessObjects
Strong
Medium
Strong (SAP)
Strong
Strong
Medium
FineReport
Strong
Strong
Strong
Strong
Strong
Medium-Dora
Oracle NetSuite
Medium
Medium
Built-in ERP
Medium
Medium
Medium
Tableau
Medium
Strong
Medium
Medium
Medium
Strong
Zoho Analytics
Medium
Medium
Medium
Medium
Basic
Medium
IBM Cognos
Strong
Medium
Strong
Strong
Strong
Strong
Einstein Analytics
Medium
Medium
Salesforce-only
Medium
Medium
Strong
Qlik Sense
Medium
Strong
Medium
Medium
Strong
Medium
Domo
Medium
Strong
Strong
Strong
Medium
Medium
Sisense
Medium
Strong
Medium
Medium
Medium
Medium
SAP S/4HANA
Strong
Medium
Built-in ERP
Medium
Strong
Medium
Google Looker
Medium
Medium
BigQuery-native
Medium
Strong
Medium
Infor CloudSuite
Medium
Medium
Built-in ERP
Medium
Medium
Medium
TIBCO Spotfire
Medium
Medium
Medium
Medium
Medium
Medium
Use Case Matrix
Not every tool fits every job. Here’s a quick matrix to help you match tools to your needs. You can see which tools shine for different teams or industries.
Note: If you need flexible reporting and easy integration, FineReport is a strong choice for many industries.
Pricing Overview
MIS tools use different pricing models. You might pay per user each month, pick a package based on features, or buy a license once and own it forever. Here’s a quick look at common pricing models:
Pricing Model
Description
Per-User, Per-Month (SaaS)
You pay a recurring fee for each user. This gives you a low upfront cost and clear budgeting.
Tiered Subscription (Feature-Based)
You choose a package with the features you need. You pay a fixed price for each tier.
Per-Asset Pricing
You pay based on the number of assets managed. This often includes unlimited users.
Perpetual License
You pay once and own the software forever. This counts as a capital expense for your business.
Most vendors offer free trials or demos. You can test before you commit. Always check for extra costs like support, training, or upgrades.
Tip: Think about your team size and how fast you plan to grow. The right pricing model can save you money as your needs change.
Best MIS Tools by Use Case
Different organizations need different things from MIS tools. Use this decision guide to narrow your shortlist:
Low cost, quick setup, sufficient for small-scale MIS
Streaming/IoT analytics
TIBCO Spotfire, Domo
Real-time data processing, industrial-grade analytics
No single tool wins every category. The right choice depends on your existing infrastructure, team skills, reporting requirements, and growth trajectory.
Key Features to Look for in MIS Tools
Data Integration & ETL
You want your data to flow smoothly from every corner of your business. That’s why data integration and ETL (Extract, Transform, Load) matter so much in any MIS tool. You need a system that brings together information from different sources—like databases, spreadsheets, and cloud apps—without a headache.
When you look for a data integration feature, keep these points in mind:
Ease of use helps you get started quickly, even if you’re not a tech expert.
Support for various data formats means you can connect everything, from CSV files to complex databases.
Advanced transformation tools let you clean and shape your data before you use it.
Efficient data loading techniques save you time and keep your reports up to date.
Data quality checks make sure you trust the numbers you see.
You also want your MIS tool to fit with your current systems. Compatibility, scalability, and strong performance keep your business running smoothly as you grow. A user-friendly interface and good vendor support make your life easier, especially when you run into questions.
Reporting & Visualization
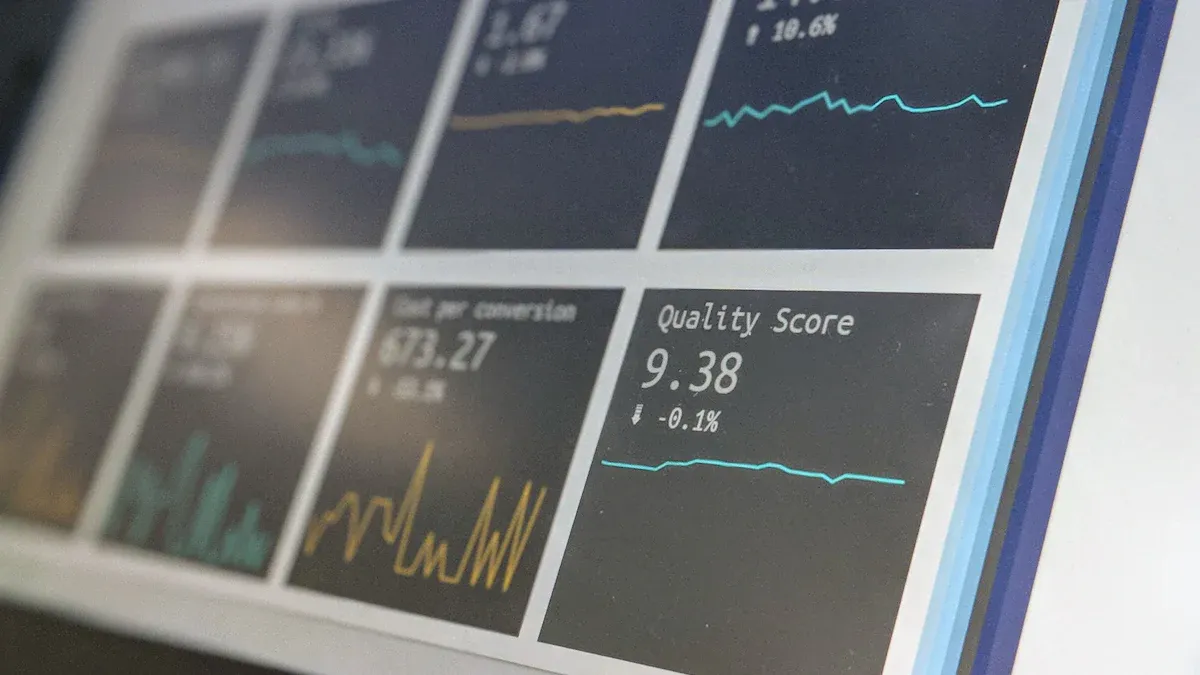
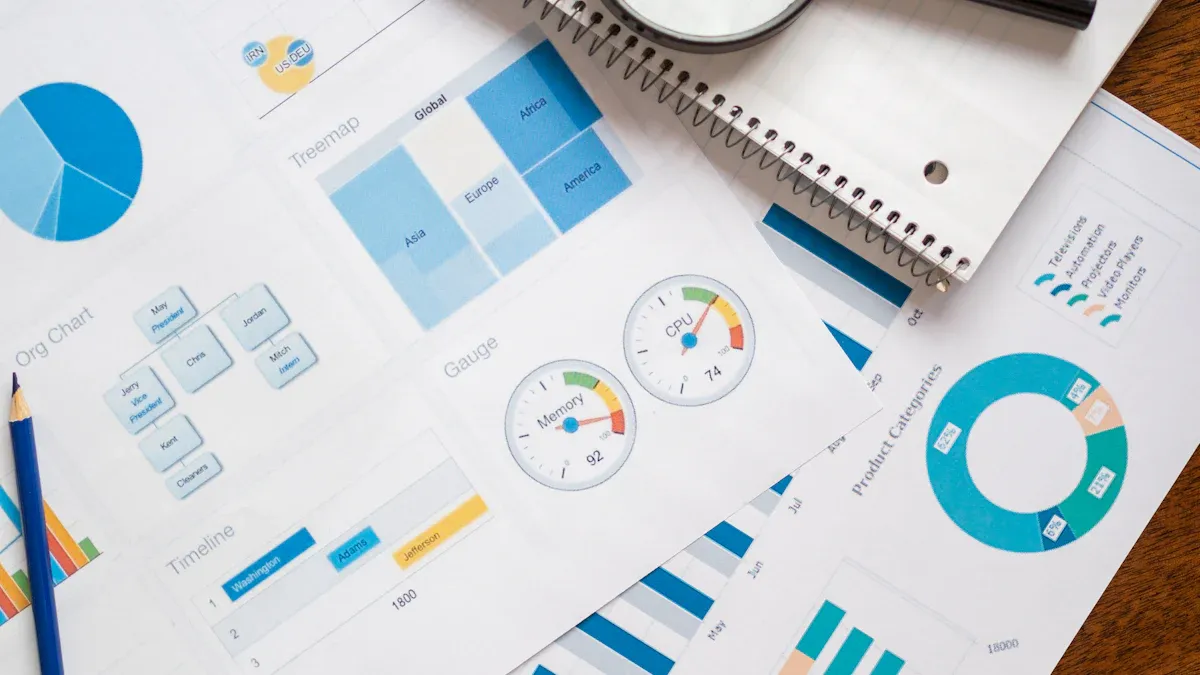
You need to see your data in a way that makes sense. A great data visualization tool turns raw numbers into clear stories. With interactive dashboards, you can explore your business from every angle. You don’t just get static charts—you get tools that let you click, filter, and dig deeper.
Here’s why reporting and visualization features matter:
Visualization makes complex data easy to understand. You can spot trends and make decisions faster.
Interactive dashboards help you share insights with your team. Everyone stays on the same page.
Modern data visualization tool options go beyond simple graphs. You get engaging graphics that highlight what matters most.
You can move from basic reports to interactive dashboards that reveal hidden patterns.
These tools help you focus on strategy, not just on what happened yesterday.
A good data visualization tool empowers everyone in your company. You don’t need to be a data scientist to find answers. You just need the right interactive dashboards to guide you.
Tip: Use interactive dashboards to keep your team informed and ready to act. The right visuals can turn confusion into clarity.
Automation & AI
You want to save time and avoid mistakes. Automation and AI features in MIS tools help you do just that. You can set up workflows that run on their own, so you don’t have to repeat the same steps every day. AI can spot patterns in your data and even predict what might happen next.
With automation, you can:
Schedule reports to run and send themselves out.
Trigger alerts when something important changes.
Keep your data fresh without manual updates.
AI features take things further. They help you find trends, forecast results, and make smarter choices. When you combine automation with interactive dashboards, you get a system that works for you—even when you’re not watching.
Note: Automation and AI free up your time for bigger ideas. Let your MIS tool handle the routine work while you focus on growth.
Security & Compliance
You want your business data to stay safe. Security and compliance features in MIS tools help you protect sensitive information and follow the rules. You can’t afford to ignore these areas. Data breaches and compliance failures can cost you money and trust.
Let’s break down what you should look for:
User Access Controls: You decide who can see or change data. Set up roles and permissions for every team member.
Data Encryption: Your data stays protected, both when stored and when sent over the internet.
Audit Trails: You track every action. If something goes wrong, you know who did what and when.
Regulatory Compliance: You meet industry standards like GDPR, HIPAA, or SOX. The tool helps you stay up to date with changing laws.
Automated Backups: Your data gets backed up on a schedule. If you lose something, you can restore it fast.
Note: Security isn’t just about technology. You need clear policies and regular training for your team. The best MIS tools make this easy.
Here’s a quick table to help you compare security features:
Feature
Why It Matters
Access Controls
Only the right people see your data
Encryption
Keeps data safe from hackers
Audit Logs
Tracks changes and actions
Compliance Tools
Helps you follow the law
Backup & Recovery
Protects you from data loss
You want peace of mind. Choose an MIS tool that puts security and compliance first.
Scalability for Organizations
Your business will grow. You need an MIS tool that grows with you. Scalability means the system can handle more users, more data, and more complex tasks as your needs change.
Here’s what to look for:
Flexible User Management: Add or remove users easily. You don’t want to pay for seats you don’t use.
Performance at Scale: The tool should run smoothly, even with lots of data or users.
Cloud and On-Premises Options: Pick what fits your business. Cloud solutions often scale faster, but on-premises gives you more control.
Integration with Other Systems: Connect new apps or data sources as your business expands.
Customizable Workflows: Change processes without starting from scratch.
Tip: Start with what you need now, but think about where you want to be in two or five years. The right MIS tool will support your journey.
You don’t want to switch systems every time you grow. A scalable MIS tool saves you time, money, and headaches. You can focus on your business, not your software.
If you choose a tool like FineReport, you get both security and scalability. You can manage permissions, protect your data, and add new users or reports as your company grows. That’s how you stay ready for anything.
FineReport, FineBI, FineDataLink, and Dora for Enterprise MIS
FanRuan's product stack covers the full MIS lifecycle from data ingestion to AI-assisted decision support. Rather than forcing a single tool to handle every layer, each product addresses a specific dimension of enterprise MIS:
Layer
FanRuan Product
Role in MIS
Data integration
FineDataLink
Connect ERP, CRM, finance, operations, and other systems
Reporting
FineReport
Build scheduled MIS reports, dashboards, and operational cockpits
Self-service BI
FineBI
Let business users explore KPIs and management data
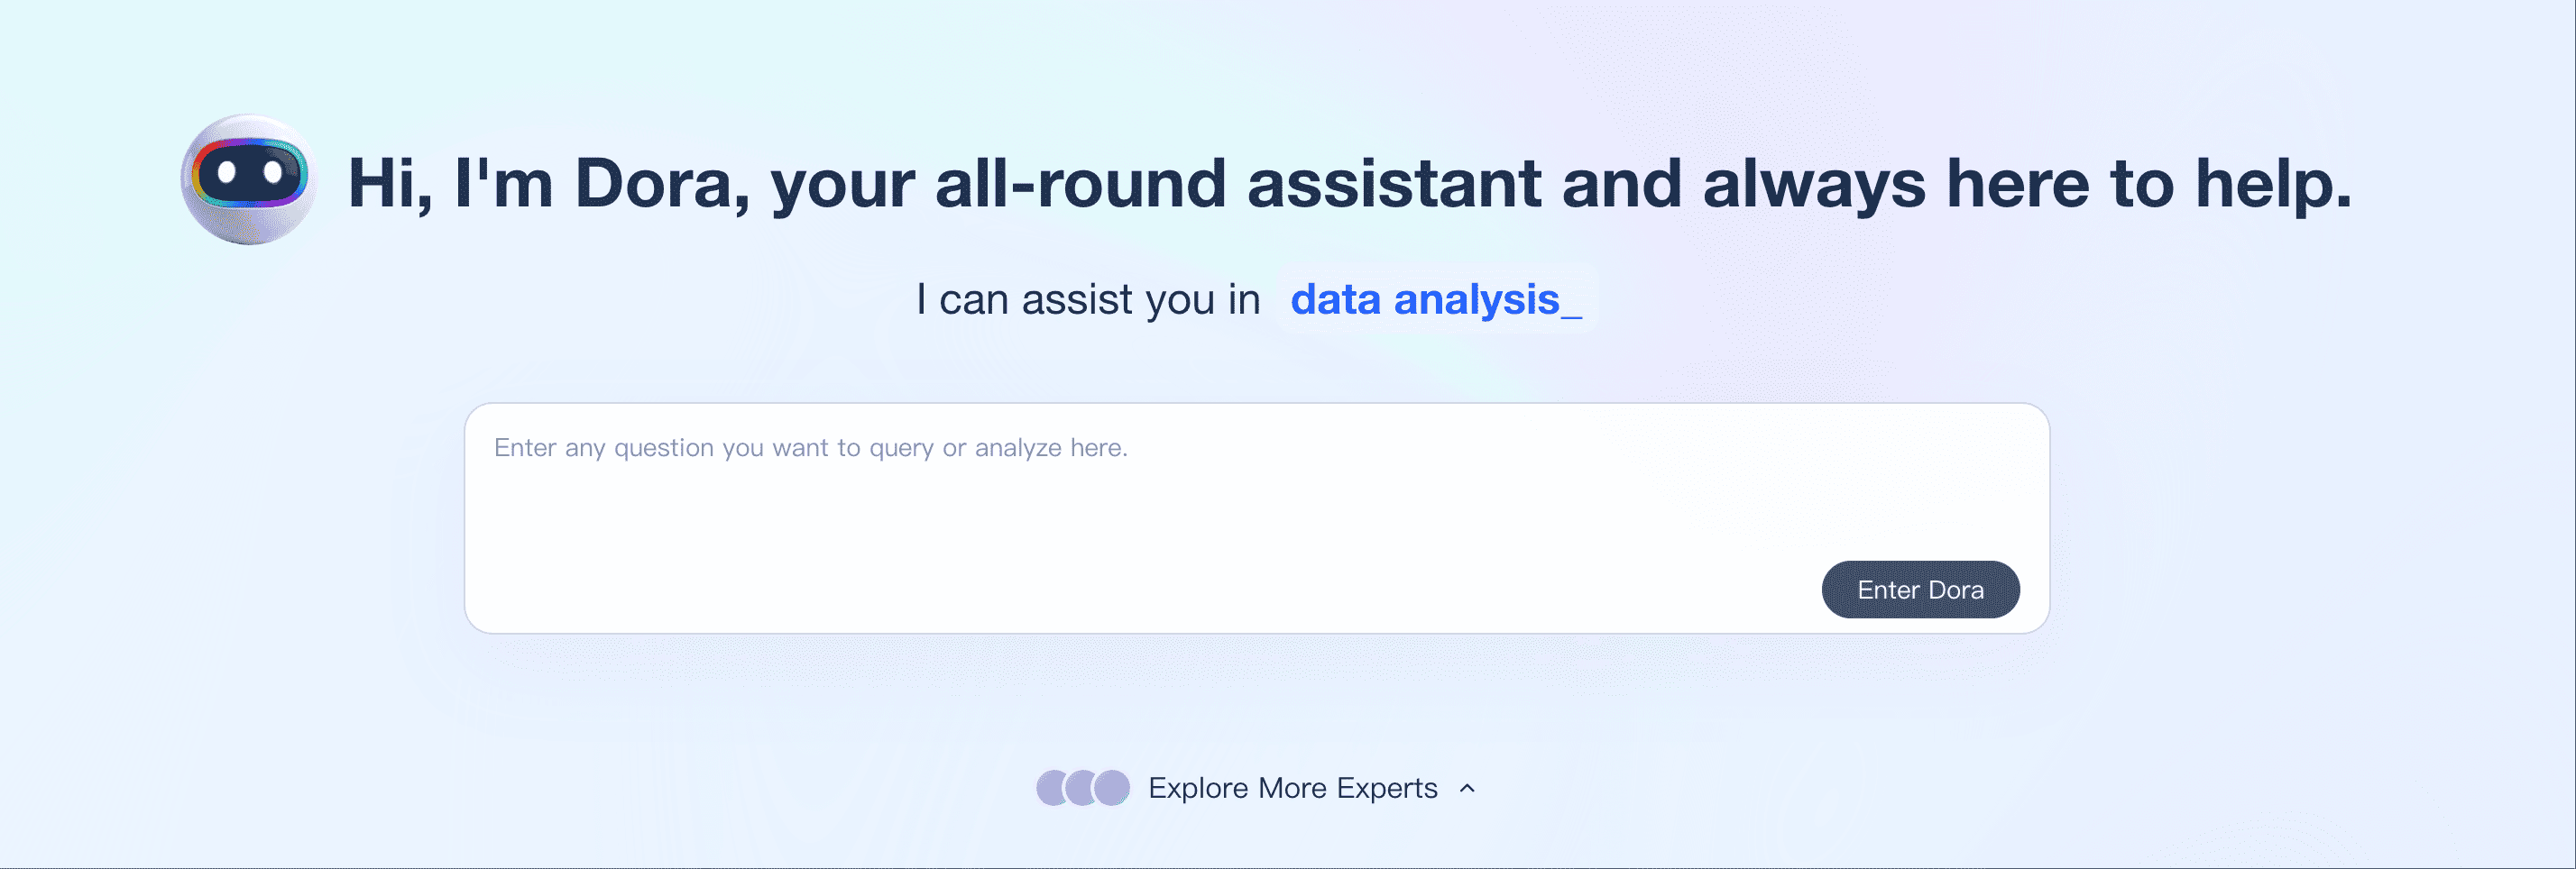
AI Data Agent
Dora
Generate summaries, answer data questions, monitor anomalies, and push follow-ups
This layered architecture means you can adopt incrementally: start with FineDataLink to solve data silos, add FineReport for automated reporting, extend with FineBI for self-service, and layer Dora when your trusted data foundation is ready for AI. Each product works independently but delivers compounding value when combined.
For teams evaluating automated reporting tools as part of their MIS stack, FineReport provides the formatting and scheduling depth that general-purpose BI platforms often lack.
How Dora Adds AI Automation to MIS Workflows
Traditional MIS tools help managers view reports and dashboards. Dora adds an AI Data Agent layer on top of trusted BI assets, KPI definitions, permissions, and business rules. Instead of manually searching dashboards, users can ask business questions in natural language, generate management summaries, monitor unusual changes, and push follow-up tasks to the right owners.
MIS Workflow
Traditional MIS Tool
Dora AI Agent
Management report
Shows prepared reports
Generates narrative summaries from trusted BI assets
KPI dashboard
Displays metrics
Explains KPI changes and possible causes
Risk monitoring
Requires manual review
Detects anomalies and pushes alerts
Meeting preparation
Analysts collect screenshots
Dora prepares daily or weekly briefings
Follow-up
Managers assign tasks manually
Dora can push owner-specific follow-ups
Example Dora prompt: "Generate this week's management briefing with revenue, order risk, inventory changes, and top issues by department."
Dora works best when the underlying data infrastructure is already governed. FineDataLink ensures clean, integrated source data; FineReport and FineBI provide trusted dashboards and defined KPIs; Dora converts those assets into natural-language insights and proactive actions. Without that foundation, AI-generated summaries risk amplifying confusion rather than resolving it.
Product Trial
FineReport
Pixel-perfect reports · Interactive dashboards · Easy data entry · Digital twins
Access a wealth of case studies, industry insights, and solution guides to accelerate digital transformation.
FAQ
What is an MIS tool?
You use an MIS tool to collect, organize, and analyze business data. It helps you make smart decisions and run your company more smoothly.
How do I choose the right MIS tool for my business?
Start by listing your needs. Think about your team size, budget, and the features you want. Try demos or free trials before you decide.
Can I connect MIS tools to my current software?
Yes! Most MIS tools let you connect to databases, spreadsheets, and cloud apps. You can usually integrate them with your existing systems.
Do MIS tools support mobile devices?
You can access many MIS tools on your phone or tablet. Look for mobile BI features if you want to check reports on the go.
Is my data safe with an MIS tool?
Most top MIS tools use strong security. You get user access controls, encryption, and regular updates to keep your data safe.
How much do MIS tools cost?
Prices vary. Some tools charge per user each month. Others offer one-time licenses. Many vendors provide free trials so you can test before you buy.
Can I automate reports with an MIS tool?
Yes! You can schedule reports to run automatically. The tool can send updates to your email or dashboard without extra work.
What if I need help using my MIS tool?
You get support from most vendors. Look for guides, tutorials, and customer service. Many tools also have user communities where you can ask questions.