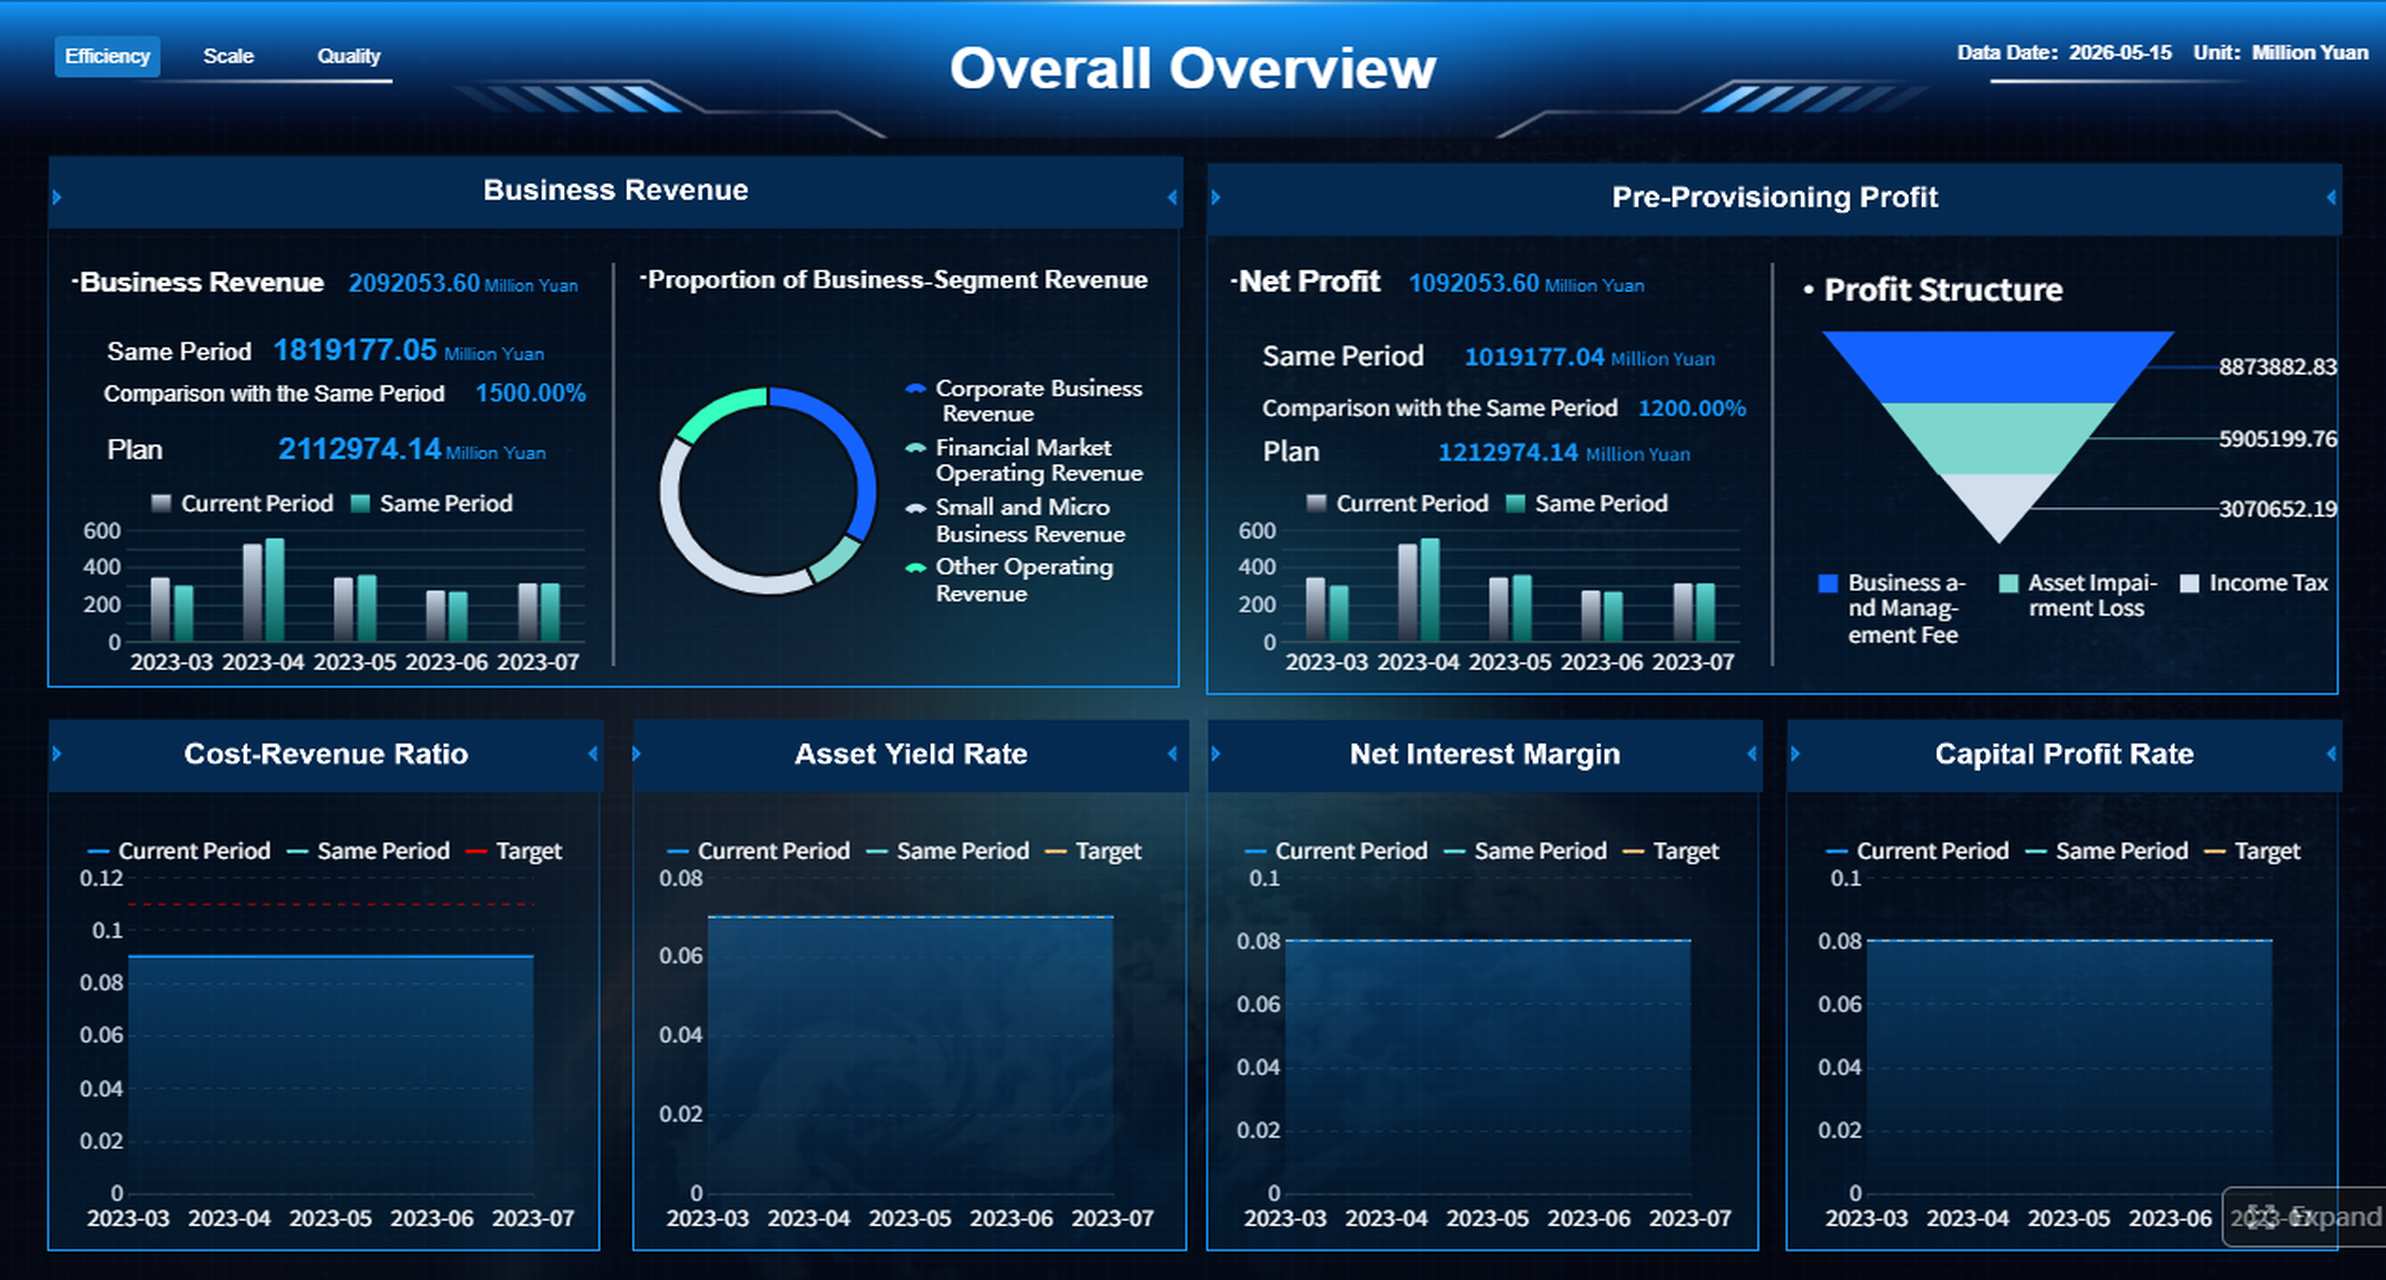
A mis report shows you business data in a simple way. This helps you make better choices each day. You use it to change raw numbers into useful ideas. These ideas help you reach your goals. Many business leaders use these reports to watch results and find trends. Modern tools like FineReport by FanRuan make this work faster and smarter. Look at how these features help:
You might ask what a mis report means. The mis report full form is "Management Information System report." This report shows you what your business does each day. You can see how your company is doing. Experts say a mis report is a group of data that helps you look at important parts of your business. You use it to check how your company is doing and make smarter choices.
You use a mis report to turn numbers into useful ideas. These ideas help you understand important facts and see how you are doing. You can find patterns and see where your business stands. The mis report usually has summary data. This gives you an overview, but sometimes you need more details to find issues. Business intelligence tools can give you real-time data, but a mis report helps you see the big picture.
Core Purpose of MIS Reports
The main goal of mis reporting is to help you make good choices. You use these reports to help you decide and manage your business better. You can find problems and fix them fast. You also use mis reports to check important numbers and make sure you reach your goals.
Here are the main benefits of a mis report:
Benefit
Description
Decision-making
MIS reports give helpful facts that support smart choices.
Problem identification
These reports show problem areas in a company. This lets managers fix things that do not work well.
Business growth
MIS reports give key data that answers big questions about money and market position.
Internal communication
They make things clear and help people talk better with others in the company.
Improved performance
Regular reports let businesses check how well they work and make sure goals are met.
Operational efficiency
Looking at business data helps make work easier and faster.
Better planning
Correct data from MIS reports helps make good plans and avoid risks.
You use a mis report to watch important numbers. You can see sales, production, and other key facts. This helps you plan ahead and avoid problems. You also use these reports to help people in your company talk better. Everyone can see the same data and work toward the same goals.
You can use mis reports in many ways at work:
MIS reports help managers make smart choices for better work.
Decision Support Systems give managers information for special choices using math models.
Using MIS in main work makes things run better and adds value.
Real-time data lets you answer customer needs and market changes fast.
Knowledge Management Systems help with big choices by showing what employees do best.
You may have problems when you start using mis reports. Some people do not like change. You might have trouble connecting new systems to old ones. Training matters. You need to learn how to use the reports and understand the data. When you solve these problems, you can use mis reports to make your business stronger.
MIS reports help you focus on important numbers. You can check progress, find problems, and make plans. You use these reports to guide your business and reach your goals.
Why MIS Reports Matter
Key Benefits and Purpose
MIS reports help you see your business clearly. These reports give your team many helpful things. Here are five main reasons companies use mis reporting:
You make smart choices because you get good information fast.
You stay ahead by seeing market data and trends right away.
You use resources better by knowing what your business needs.
You make customers happier by learning what they want.
You plan well with facts from your management information system.
A mis report can show sales trends or customer feedback. This helps you find problems early and plan for what comes next. When you make mis report documents, your team gets the facts to work smarter.
Impact on Decision-Making
MIS reporting gives you organized data to help you choose. You can see patterns, guess cash flow, and manage money. This helps you use resources well and earn more profit. Using different mis reports, like operational or summary reports, gives you a full view of your business. These reports help your team talk better and make choices faster.
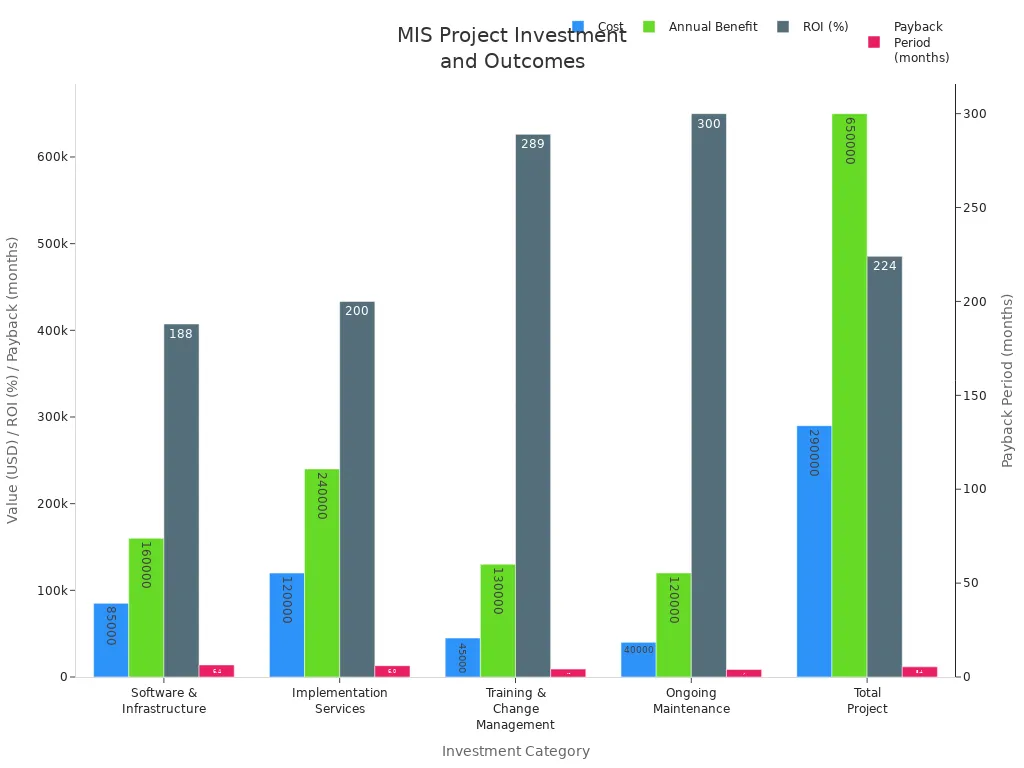
MIS reports also help you check your return on investment. You can match your goals, check costs, and see both money and other benefits. Many companies see big improvements after using these tools.
FineReport from FanRuan makes mis reporting easier. FineReport connects data from many places and builds all kinds of mis reports. You use drag-and-drop tools to make custom reports quickly. FineReport lets you share reports with your team and automate regular reporting. This means you spend less time doing things by hand and more time making smart choices with data. Many companies, like Merry Electronics, work better and help employees by using FineReport for their reports.
If you run a business, you need to know about mis reports. Each kind shows your company’s data in a different way. You use these reports to check progress, find problems, and plan ahead.
Summary and Trend Reports
Summary reports show the main numbers. You see totals and averages. These reports help you see how your business changes over time. Trend reports help you spot patterns. You can compare sales from month to month. You also see how customer numbers go up or down.
Here is a table that explains these two types:
Type of Report
Description
Summary Reports
You see totals and summaries for units, products, or groups. This helps you understand overall results.
Trend Reports
You spot trends and compare actual results to your goals. You can see if things are getting better or worse.
You use summary and trend reports a lot. Top managers look at them to make big choices. These reports help you plan for growth and find new chances.
Exception and Operational Reports
Exception reports show when something is not right. You see high costs or missing inventory. These reports help you find waste and stop fraud. Managers get lists of things to fix. You can solve problems before they grow.
Operational reports help you run your business every day. You track sales, inventory, and cash flow. You use these reports to make sure everything works well.
Exception reports show strange data, like high costs or missing items.
They help you find problems early and keep your business safe.
Managers use these reports to act fast and stop losses.
Custom MIS Reporting with FineReport
FineReport lets you make many kinds of mis reports. You can build summary, trend, exception, and operational reports. You use drag-and-drop tools to design reports that fit your needs. FineReport connects to many data sources. You see all your information in one place.
You can also change reports for your team. For example, you might make a sales dashboard for your sales team. Or you can make an inventory report for your warehouse. FineReport helps you automate report creation and share results with others. You save time and make better choices with custom mis reports.
You can see that different mis reports help you in many ways. FineReport gives you tools to make and change each one for your business.
MIS Report Process
Data Collection and Integration
You begin by collecting data from many places. You get information from workers, managers, papers, and sales records. You check that the data is correct and complete. You clean the data so it is easy to use. You put data together from different systems. This gives you one clear view. This step helps you find all important facts. It also helps you use resources better.
Note: When you get mis report data ready, you must look for mistakes. You need to make sure everything matches. This step is very important for mis reports.
Essential Components of MIS Reporting
You need many parts to make a good mis report format. Here is what you should have:
You also add a title, date, department, KPIs, tables, charts, insights, action steps, and names of people who make mis report documents. You use the mis report format to show what needs to change, who should do it, and when to start.
Tip: Always put clear action steps in your mis report format. This helps your team know what to do next.
MIS Reporting Workflow with FanRuan
FanRuan tools, like FineReport and FineDataLink, make mis reporting simple. You connect to over 100 data sources and set up automatic data integration. You use drag-and-drop tools to make your mis report format. You schedule reports and set alerts to find mistakes. You run checks often and track changes to keep your data safe.
Strategy
Description
Automated Alerts
Finds strange or risky activities right away, so you can act fast.
Regular Integrity Checks
Reviews often make sure data stays correct and safe.
Change Tracking
Keeps a record of changes, showing who changed what and when.
Looks at data for patterns and problems, helping spot issues early.
Role-Based Access Audits
Checks who can use data to stop wrong changes and keep data safe.
You use FanRuan tools to make mis report documents fast. You follow best ways to prepare an mis report. You teach your team and check reports often. You build a workflow that shows why mis reports matter and helps your business grow.
AI-Powered MIS Reporting
The biggest flaw of traditional MIS reporting is that it looks backward. By the time a static monthly report reaches an executive's desk, the data is already weeks old. Today, AI-powered BI solutions are revolutionizing MIS through automation and natural language generation (NLG).
With tools like FineReport and FineBI, modern enterprises no longer manually piece together data from fragmented ERPs. AI algorithms can automatically generate executive summaries, highlight key financial variance, and even forecast next month's performance based on historical trends. Imagine asking your MIS system: 'Why did our logistics cost increase this week?' and having an AI assistant instant perform a root-cause analysis with tailored visual charts. This shifts MIS from a passive record-keeping tool into a proactive decision-making engine.
You can make mis report documents by following some easy steps. This way works for most business tools and helps you stay neat.
First, choose what information you want to watch. Pick the most important numbers for your business.
Next, open a new spreadsheet or reporting tool. Give your file a clear name, like "MIS Report Example."
Then, set up columns and rows for each number and time. Make sure your layout is simple to read.
After that, enter your data with care. Check your numbers to make sure they are right.
Use charts or graphs to show changes and patterns. Pictures help people understand your report better.
Add filters or sorting tools. This lets you and your team look at the data in different ways.
Save your report and share it with everyone who needs it.
Tip: Always check your report before you share it. Look for mistakes and make sure everything is easy to understand.
Best Practices for MIS Reporting
You can make your reports better if you follow these tips:
Check where your data comes from and clean it often.
Use simple tables and graphs to show your results.
Make a schedule and stick to it for mis reporting.
Focus on the most important KPIs for your business.
Make reports easy to get, like using cloud tools.
Ask others for feedback and keep making your reports better.
Using FineReport for MIS Reports
FineReport helps you make and send reports easily. You can connect to many data sources and use drag-and-drop tools to make your own layouts. FineReport lets you build dashboards, set up automatic updates, and share results with your team. You can also find training to get better at using the tool. For example, you can learn how to handle money data, look at trends, and use reporting software.
Course Objectives
Description
Interpreting Financial Data and MIS Reports
Find trends and help your business do better
Hands-on Experience with Accounting Software
Use tools to make your reports more correct
Managing Cost and Profit Centres
Study how your business is doing with money
You can use these resources to get better at making reports and understanding your business data.
You can use MIS reports to turn business data into clear actions. These reports help you see what changed, why it happened, and what to do next. With FineReport by FanRuan, you build reports that support data-driven decision-making. You answer important questions and guide your team forward.
Access a wealth of case studies, industry insights, and solution guides to accelerate digital transformation.
FAQ
What is an MIS report?
You use an MIS report to see important business data. It helps you track progress, spot problems, and make smart decisions. You can find trends and understand how your company works.
How often should you create MIS reports?
You should create MIS reports as often as your business needs. Many companies make them daily, weekly, or monthly. Regular reports help you stay updated and act quickly.
Can you customize MIS reports in FineReport?
Yes, you can. FineReport lets you design custom reports with drag-and-drop tools. You can add charts, tables, and filters. You can also connect to many data sources.
Why do managers use MIS reports?
Managers use MIS reports to check key numbers and see if goals are met. These reports help them plan, solve problems, and lead teams better.