A practical production report template helps manufacturing teams see, on the same day, whether output is on plan, where downtime occurred, how much scrap was generated, and what the next shift must follow up on. That is the difference between a report that merely records activity and one that improves performance.
For production supervisors, plant managers, quality leaders, and maintenance teams, the daily manufacturing report is a working control tool. It supports quick decisions on line balancing, escalation, material replenishment, maintenance intervention, quality containment, and shift handoff.
With FineReport + Dora, teams can ask for a report summary in chat, generate structured narratives from trusted report assets, receive scheduled briefings, and push exceptions to the right owner. Instead of manually reviewing multiple spreadsheets and shift notes, users can consume the report through a governed AI assistant layered on top of trusted reporting assets.
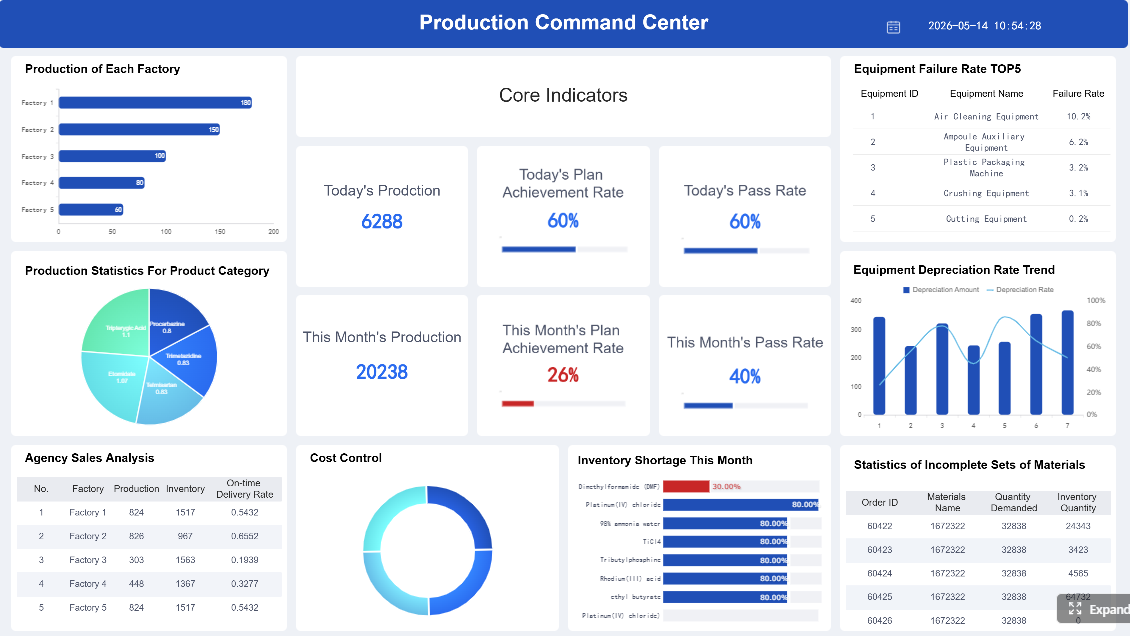
Click To Try The Dashboard
All reports in this article are built with FineReport
Production Report Template: what to track in a daily manufacturing report
A daily shop floor report should answer one simple question: what happened in production today, why did it happen, and what must happen next?
For most manufacturers, that means the report should track four operational themes:
output against plan
downtime and production losses
scrap and quality issues
shift-level accountability and follow-up
The purpose is not just historical documentation. A good daily production report format allows teams to act during the same day and during shift handoff. If the morning shift misses output because of a machine fault, the afternoon shift should not discover that problem from a delayed email or an end-of-day spreadsheet.
Typical users include:
Production supervisors, who need line-level execution visibility
Plant managers, who need a high-level performance snapshot and escalations
Quality teams, who need defect and containment information
Maintenance leads, who need downtime details, causes, and recovery actions
Operations directors and executives, who want a structured management view without chasing multiple reports
In practice, the report should support decisions such as:
whether output recovery is still possible before shift end
whether downtime needs maintenance escalation
whether scrap is isolated or trending across lines
whether staffing or material shortages are affecting throughput
what unresolved issues must be handed to the next shift
which exceptions require management attention immediately
A useful production report template is therefore both an operational record and a management communication tool.
Core sections every daily production report format should include
A strong report layout is built around a few repeatable sections. The exact fields vary by industry and process, but the structure should remain consistent enough for line teams to complete quickly and for management to review at scale.
Output and production volume
This section shows whether production is meeting the schedule.
Key tracking points include:
planned output vs. actual output
output by line, machine, product, SKU, or work order
good units produced
rework quantity
completion status against plan or schedule
attainment rate or variance to target
KPI and report elements for output tracking
Planned output: The scheduled quantity expected for the line or work order during the shift or day. Business value: Sets the baseline for performance review and recovery planning. AI use:Dora can summarize which lines are below plan, explain the size of the gap, and include it in a scheduled production briefing.
Actual output: The quantity actually produced in the reporting period. Business value: Shows execution performance and current throughput. AI use:Dora can answer chat questions such as which line produced the most, which line missed target, and how actual output compares with yesterday or last week.
Good units: Units that passed production and quality checks. Business value: Separates productive throughput from gross counts that may hide quality loss. AI use:Dora can generate a structured report summary that combines good units, scrap, and rework for a more accurate operational picture.
Rework quantity: Units requiring correction before release. Business value: Reveals hidden factory effort that may not appear in final output totals. AI use:Dora can flag rising rework trends and include them in exception summaries for quality and production review.
Schedule completion status: Whether the line or work order is on time, delayed, or completed. Business value: Connects daily shop floor execution to customer fulfillment and planning reliability. AI use:Dora can produce a chart-based answer explaining which orders are at risk and which owners need follow-up.
Downtime and loss tracking
A production report that only shows output is incomplete. Teams also need to know why capacity was lost.
The downtime section should capture:
downtime duration
start and end time if needed
affected line, machine, or asset
cause category
root cause or suspected cause
planned vs. unplanned stoppage
corrective or recovery action
owner and status
This distinction matters. Planned stoppages such as setup, changeover, or scheduled maintenance should not be mixed with avoidable unplanned losses.
KPI and report elements for downtime tracking
Downtime minutes: Total minutes production stopped or slowed materially. Business value: Quantifies lost capacity and supports immediate escalation. AI use:Dora can summarize top downtime contributors and explain which assets had the greatest impact on output loss.
Cause category: Standard code such as mechanical, electrical, material shortage, quality hold, setup, or labor issue. Business value: Allows consistent trend analysis instead of vague free-text reporting. AI use:Dora can retrieve recurring causes from FineReport downtime logs and generate a management narrative around the most frequent loss patterns.
Affected asset: The machine, line, or process area involved. Business value: Helps maintenance and operations identify chronic bottlenecks. AI use:Dora can answer natural-language questions like “Show this week’s unplanned downtime by machine and highlight repeat failures.”
Recovery action: The action taken to restart, stabilize, or contain the issue. Business value: Improves accountability and cross-shift continuity. AI use:Dora can include unresolved downtime actions in a next-shift briefing or exception push.
This section turns basic counts into usable operational intelligence. A report that says “20 units scrapped” is weak. A report that shows defect type, source process, likely cause, and containment action is actionable.
Track items such as:
scrap quantity
defect category
process step or source
suspected cause
containment action
rework vs. true scrap
material usage
material variance against expected consumption
KPI and report elements for scrap and quality tracking
Scrap quantity: Total rejected units or material during the shift or day. Business value: Directly affects cost, yield, and delivery performance. AI use:Dora can generate exception summaries when scrap exceeds threshold and push alerts to the responsible line owner or quality lead.
Defect category: Classification such as dimensional defect, surface issue, missing component, contamination, or packaging defect. Business value: Makes root-cause analysis and corrective action more targeted. AI use:Dora can summarize which defect types increased and compare them with historical report patterns.
Suspected cause: Initial operational explanation for the defect. Business value: Supports same-day containment before a full investigation is complete. AI use:Dora can consolidate recurring suspected causes into a structured report summary for quality review meetings.
Containment action: Immediate action taken to isolate risk, inspect stock, or stop further loss. Business value: Prevents escalation from a local defect into a broader production issue. AI use:Dora can include containment status in daily briefing pushes and follow-up records.
Material consumption and variance: Actual material used vs. expected standard usage. Business value: Connects production reporting with waste control and cost management. AI use:Dora can explain usage variance in management language rather than requiring leaders to inspect raw tables.
Shift summary and accountability
This section converts performance data into ownership.
Shift result summary: A compact overview of output, downtime, scrap, and notable events by shift. Business value: Makes handoffs faster and management reviews clearer. AI use:Dora can generate a structured shift narrative automatically from FineReport data and comments.
Staffing notes: Missing operators, overtime, cross-training gaps, or temporary assignments. Business value: Helps explain performance deviations and workforce constraints. AI use:Dora can include staffing impacts in report summaries without requiring managers to read every text note manually.
Safety issues: Any safety concern, incident, or required escalation. Business value: Ensures operational reporting does not ignore compliance and workforce risk. AI use:Dora can highlight safety-related exceptions in daily briefings so they are not buried in general comments.
Open issues and owner: Unresolved items passed to the next shift or another function. Business value: Prevents repeated problems from disappearing between shifts. AI use:Dora can push follow-up reminders and create review summaries for unresolved items.
How to build a daily production report that teams will actually use
Many daily reports fail for a simple reason: they are designed for management review but not for shop floor completion. If the form is too slow, too detailed, or too inconsistent, people stop trusting it.
Keep the layout fast to fill in on the shop floor
The best daily production report format is simple enough for fast entry and structured enough for reliable analysis.
Good design choices include:
clear field labels
fixed units of measure
drop-down cause lists
short comment fields
visual exception highlighting
one-page summary view for review
Avoid forcing operators or supervisors to write long narrative explanations for every event. Use coded fields for repeatable items and reserve comments for what is truly unusual.
Critical exceptions should be easy to spot immediately, such as:
output attainment below threshold
unplanned downtime above target
scrap above control limit
unresolved issues at shift end
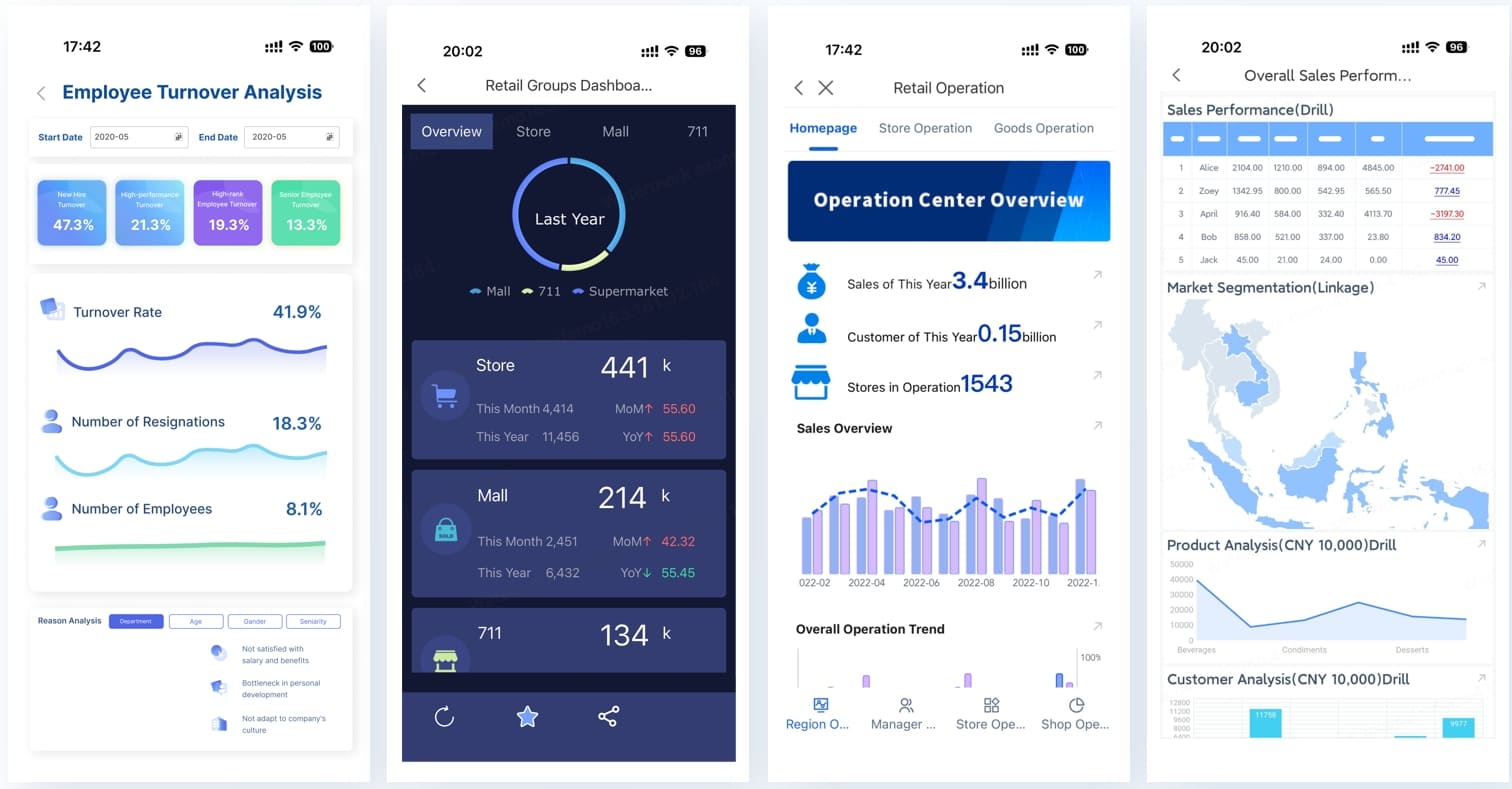
When FineReport is used as the reporting foundation, these exceptions can be displayed in formatted reports and operational cockpits that are easier to scan than static spreadsheets.
Standardize data across lines and shifts
Standardization is what makes a production report template useful beyond one supervisor’s shift.
Use the same definitions for:
output
good units
rework
scrap
downtime
planned stoppages
unplanned losses
OEE-related categories where applicable
Also define:
who owns each section
when data is submitted
what approval or sign-off is needed
which fields are mandatory
how cause codes are selected
This matters even more when AI is introduced. Dora performs best when enterprises have trusted KPI definitions, semantic rules, report templates, and governed reporting assets. If one line defines downtime differently from another, AI summaries will only repeat inconsistency faster.
Make the report useful for review, not just recordkeeping
A report should support action, not just storage.
Include a brief area for:
blockers
corrective actions
support required
priority issues for the next shift
management escalations
Also add simple trends where relevant:
output vs. last 7 days
top three downtime causes this week
scrap trend by defect category
open issues not closed within target time
This is where the move from a spreadsheet-only process to FineReport + Dora becomes practical. FineReport can standardize templates and trend views, while Dora can summarize those views into a scheduled briefing, a shift-handoff recap, or an exception push to the correct owner.
Free daily production report template: suggested columns and example structure
If you are creating a free daily production report template in Excel or a similar format, start with only the columns that support daily action. Avoid turning the file into a full manufacturing execution system.
Essential fields to include
At minimum, your report should capture:
date
plant
line or machine
product or SKU
shift
supervisor
work order
target output
actual output
good units
rework quantity
downtime minutes
downtime cause
scrap units
defect category
key remarks
escalation required
next action owner
A simple example structure could look like this:
Date
Plant
Line
Product
Shift
Work Order
Target Output
Actual Output
Good Units
Rework
Downtime Min
Downtime Cause
Scrap Units
Defect Category
Remarks
Action Owner
You can then add formulas for:
output variance
attainment rate
total downtime by line
scrap rate
open action count
Recommended tabs or sections in an Excel version
To keep the file usable, split it into a few practical tabs:
Daily entry sheet: Main production counts by line, product, and shift
Downtime log: Event-level stoppage tracking with cause and action
Scrap log: Defect details and containment notes
Shift summary: Supervisor review and handoff section
This structure works well for early-stage reporting. But as the operation grows, manual consolidation becomes a bottleneck. Different shifts may overwrite fields, cause codes may become inconsistent, and managers may spend too much time building summaries instead of acting on them.
That is when a governed reporting platform becomes more valuable than another spreadsheet revision.
Download and customization checklist
Before rolling out your template, customize it based on your process:
process type: batch, discrete, assembly, packaging, continuous, or mixed
reporting frequency: shift, day, or both
product complexity: single line vs. multi-SKU
approval workflow: supervisor only or supervisor plus manager
exception logic: threshold-based or trend-based
required comments: all issues or only major deviations
Also make sure your formulas stay simple. Add calculations for:
variance to plan
attainment rate
total downtime
scrap percentage
rework percentage
But do not overcomplicate the file with too many hidden sheets and complex macros. If the template becomes difficult to maintain, teams will stop using it consistently.
The reporting problem in manufacturing is no longer just data collection. It is also report consumption. Managers, supervisors, quality engineers, and maintenance leads often have the report, but they do not have the time to interpret every shift detail quickly.
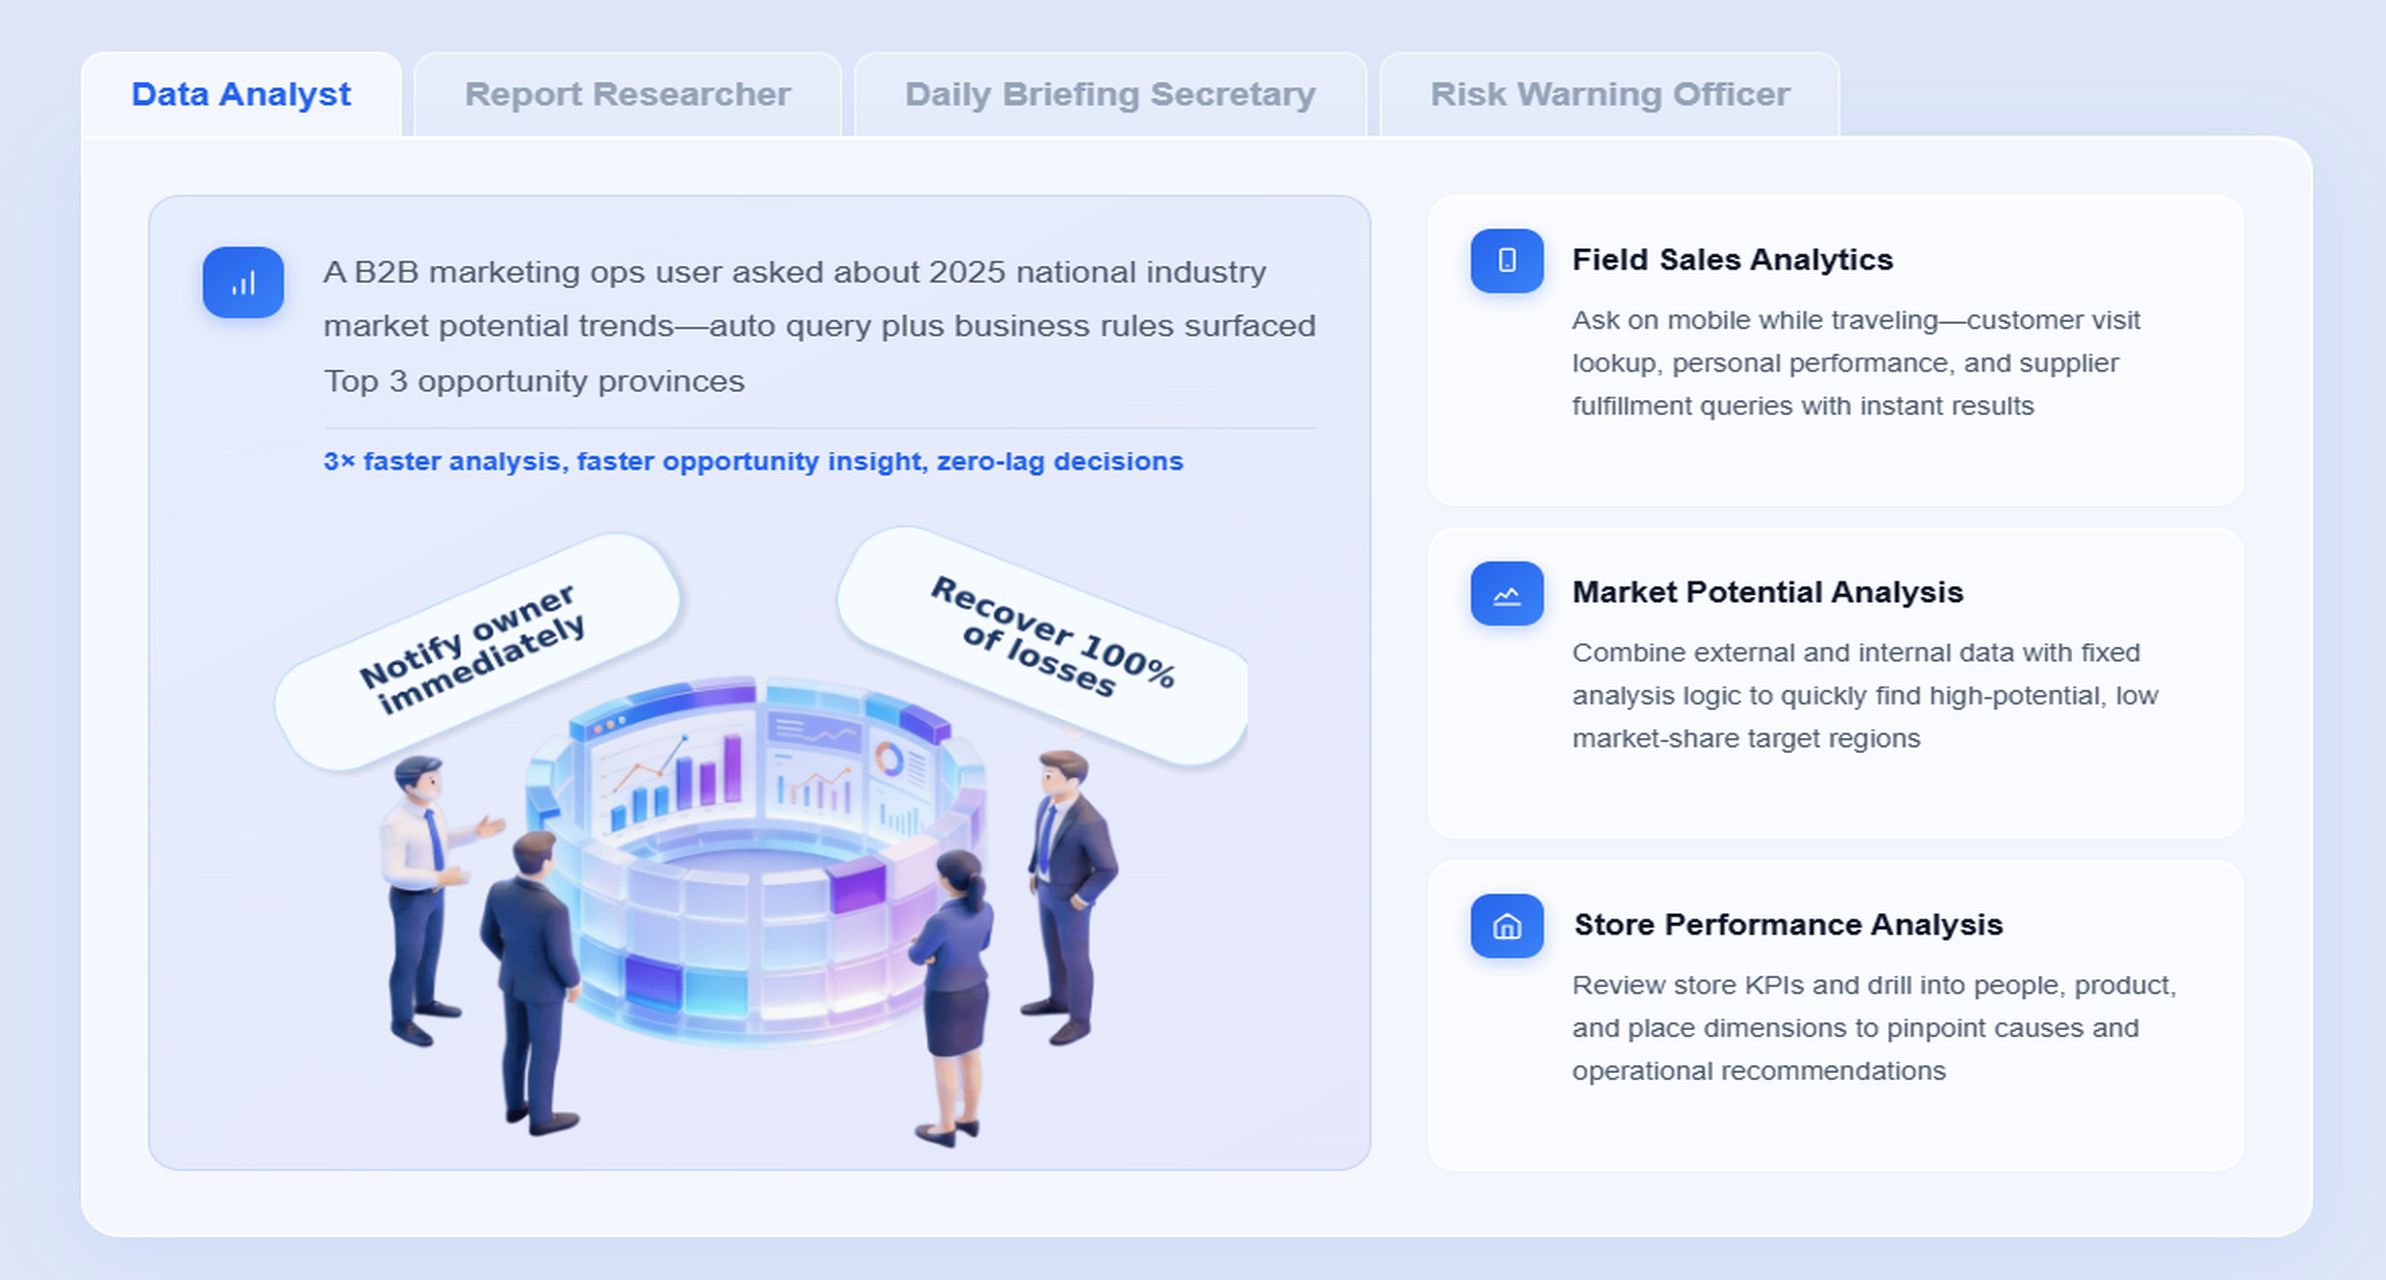
This is where Dora, FanRuan’s enterprise Data Agent, becomes valuable. For this scenario, the most relevant digital employees are:
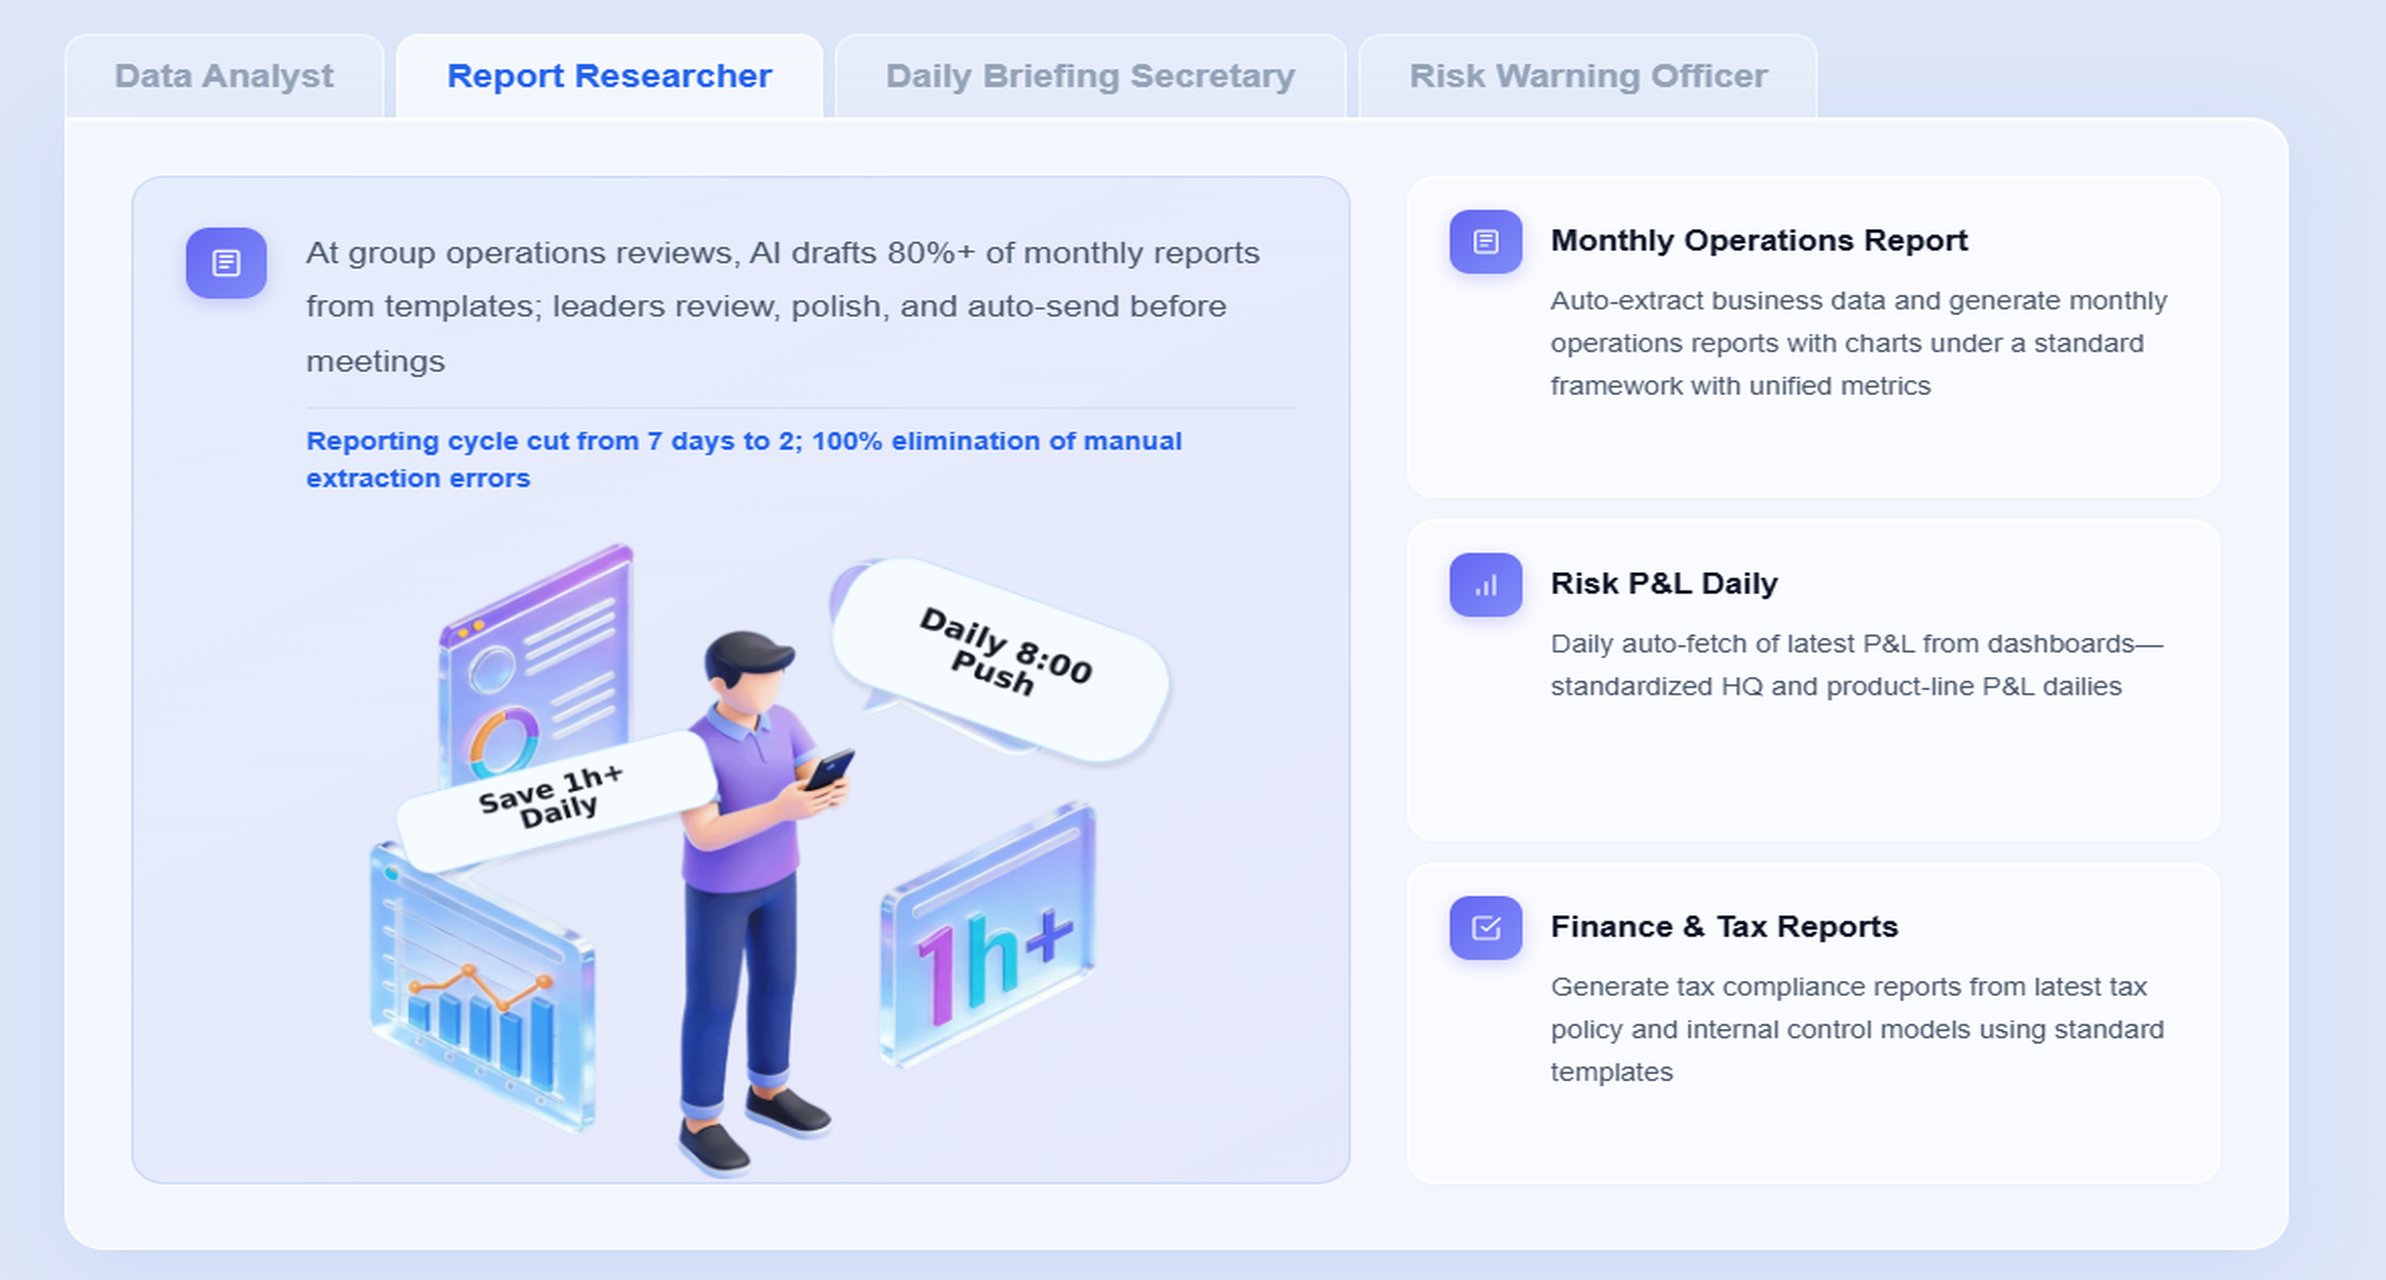
Daily Briefing Secretary for recurring shift and daily production summaries
Risk Alert Officer for downtime, scrap, and threshold breach monitoring
Dora does not replace FineReport. FineReport remains the trusted reporting and operational cockpit foundation. Dora adds the governed AI assistant layer that helps users ask questions in chat, get structured summaries, receive periodic briefings, and follow up on exceptions.
A concrete chat-style example
A production manager could ask:
“Summarize today’s production report for Plant A. Highlight lines below output target, list the top downtime causes, show scrap issues above threshold, and tell me which items need next-shift follow-up.”
That is a much more natural workflow than opening several sheets, checking trend charts manually, then writing a summary in email or chat.
A typical Dora workflow for daily production reporting
Retrieve trusted FineReport report or operational cockpit data. Dora accesses the approved production report, downtime log, scrap summary, and shift handoff view built in FineReport.
Understand KPI definitions, report templates, filters, and business rules. Dora uses the governed semantic layer behind the report, including definitions of output, scrap, downtime, thresholds, and responsible roles.
Generate a structured report summary through chat. Dora returns a readable summary such as output attainment by line, downtime drivers, quality losses, and unresolved shift issues.
Detect exceptions and threshold breaches. Dora identifies abnormal changes, overdue actions, repeated downtime causes, or scrap levels that exceed expected limits.
Push alerts and summaries to the right users.
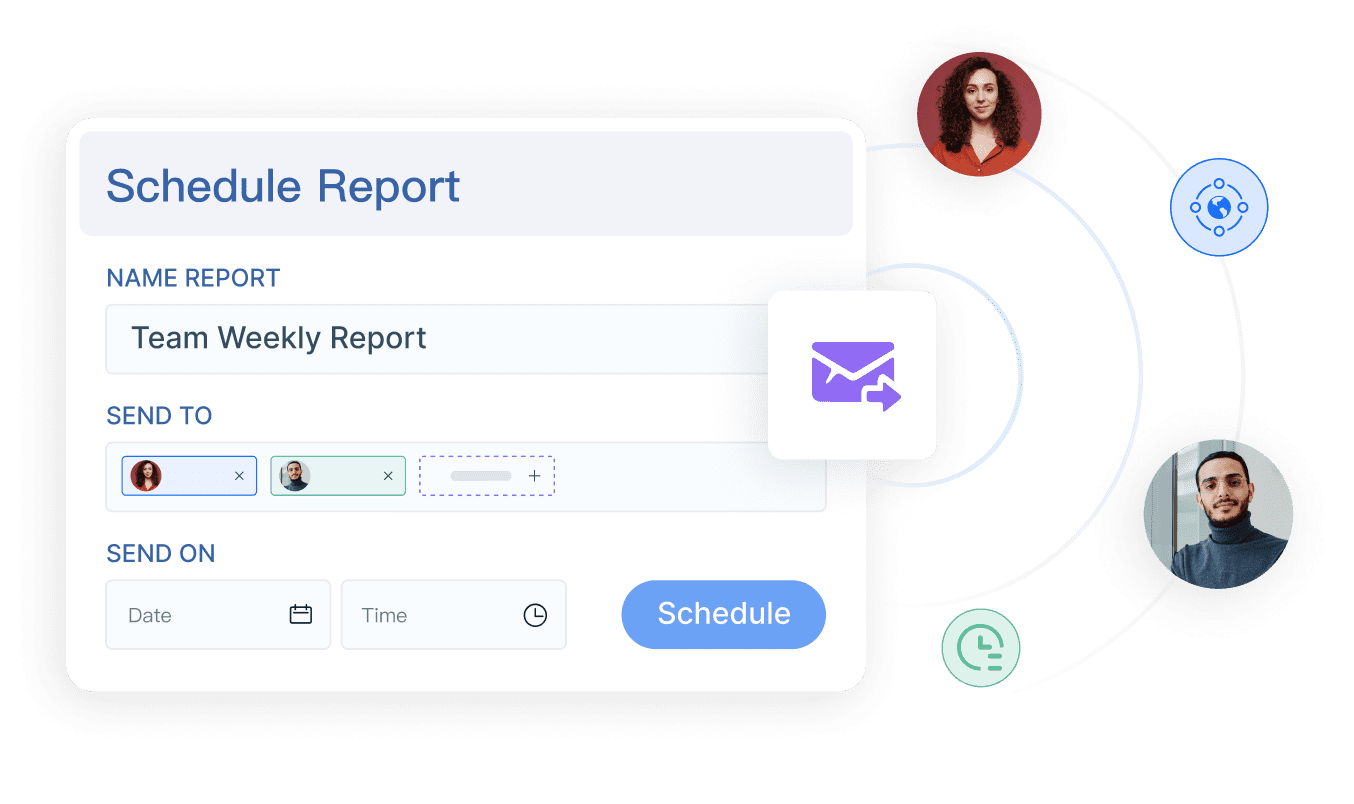
The Daily Briefing Secretary or Risk Alert Officer can send scheduled production briefings, downtime alerts, or scrap escalations to supervisors, managers, quality, or maintenance owners.
Produce follow-up records and periodic reviews. Dora can create daily or weekly review summaries so managers can track whether exceptions were closed and whether recurring issues are improving.
Why FineReport matters in this AI workflow
AI only helps enterprise reporting when the underlying reporting layer is trusted.
That foundation is what allows Dora to return more reliable, controllable answers. Without a trusted report layer, AI tends to become a loose interpretation tool. With FineReport, Dora works as Agentic BI: natural-language request, trusted semantic layer, governed query or Skill execution, then summary, answer, alert, and follow-up.
For executives, the value is straightforward: Dora is not an AI experiment. It is a landed digital employee for recurring reporting work such as daily production summaries, downtime review, scrap alerting, management briefings, and owner follow-up.
For IT and data teams, the role shifts from manually producing every summary to improving data connection, KPI governance, semantic setup, permissions, report templates, and reusable AI Skills.
For business users, Dora reduces the friction of report consumption. Teams get:
natural-language query over trusted reporting assets
chat-based answers about production metrics
structured report summaries instead of raw tables only
scheduled daily or weekly briefings
exception alerts and push notifications
follow-up reminders tied to operational ownership
This also tends to land better in enterprises than feature-only agent comparisons. Dora is designed for governed AI workflows with Skills-based execution, which is more controllable and auditable than raw prompt-only agents. That matters in manufacturing environments where KPI definitions, permission boundaries, and data quality cannot be optional.
Common reporting mistakes and how to avoid them
Many weak reports fail not because the template is missing columns, but because the logic behind the numbers is unclear.
Common mistakes include:
Mixing production counts with shipment counts or incomplete unit definitions
If one team reports produced units and another reports shipped units, the report loses operational meaning. Define exactly what counts as output.
Logging downtime without cause categories or action ownership
Downtime totals alone do not support improvement. Add cause codes, owners, and corrective actions.
Reporting scrap totals without defect detail or source process
A total scrap number may show cost impact but not the cause of the loss. Always capture defect category and source stage.
Creating a report that is too detailed for operators and too vague for managers
The form should be quick to complete but strong enough to support escalation. Use coded fields and layered views.
Failing to separate planned stoppages from unplanned losses
If scheduled maintenance and machine failure are mixed together, performance analysis becomes misleading.
Ignoring shift handoff and unresolved issues
A daily report without follow-up ownership often repeats the same issues across shifts.
The best prevention is to design the report around decisions, not around data collection alone.
How to roll out the template and improve performance over time
A production report process improves through use, not through one perfect first version.
Start with one line or one department
Begin with a pilot. Choose one line, one cell, or one department where supervisors are willing to test the template seriously.
During the pilot:
collect feedback from users
remove fields nobody uses
clarify unclear definitions
test cause code lists
confirm sign-off timing
verify whether managers can actually act from the report
This avoids a plant-wide rollout of a poorly designed format.
A report only matters if it drives discussion and action.
Use it in:
shift handoff meetings
daily production meetings
tier meetings
quality review huddles
maintenance escalation routines
This is where the value of FineReport operational cockpits becomes clear. Teams can move from static file review to a consistent dashboard-style analysis view. Then Dora can support that routine by generating a structured pre-meeting summary, highlighting exceptions, and pushing the relevant actions before the meeting starts.
Upgrade from a basic template when needed
A spreadsheet-based production report template is a good starting point. But it becomes limiting when:
multiple shifts update the file
plants need standardized reporting
approvals must be tracked
downtime and scrap logs must roll up automatically
At that stage, moving to a connected reporting system is less about software replacement and more about operational control.
Actionable Best Practices
Here are practical steps that make a daily production report work in real manufacturing environments.
1. Standardize report templates, KPI definitions, and exception rules
Use one governed structure for output, downtime, scrap, rework, and shift notes. Define thresholds for exception highlighting so teams know what requires escalation.
2. Build a semantic layer inside the reporting workflow
This is essential for scalable AI use. FineReport can serve as the trusted reporting foundation, while Dora uses those report definitions, filters, business terms, and KPI rules to generate more consistent summaries and answers.
3. Treat data quality as part of the AI implementation
Dora can only summarize what the enterprise has defined and governed. If machine names, defect categories, or line codes are inconsistent, AI output will reflect that inconsistency. Clean master data and clear business definitions are part of the rollout, not an afterthought.
4. Start with high-value recurring reports
Do not try to automate every shop floor report at once. Start with the most repeatable, high-value scenarios such as daily production summary, downtime exception review, scrap alerting, or morning management briefing.
5. Preserve permission governance and human review
AI outputs should respect FineReport access boundaries. Also keep human review for AI-generated management narratives in early rollout stages. As users trust the workflow, expand Dora Skills and automation gradually.
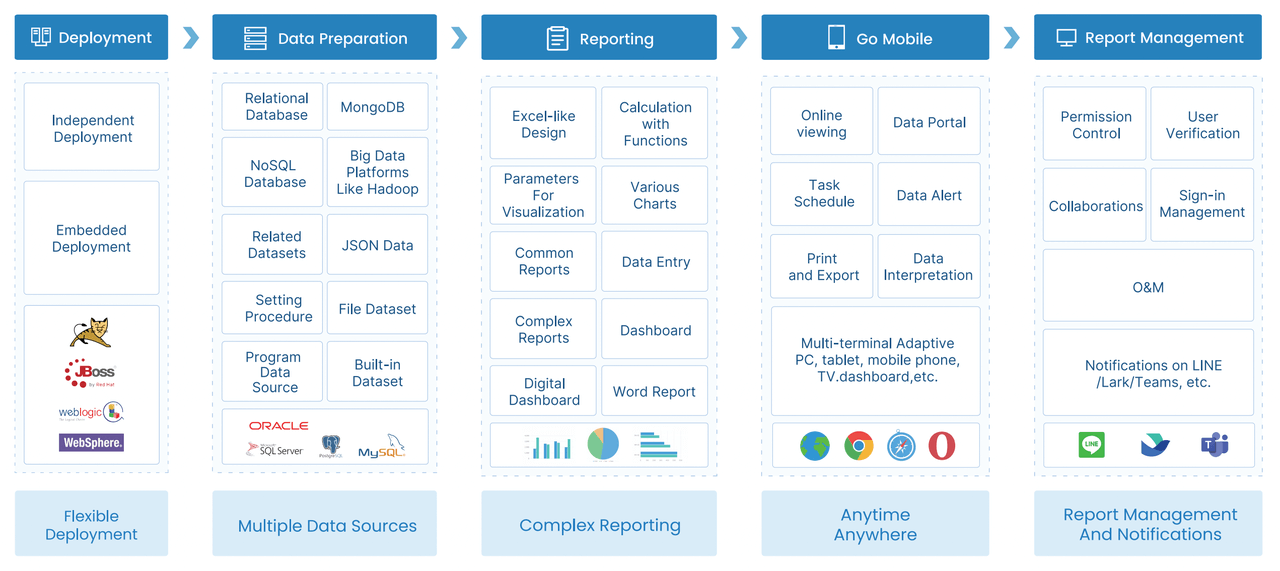
Building this manually is complex. FineReport helps teams standardize trusted reports, operational cockpits, templates, and reporting workflows. Dora turns those assets into an AI assistant that can answer report questions in chat, generate structured summaries, push scheduled briefings, monitor exceptions, and follow up with responsible owners.
This is especially useful when enterprises want to move from “people manually preparing reports” to “AI helping people query, summarize, report, push, alert, and follow up.”
FineReport + Dora is not only a reporting upgrade; it is a practical fourth-generation Agentic BI path. FineReport provides governed reports and operational cockpits. Dora provides the AI assistant layer for scenario execution, with more controlled Skills, lower token waste, faster execution paths, and more stable workflows than prompt-only agents.
Get Ready-to-Use Dashboard Templates in Fine Gallery
The strongest Dora pitch is scenario + product + service: FineReport provides the trusted reporting foundation, Dora provides the AI digital employee, and implementation service connects data, governance, semantic setup, Skills, report templates, permissions, and rollout.
If you need a production report template today, start with a simple daily format that tracks output, downtime, scrap, and shift accountability. If you need that process to scale across lines, plants, and management routines, build it on a trusted reporting foundation and upgrade report consumption with an enterprise Data Agent.
A useful daily production report should capture planned versus actual output, downtime, scrap or defects, rework, shift details, and follow-up actions. It should also show owners and status so teams know what needs attention next.
A production schedule shows what is supposed to happen, while a production report records what actually happened. The report helps teams compare plan versus execution and respond to gaps quickly.
Production supervisors, plant managers, quality teams, maintenance leads, and operations leaders all use it. Each group relies on the report to monitor performance, investigate losses, and coordinate actions across shifts.
Downtime tracking explains why output was lost, not just how much was missed. When teams record duration, cause, asset affected, and corrective action, they can prioritize maintenance and prevent repeat stoppages.
Yes, FineReport and Dora can help teams summarize trusted report data, answer production questions in chat, and send scheduled briefings or exception alerts. This reduces manual review and makes daily decisions faster.
Product Trial
FineReport
Pixel-perfect reports · Interactive dashboards · Easy data entry · Digital twins