A real-time dashboard is a visual interface that displays live data updates, helping you track key metrics and trends as they happen. You use it to monitor business performance and respond quickly to changes. When you build a real-time dashboard, you gain the power to make data-informed decisions and improve data-driven decision-making. Modern BI tools like FineBI simplify this process. FineBI offers instant visual dashboards, AI-driven insights, and automated dashboard generation, making it easy for both technical and non-technical users to create and explore dashboards efficiently.
Define Goals and Metrics for Your Real-Time Dashboard
Set Dashboard Objectives
You need to start by defining the main purpose of your real-time dashboard. Ask yourself what business problem you want to solve and who will use the dashboard. For example, in manufacturing, you may want to monitor product quality and reduce defect rates. In logistics, you may want to track shipment status and delivery times. A clear objective helps you focus on the right data and design a dashboard that delivers value.
Real-time dashboards offer unmatched visibility and actionable insights across all operations, empowering teams to make informed decisions and address challenges proactively.
Consider the most common objectives for enterprise dashboards:
| Objective | Description |
|---|---|
| Time-saving | Automates data collection and reporting, allowing teams to focus on analysis. |
| Increased productivity | Streamlines workflows, leading to improved efficiency. |
You can also aim for faster decision-making, improved operational efficiency, enhanced customer experience, and proactive problem-solving.
Choose Key Metrics and KPIs
Once you set your objectives, select the key metrics and KPIs that reflect your goals. KPI tracking involves collecting and monitoring critical performance metrics through data analytics tools. In manufacturing, you might track defect rates, scrap rates, and qualification rates. In logistics, you might monitor delivery times, cargo volumes, and customer satisfaction scores.
Follow these steps to choose the right metrics:
- Define your organizational goals and strategies.
- Identify KPIs that show progress on these goals.
- Select supporting metrics for deeper insights.
- Set targets for each KPI.
- Monitor and analyze KPIs regularly.
- Optimize your approach based on what you learn.
KPI management means you establish, measure, and analyze indicators that matter for decision-making and strategic goals. When you create a report, make sure it highlights these metrics clearly.
Identify Stakeholders and Use Cases
You should identify who will use the dashboard and how they will benefit. Stakeholders often include executives, finance teams, project managers, and operations staff. Each group needs different information and views.
| Stakeholder Group | Primary KPIs | Dashboard Focus |
|---|---|---|
| Executives | Revenue growth, market share | High-level trends, strategic alerts |
| Finance Teams | Cash flow, expense ratios | Detailed financials, forecasts |
| Project Managers | Task completion, resources | Timeline tracking, milestone status |
| Operations | Daily output, error rates | Real-time status, process alerts |
Define use cases for each group. For example, executives may want to see overall business trends, while operations teams need real-time alerts for production issues. When you create a report, tailor it to the needs of each stakeholder.
Success means your real-time dashboard delivers timely, relevant insights to the right people, helping them make better decisions.
Connect Data Sources in Real-Time Dashboard with FineBI
A real-time dashboard relies on accurate and timely data. You need to connect your dashboard to real-time data sources to ensure you always see the latest information. Most organizations use a mix of databases, APIs, and files to store business data. You can integrate these sources to create a unified view for your dashboard.
Integrate Databases and APIs
You start by identifying the real-time data sources you want to use. These may include SQL databases, cloud data warehouses, and RESTful APIs. Connecting to these sources allows your dashboard to display live updates. For example, you might use a MySQL database for sales data and an API for shipment tracking. You can also upload files like Excel or CSV for additional insights.
| Feature | Description |
|---|---|
| Real-time data processing | FineBI processes data in real-time, allowing for immediate updates and insights. |
| Integrated ETL tools | The platform includes tools for data preparation, enhancing integration capabilities. |
| Robust data modeling features | FineBI offers strong data modeling capabilities, supporting complex data structures. |
FineBI supports over 60 connectors, making it easy to bring together all your real-time data sources. You can schedule updates or fetch data instantly, depending on your needs.

Set Up Real-Time SQL Dashboard Connections
You can set up a real-time sql dashboard by linking your dashboard directly to SQL databases. FineBI lets you create connections to MySQL, PostgreSQL, SQL Server, and more. You select the tables and fields you want to analyze. You can also use SQL queries to customize your data views. This setup ensures your dashboard reflects the latest changes in your database. You can monitor KPIs, track trends, and respond quickly to new data.
Ensure Data Security and Permissions
You must protect sensitive information when connecting real-time data sources. FineBI provides role-based access control, so you decide who can view or edit each dashboard. You can mask confidential data and set permissions by department or user role. Always use secure connection methods, such as SSL, and review user activity regularly. These practices help you maintain data integrity and compliance while using a real-time sql dashboard.
A real-time dashboard with secure, integrated data sources gives you the confidence to make informed decisions. FineBI streamlines this process, supporting both real-time and scheduled updates for any dashboard.
Prepare and Process Data in Real-Time Dashboard for Real-Time Analysis
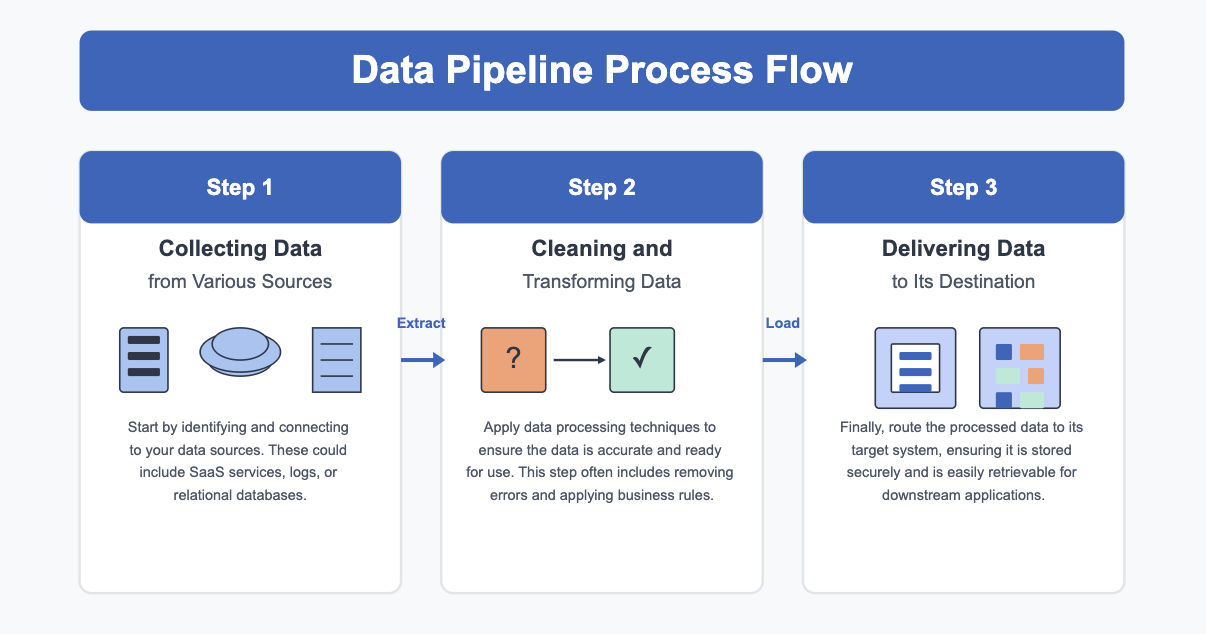
A real-time dashboard depends on clean, unified, and well-structured data. You need to prepare your data before you build a dashboard. FineBI provides visual ETL and ELT tools that help you create a reliable real-time data pipeline. These tools let you clean, transform, and organize your data for analysis.
Clean and Transform Data in FineBI
You can use FineBI’s data cleaning techniques to improve data quality. These techniques help you detect and correct errors, inconsistencies, and inaccuracies. You can use tools like FineDataLink and FineBI to streamline the cleaning process and keep your datasets up-to-date. FineBI’s high-performance computing engine processes large datasets efficiently, supporting real-time analysis for your dashboard.
Tip: Clean data prevents misleading results and ensures your real-time dashboard delivers accurate insights.
Common data cleaning actions in FineBI:
- Remove duplicate records
- Standardize field names and formats
- Handle missing or null values
- Correct data type mismatches
Build Self-Service Data Sets
You can create self-service data sets in FineBI to support your real-time data pipeline. Select relevant tables and fields, join data from multiple sources, and add calculated fields for custom metrics. Apply filters to focus on the most important information for your dashboard. You can preview results at any time to confirm your data set meets your needs.
| Step | Action |
|---|---|
| Select Fields | Choose columns for analysis |
| Join Tables | Combine data from different sources |
| Add Calculations | Create new metrics with formulas |
| Apply Filters | Focus on key records |
Optimize Data for Speed and Accuracy
You need to optimize your real-time data pipeline to handle large datasets and maintain dashboard performance. FineBI uses strategies like granularity limits, time limits, and incremental updates. You can control global memory usage, restrict Excel exports, and configure HTTP2 for more concurrent requests. FineBI supports direct connection and extraction modes. Direct connection gives you high data quality and timeliness. Extraction mode helps you manage large datasets by using BI server resources.
Note: Unified data ensures your real-time dashboard provides consistent and trustworthy insights across all business areas.
A well-prepared real-time data pipeline helps you build dashboards that deliver fast, accurate, and actionable insights.
Build a Real-Time Dashboard in FineBI

You can build a real-time dashboard in FineBI using an intuitive drag-and-drop interface. This process allows you to create a dashboard that displays live visualization of your most important metrics. You do not need advanced technical skills to get started. FineBI provides tools that help you add charts, tables, and filters quickly. You can arrange these components to design a dashboard that fits your business needs.
Use Drag-and-Drop Visualization Tools
FineBI’s drag-and-drop tools make it easy to build a real-time dashboard. You can manage dashboard components without writing code. Start by dragging fields from the data area to the analysis area. Choose the chart type that best represents your data, such as bar charts, line charts, or pie charts. You can filter component data to focus on specific information.
Key features of FineBI’s drag-and-drop visualization tools include:
- Drag-and-drop functionality for easy management of dashboard components.
- Options to set graphic properties, such as color gradients and value formats.
- Ability to create and customize legends based on data fields.
- Tools to arrange components into a cohesive dashboard layout.
To create a dashboard, follow these steps:
- Drag fields from your data area to the analysis area.
- Select and configure the chart type you want.
- Filter the data for each component as needed.
This approach helps you build a real-time dashboard that updates as your data changes. You can monitor trends and track KPIs in one place.
Add Real-Time Filters and Interactivity
You can enhance your dashboard by adding real-time filters. Filters let you and other users interact with the dashboard and focus on the data that matters most. FineBI allows you to add filter components that control the entire dashboard. You can filter by time, value, or other criteria.
Real-time filters improve user interactivity in several ways:
- They enable users to apply specific values and refine results, moving beyond surface-level analysis.
- Filter components allow dynamic filtering of the dashboard based on different criteria.
- Users can choose from multiple filtering types, such as Filter Component or Filter Detail, to adjust the data displayed.
When you build a real-time dashboard with these filters, you give users the power to explore data from different angles. This flexibility leads to deeper insights and better decision-making.
Tip: Use real-time filters to help stakeholders find answers quickly without changing the underlying data set.
Customize Layout and Appearance
FineBI gives you many options to customize the layout and appearance of your dashboard. You can set a unified style for all dashboards using the BI Global Style feature. Admins can add up to five custom global styles and apply them to different dashboard elements. You can also beautify individual chart components by adjusting styles for axes, grid lines, legends, and more.
Customization options include:
- Setting axis, grid line, legend, and title display styles.
- Changing the background and interaction properties.
- Using style thumbnails to view pre-defined and custom styles.
- Previewing effects to see how changes look on dashboard components.
These features help you create a dashboard that matches your brand and improves readability. FineBI’s responsive design ensures your dashboard looks good on desktops, tablets, and smartphones. You can build a real-time dashboard that adapts to any device and provides a consistent user experience.
Note: A well-designed dashboard makes it easier for users to understand data and take action.
When you build a real-time dashboard in FineBI, you combine powerful visualization tools, interactive filters, and flexible customization. This process helps you create a dashboard that delivers live visualization and actionable insights for your team.
Publish, Share, and Monitor Your Real-Time Dashboard
After you build your real-time dashboard, you need to make sure the right people can access it securely. FineBI gives you powerful publishing and governance features that help you control who sees your dashboard and how they interact with it. You can manage permissions, monitor performance, and keep your dashboard up to date for ongoing value.
Securely Share Dashboards with Stakeholders
Sharing your dashboard with stakeholders is essential for collaboration and decision-making. FineBI lets you set detailed permissions for each dashboard, so you control who can view, edit, or export data. Admins can manage sharing settings and restrict access based on roles or departments. By default, all users can share dashboards, but you can limit this to prevent data leaks.
| Best Practice | Description |
|---|---|
| Permission Control | Control who can share dashboards and with whom to prevent data leaks. |
| Admin Management | Admins manage sharing permissions and ensure data visibility aligns with roles. |
| Default Settings | All users can share dashboards by default, but admins can restrict sharing. |
You should organize dashboards in directory nodes that match your company’s structure. Keep directory levels simple and confirm publication requests with business administrators. This approach helps you maintain security and clarity.
Monitor Real-Time Updates and Performance
Monitoring your real-time dashboard ensures it delivers fast and accurate insights. FineBI provides performance analysis tools that help you identify and resolve issues during dashboard previewing and editing. You can view core performance information online and check query details to find the cause of any slowdown.
| Feature | Description |
|---|---|
| Performance Analysis | Identifies and resolves performance issues during dashboard previewing. |
| Core Info | Displays core performance analysis information online. |
| Query Details | Lets you check query details to confirm and correct performance issues. |
Regular monitoring helps you keep your dashboard responsive and reliable. You can adjust data connections or optimize queries to improve speed.
Maintain and Update Your Dashboard
To keep your real-time dashboard valuable, you need to maintain and update it regularly. FineBI supports automatic refreshing of dashboards using JavaScript files. Place a refresh.js file in the FineBI installation directory and call it to enable timed refreshes. Adjust the refresh interval based on how often your data updates. If your data does not update every second, set the interval to more than five minutes.
Tip: Review your dashboard content and permissions often. Update metrics and visualizations as your business needs change. This practice ensures your dashboard continues to deliver relevant and actionable insights.
A well-maintained real-time dashboard helps your team stay informed and make better decisions. FineBI’s publishing, sharing, and monitoring features give you the tools to manage dashboards efficiently and securely.
You can build a real-time dashboard in FineBI by following a clear, step-by-step process. FineBI addresses common challenges like data validation and stream latency, making your dashboard reliable and efficient. Advanced features such as AI-driven analytics provide predictive insights and empower you to create self-service dashboards:
| Feature | Benefit |
|---|---|
| Predictive insights | Improve planning by forecasting outcomes and trends. |
| AI-powered algorithms | Uncover trends and optimize strategies. |
Explore FineBI’s resources and start your own project to experience these benefits firsthand.

Continue Reading About Real-Time Dashboard
Best Dashboard Apps for Business Insights
What is a Call Center Dashboard and Why Does It Matter
What is a Reporting Dashboard and How Does it Work
What is An Interactive Dashboard and How Does It Work
What is a Call Center Metrics Dashboard and How Does It Work


FAQ

The Author
Lewis
Senior Data Analyst at FanRuan
Related Articles

Portfolio Reporting for PMOs: 9 Executive Metrics Every Weekly Portfolio Dashboard Should Include
Weekly portfolio reporting should help executives answer three questions fast: Are we delivering the right initiatives, are we putting outcomes at risk, and what decisions need leadership this week? For PMOs, that means
Yida Yin
Jul 01, 2026

How to Build an Investment Portfolio Reporting Dashboard for Executives: KPIs, Benchmarks, and Drill-Down Views
Investment portfolio reporting for executives is not about showing every holding, transaction, and chart your investment team can produce. It is about giving CEOs, CFOs, CIOs, boards, and investment committees a fast, re
Yida YIn
Jun 25, 2026

12 KPI Reporting Examples for Executive Dashboards: What to Show in Weekly, Monthly, and Quarterly Reviews
Executive leaders do not need more data. They need decision ready $1 examples that match how often they review the business and what actions they are expected to take. A weekly $1 should surface fast moving risks and per
Yida YIn
Jun 25, 2026