You can build your first trading dashboard, even if you’re new to data analysis. Many beginners feel overwhelmed by too much data or get stuck with complicated tools. Here are a few things that trip up most people starting out:
You see so much real-time data that it gets confusing.
You need a simple interface that doesn’t make you feel lost.
You don’t need coding skills. Just follow some practical steps and learn by doing. Real examples will show you best practices along the way.
What Is a Trading Dashboard?
A trading dashboard is a visual workspace that brings together real-time market data, performance analytics, and trading tools so you can monitor, analyze, and act on financial information—all in one place, without feeling overwhelmed.
Key Benefits for Beginners
When you start using a trading dashboard, you get a clear view of your trading world. You don’t have to jump between different apps or spreadsheets. Everything you need sits right in front of you. Here’s a quick look at how it helps:
Learn new skills and boost your trading knowledge.
Customizable alerts
Get notified when something important happens in the market.
Integrated order management
Place and manage trades quickly and easily.
You’ll also find that logging your trades keeps you accountable. Charts and summaries help you spot patterns and avoid repeating mistakes. When you see your progress over time, you understand your growth and can adjust your strategy.
Tip: Start simple. Focus on just a few key charts or alerts. You can always add more as you get comfortable.
Common Use Cases in Finance and Manufacturing
You might wonder where trading dashboards fit in real business. In finance and manufacturing, people use them every day to keep things running smoothly. Here are some of the most common ways you’ll see them in action:
Track high-level KPIs and financial health with executive summaries.
Visualize differences between budgets and actual results for better forecasting.
Monitor cash flow from different activities to keep an eye on liquidity.
Analyze investment portfolios to see what’s working and what needs attention.
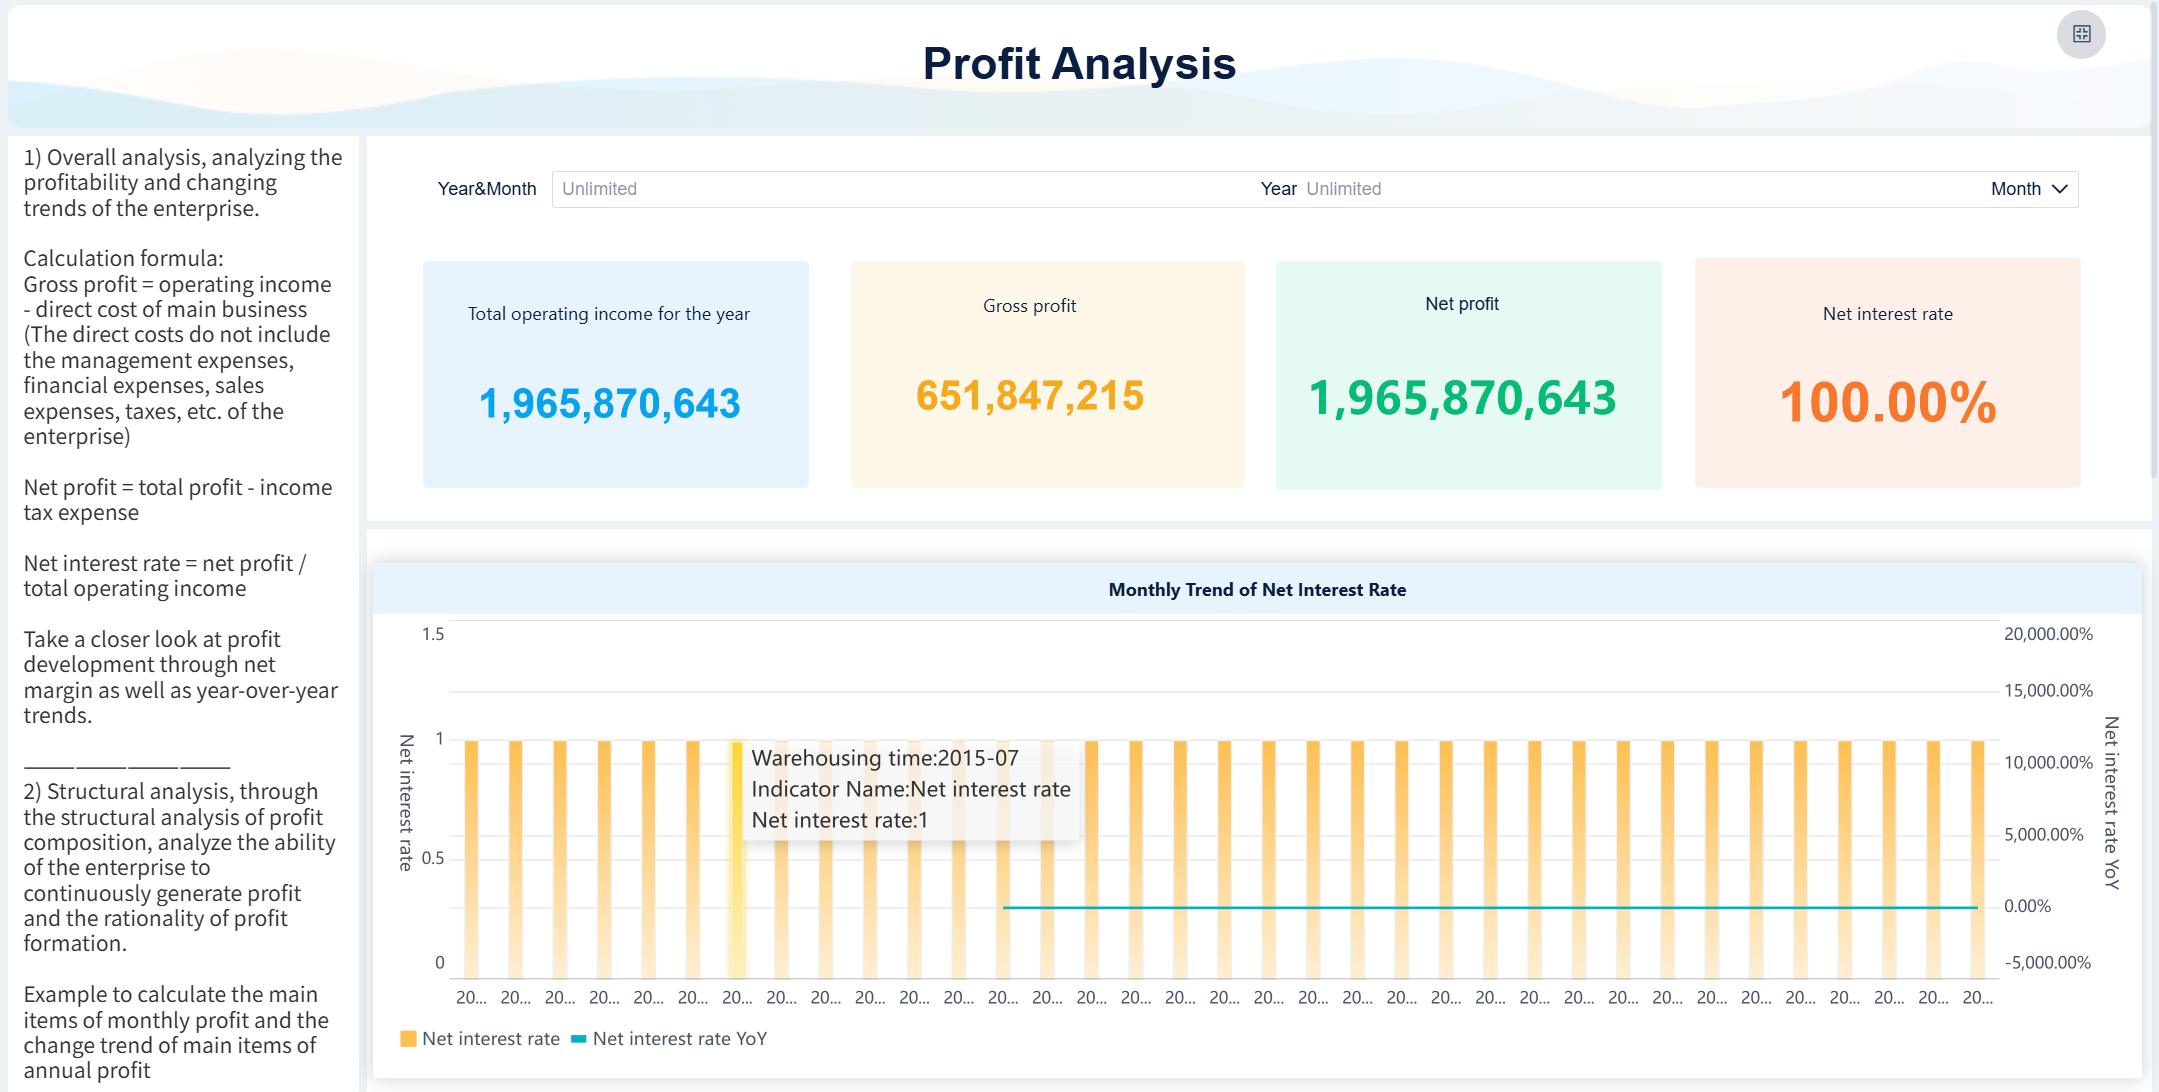
Trading Dashboard created by FineBI (Click to Engage)
No matter your industry, a trading dashboard helps you stay on top of your numbers and make decisions with confidence.
Essential Features for Your Trading Dashboard
Must-Have Components
When you build your first trading dashboard, you want it to be both powerful and easy to use. Let’s break down the core features you should look for:
Real-time Data Integration You need to see the latest market data as it happens. This helps you react quickly to changes and make smarter moves.
Customizable User Interface You should be able to arrange your dashboard the way you like. Move charts, tables, and widgets around so your most important info is always front and center.
Interactive Data Visualizations Charts and graphs make complex data easy to understand. You can spot trends, compare numbers, and dig deeper with just a few clicks.
Technical Analysis Tools Tools like moving averages or RSI help you analyze market conditions and predict what might happen next.
News and Alerts Set up custom alerts so you never miss important news or price changes. These notifications keep you ahead of the game.
Portfolio Management See how your investments are doing at a glance. This feature helps you track performance and make better decisions.
Tip: Start with just a few of these features. You can always add more as you get comfortable.
Choosing the Right Platform (FineBI)
You want a platform that makes dashboard creation simple, even if you’re not a tech expert. FineBI stands out for beginners because of its self-service, drag-and-drop interface. You can build interactive dashboards without writing a single line of code. Just drag the charts and data you need onto your workspace.
FineBI also lets you analyze data in real time and visualize results instantly. You don’t have to wait for IT support or learn complicated tools. This independence means you can explore your data and find insights on your own schedule.
Compared to other tools, FineBI focuses on making analytics accessible. While some platforms require advanced skills or lots of setup, FineBI keeps things straightforward. If you want to get started quickly and grow your skills over time, FineBI is a great choice.
Data Integration and Setup with FineBI
Connecting Data Sources
You want your trading dashboard to pull in all the data you need, right? FineBI makes this easy. You can connect to databases like MySQL, Oracle, or SQL Server. If you have data in Excel or CSV files, just upload them. Need real-time info from web APIs? FineBI handles that too. You don’t have to worry about complicated setups. The platform offers over 60 built-in connectors, so you can bring together data from different places in just a few clicks.
FineBI also supports cloud data warehouses and big data platforms. This means you can track trading activity, market trends, or even manufacturing KPIs without switching tools. You get a unified view, which helps you make faster decisions.
Tip: Start by connecting only the sources you need for your first dashboard. You can add more as you grow.
Preparing Data for Analysis
Once your data is connected, you need to get it ready for analysis. FineBI gives you a visual workflow, so you can clean, join, and shape your data without writing code. You can select fields, merge tables, and create new metrics using simple drag-and-drop actions.
Here are some best practices for preparing your data in FineBI:
Best Practice
Description
Data Development Module
Use FineBI’s module for powerful data preprocessing.
Low-Code Approach
Cleanse data visually from different sources.
ELT/ETL Dual-Core Engine
Standardize and clean data with high-performance processing.
Security matters, especially in finance and manufacturing. FineBI helps you protect sensitive information and stay compliant. You get dynamic row-level security, detailed audit logs, and user management that works with enterprise systems like LDAP and SAML. On-premise deployment gives IT teams full control over the environment.
Feature
Description
Dynamic Row-Level Security
Controls access based on user roles.
Detailed Audit Logs
Tracks user activity for compliance.
User Management
Integrates with identity providers for easy access control.
On-Premise Deployment
Lets IT teams manage security directly.
With these tools, you can build a dashboard that’s both powerful and secure. You’ll spend less time worrying about data quality and more time focusing on trading insights.
How to Create a Dashboard in FineBI
Ready to build your first trading dashboard? FineBI makes the process easy, even if you’re new to data analysis. You don’t need to know python or have technical skills. Let’s walk through each step together.
Building Your Layout
You start by opening FineBI and choosing to create a dashboard. The workspace appears, and you see a blank canvas. You can drag and drop components onto this canvas. Move charts, tables, and widgets wherever you want. Arrange them so your most important trading data is front and center.
Want to keep things tidy? Resize each component by dragging its borders. You can add tabs for different views, like daily performance or risk analysis. FineBI’s responsive design means your dashboard looks great on any device—desktop, tablet, or phone. You don’t have to worry about adjusting layouts for different screens.
Tip: Place your most-used charts at the top. Keep summary widgets close by for quick checks.
Adding Charts and Widgets
Now it’s time to bring your data to life. FineBI offers a wide range of charts and widgets. You can choose from pie charts, 3-in-1 statistics, or 4-in-1 statistics. These help you track win rates, profit factors, and other key metrics.
Widget Type
Description
Pie Chart
Displays statistics that can be split into parts, such as winrate and profit factor.
3-in-1 Statistics
Combines three related statistics into a single compact widget for easier viewing.
4-in-1 Statistics
Similar to the 3-in-1, but includes four statistics, useful for performance metrics.
You drag your chosen chart onto the dashboard. Next, select the data fields you want to visualize. FineBI lets you filter data in real time. Add filter components so you can change parameters and see instant updates. For example, you might filter by date, asset type, or trading strategy.
Real-time filtering lets you pass values and see results instantly.
Responsive design adapts your dashboard to any screen size.
You can also add other components, like images or text boxes, to give context or highlight important notes.
Customizing and Publishing
Once your dashboard looks good, you can customize styles. Change colors, fonts, and backgrounds to match your preferences. Preview your dashboard to see how it appears to others.
When you’re ready to share, FineBI makes publishing simple. You can publish your dashboard for your team or organization. If you don’t have management permission, your publication request goes to an admin for approval. Only users with assigned permissions can view published dashboards. You’ll see a message when your dashboard is live. If you need to make changes, you can cancel publication before or after approval.
Feature
Description
Role-based access control
Allows administrators to define user roles and permissions for dashboard access.
Row-level security
Ensures that users can only access data that they are authorized to view.
Single sign-on integration
Facilitates user authentication across multiple applications seamlessly.
Audit logging feature
Tracks user activities for compliance and security purposes.
FineBI supports collaboration. You can work with teammates, share dashboards, and control who sees what. Role-based access control keeps sensitive trading data secure. Audit logs track activity, so you know who made changes and when.
FineBI's collaboration
Note: Publishing is flexible. You can unpublish datasets or dashboards if needed, but some actions require admin approval.
You’ve now learned how to create a dashboard in FineBI. You can build layouts, add charts, customize styles, and publish securely. Your trading dashboard will help you track performance, spot trends, and make better decisions.
Optimizing and Using Your Trading Dashboard
Best Practices for Beginners
You want your trading dashboard to work for you, not against you. Keep things simple and actionable. Here are some tips to help you get started:
Remove unnecessary features and widgets. This makes your dashboard easier to use.
Focus on the most important data points. You want quick answers, not clutter.
Give context for each chart or number. This helps you know what action to take.
Minimize latency. Place servers close to users and use efficient hardware.
Update your system regularly. This keeps everything running smoothly and securely.
Use direct market access for faster order execution.
If you want a step-by-step approach, try this:
Start with essential metrics that drive your investment strategy.
Add advanced tools as you gain experience.
Review and maintain your dashboard often. Make sure it stays accurate and relevant.
Tip: You don’t need python skills to keep your dashboard optimized. FineBI handles the technical side for you.
Real-World Example: Founder Securities
Let’s look at how a leading financial company uses FineBI to boost results. Founder Securities adopted FineBI and saw big improvements:
Improvement Type
Description
Adoption of FineBI
Implementation of FineBI tools enhances operational efficiency and user experience.
Employee Engagement
Over 2,000 employees use FineBI monthly, indicating strong data-driven decision-making culture.
Strategic Alignment
Digital transformation aligns with market competition and regulatory pressures.
Focus on Data-Driven Culture
Management emphasizes the need for insights into core processes to boost competitiveness.
Founder Securities built a culture around data-driven decisions. Teams now access dashboards quickly, track key metrics, and respond to market changes faster. The company’s experience shows how a well-designed dashboard can transform your workflow.
Ready to take your dashboard further? FineBI offers advanced features like data alerts for monitoring abnormalities, dashboard beautification, and automatic data refresh. You can share dashboards with different groups and adjust layouts for a better user experience. Try experimenting with these options as you grow more confident.
Note: Keep exploring new features. The more you learn, the more powerful your trading dashboard becomes.
You’ve seen how easy it is to build your first trading dashboard with FineBI. You connect your data, design your layout, and share insights—all without coding. FineBI stands out because:
You get a drag-and-drop interface made for beginners.
You don’t need a technical background to create powerful dashboards.
Start experimenting today. Try new charts, customize your views, and explore more features. If you want extra help, FineBI offers guides and a supportive community. Give it a go and see how much you can achieve!