A restaurant KPI dashboard is a digital tool that displays your most important restaurant metrics in one place, giving you instant insight into your business’s performance. Tracking restaurant KPIs helps you improve efficiency, boost profits, and deliver a better dining experience. See how these metrics make a difference:
KPI
Benefit
Customer Retention Rate
Shows how often guests return, revealing service or product quality issues.
Table Turnover Rate
Tracks service speed, impacting revenue generation.
Gross Profit Percentage
Guides pricing and menu decisions for higher profitability.
Informed decisions become easier.
You spot inefficiencies quickly.
Customer satisfaction rises as you monitor key restaurant data.
What is a restaurant KPI dashboard?
A restaurant KPI dashboard is a digital tool that helps you track and visualize the most important metrics for your restaurant. You use it to see how your business is performing in real time. The dashboard brings together data from different sources, such as your point-of-sale system, inventory management, and financial reports. This unified view lets you monitor restaurant KPIs like sales, costs, and customer feedback without switching between multiple systems.
The main purpose of a restaurant KPI dashboard is to give you instant access to the numbers that matter most. You can spot trends, identify problems, and make quick decisions. For example, you might notice a drop in table turnover rate or a spike in food cost percentage. With this information, you can take action before small issues become big problems. FineReport makes this process simple. You can create and customize dashboards with a drag-and-drop interface, so you do not need advanced technical skills. FineReport connects to many data sources, including Excel and popular databases, which means you can build a dashboard that fits your restaurant’s unique needs.
Restaurant KPI dashboard created by FineReport (Click to Engage)
A restaurant KPI dashboard includes several features that help you manage your restaurant more effectively. Here are the most common features you will find:
Gross Profit Margin
Food Cost Percentage
Labor Cost Percentage
Net Profit Margin
Inventory Turnover
Break-Even Point
Cash Flow
Return on Investment (ROI)
Accounts Receivable Aging
Debt Service Coverage Ratio (DSCR)
You also get visualizations for key metrics. These include sales performance metrics, such as total sales, average check size, table turnover rate, and sales per cover. Cost management metrics, like cost of goods sold and labor cost percentage, help you keep expenses under control. The dashboard displays these numbers using charts, graphs, and tables, making it easy to understand your restaurant’s performance at a glance.
Tip: Use the dashboard to compare online and dine-in sales. This helps you see which revenue streams are growing and where you might need to adjust your strategy.
How restaurant KPI dashboards work
A restaurant KPI dashboard works by collecting data from different systems and presenting it in one place. You connect your POS system, CRM software, customer feedback platforms, and financial reports to the dashboard. Here is a table showing common data sources:
Data Source
POS systems
CRM software
Customer feedback platforms
Financial reports
Many restaurants use several systems, such as inventory management and labor scheduling, to run daily operations. The dashboard integrates these systems, so you do not have to check each one separately. You get a complete picture of your restaurant’s health.
The dashboard updates data in real time. You see live information from your POS and inventory management systems. This means you can react quickly to changes, like order surges or kitchen bottlenecks. You can adjust staffing or inventory on the spot. The dashboard also helps you identify issues, such as slow ticket times, so you can reallocate resources and keep customers happy.
Restaurant KPI dashboards consolidate data reporting systems into a single interface. You can customize reports and spot causes of profit loss, such as theft or inventory mismanagement.
POS systems provide real-time updates, which help you forecast inventory needs and evaluate menu performance.
FineReport stands out because it is easy to use and highly customizable. You can design complex dashboards without IT help. The drag-and-drop feature lets you build reports quickly. FineReport supports multi-sheet and cross-sheet calculations, which is useful for tracking restaurant KPIs across different locations or departments. You can access your dashboard on any device, including mobile phones and tablets, so you always stay informed.
A restaurant KPI dashboard gives you the power to monitor profitability, control costs, and improve customer satisfaction. You make better decisions because you have the right information at your fingertips.
Why a restaurant KPI dashboard matters
Benefits for restaurant management
You need to manage many moving parts in your restaurant every day. A restaurant KPI dashboard helps you keep track of what matters most. You see your sales, costs, and customer feedback in one place. This saves you time and helps you spot problems before they grow.
Managers use dashboards to automate data collection and get real-time insights. You do not have to wait for end-of-day reports. You see what is happening as it happens. This means you can adjust staffing, inventory, or menu items quickly. You improve efficiency and streamline operations.
FineReport gives you powerful tools for restaurant management. You get real-time data visualization, so you see trends and patterns instantly. You can access your dashboard on your phone or tablet, which means you stay informed even when you are away from the restaurant. Automated reporting lets you schedule daily, weekly, or monthly reports. You spend less time preparing data and more time making decisions.
Restaurant KPI dashboard created by FineReport (Click to Engage)
Using a restaurant KPI dashboard helps you track essential metrics that reflect operational excellence and customer satisfaction. You make informed decisions that boost performance, drive customer growth, and improve retention. This leads to a better dining experience for your guests.
Here are some reasons why restaurant owners and managers consider KPI dashboards essential:
KPI dashboards automate data collection and provide real-time insights.
They offer a visual representation of performance, making it easier to identify trends and issues.
Using restaurant KPIs allows you to make informed decisions and implement effective strategies for success.
Data-driven decision-making is essential for optimizing operations and improving customer satisfaction.
You see measurable outcomes when you use a dashboard. Restaurants with KPI dashboards experience reduced waste, improved margins, better staffing efficiency, higher customer satisfaction, and sustainable growth.
Measurable Outcome
Restaurants with KPI Dashboards
Restaurants without KPI Dashboards
Reduced Waste
Yes
No
Improved Margins
Yes
No
Better Staffing Efficiency
Yes
No
Higher Customer Satisfaction
Yes
No
Sustainable Growth
Yes
No
Restaurant KPI dashboards and better decisions
You make better decisions when you have the right information. A restaurant KPI dashboard gives you a clear view of your business. You track key performance indicators in real time. You see sales, labor, and inventory metrics at a glance. This helps you focus on what drives profitability and customer satisfaction.
KPI dashboards provide a visual representation of important metrics. You monitor restaurant KPIs like table turnover rate, inventory turnover ratio, and customer satisfaction KPIs. You identify bottlenecks and address them quickly. For example, you track table turnover rate to spot slow service. You monitor inventory turnover to reduce waste. You check customer satisfaction scores to improve guest experience. You watch employee turnover rate to keep your team strong.
Metric
Purpose of Tracking
Table Turnover Rate
Identifies bottlenecks in seating and service speed.
Modern dashboards use technologies like cloud computing, APIs, and AI to deliver actionable insights. You get predictive analytics, automated alerts, and mobile access. These features keep you informed and proactive.
Using a restaurant KPI dashboard can supercharge performance. It allows you to track key metrics and make data-driven decisions, focusing on KPIs from all areas of the business; sales, labor, and inventory, which is vital for creating a sustainable business and maximizing profitability.
Case studies show that dashboards lead to faster reporting and analytics insights. For example, Firehouse Subs improved reporting speed and reduced data preparation time. Managers tracked performance metrics more easily and identified areas for improvement. Employees spent less time on manual reporting and more time on other projects.
You see the difference when you use a dashboard. Analytics tools lead to reduced waste, improved margins, better staffing efficiency, higher customer satisfaction, and sustainable growth. You build a stronger restaurant by making decisions based on data, not guesswork.
Essential restaurant KPIs to track
Key restaurant KPIs for performance
You need to track the right restaurant KPIs to understand how your business performs. A restaurant KPI dashboard helps you focus on the most important numbers. These key performance indicators show you where your restaurant stands and where you can improve.
Here are the most important KPIs you should monitor:
Gross Profit: Shows how much money remains after paying for ingredients. A healthy margin means you manage costs well.
Cost of Goods Sold (COGS): Tracks what you spend on food and supplies. This helps you set menu prices and control expenses.
Food Wasted: Measures how much food you throw away. Many restaurants waste up to 10% of their inventory, which hurts profitability.
Net Profit Margin: Tells you how much profit you keep after all expenses. This is vital for reinvestment and growth.
Labor Turnover Rate: Reveals how often staff leave. High turnover can signal problems with management or work environment.
Labor Cost Ratio: Compares labor costs to sales. Keeping this ratio in check supports profitability.
Average Table Occupancy: Tracks how efficiently you use tables, especially during busy times.
You should also watch labor cost percentage, food cost percentage, and revenue per seat hour. These metrics link directly to profitability and growth. When you use a dashboard, you see these numbers in real time and can act quickly.
KPI
Benchmark Range
Food Cost Percentage
28% to 35%
Liquor Cost Percentage
18% to 20%
Bottled Beer Cost
24% to 28%
Draft Beer Cost
15% to 18%
Wine Cost
35% to 45%
Tip: Calculate your table turnover rate by dividing the number of parties served by the total number of tables. For example, if you serve 300 parties with 50 tables, your turnover rate is 6.
Why tracking restaurant KPIs is crucial
Tracking restaurant KPIs gives you a clear view of your business. You measure progress toward your goals and spot areas that need improvement. When you use a restaurant KPI dashboard, you avoid data overload and focus on what matters.
KPIs help you evaluate operational efficiency, monitor financial performance, and reflect customer satisfaction KPIs. You can identify bottlenecks, such as slow preparation times or high food waste, and take action. For example, a restaurant chain used dashboard data to standardize prep times, cutting order fulfillment time by 15%.
You should track key performance indicators like order accuracy, preparation time, and table turnover rates. A dashboard provides visual insights, making it easy to spot trends and recurring issues. When you monitor prime cost weekly and use POS-integrated dashboards, you keep costs in check and maintain profitability.
Focusing on the right performance indicators helps you make data-driven decisions. You improve efficiency, boost customer satisfaction, and grow your restaurant.
Implementing a restaurant KPI dashboard with FineReport
Steps to set up your dashboard
You can set up a restaurant KPI dashboard with FineReport in a few straightforward steps. First, gather your restaurant data from sources like POS systems, inventory records, and customer feedback. FineReport connects to these systems, so you can integrate all your information in one dashboard. Use the drag-and-drop designer to select the KPIs that matter most for your restaurant, such as sales, labor costs, and table turnover rates. Customize the dashboard layout to highlight the metrics that drive profitability. You can add charts, graphs, and tables to visualize trends and spot issues quickly.
Next, configure real-time updates. FineReport allows you to schedule automatic data refreshes, so your dashboard always shows the latest numbers. Set up permissions to control who can view or edit the dashboard. This keeps sensitive restaurant data secure and ensures that managers see only the information relevant to their roles. You can also access your dashboard on mobile devices, making it easy to monitor restaurant performance from anywhere.
Tips for effective use in restaurants
To get the most value from your restaurant KPI dashboard, follow these best practices:
Implement new technology to boost kitchen efficiency and customer satisfaction.
Use digital tools like POS systems and checklist platforms to streamline restaurant operations.
Focus on improving health inspection scores and building customer loyalty through consistent service.
FineReport’s mobile dashboard lets you track KPIs on your phone or tablet. Schedule automated reports to stay updated on restaurant performance without manual effort. Assign permissions so each team member sees the data they need. This helps you maintain high standards and respond quickly to changes.
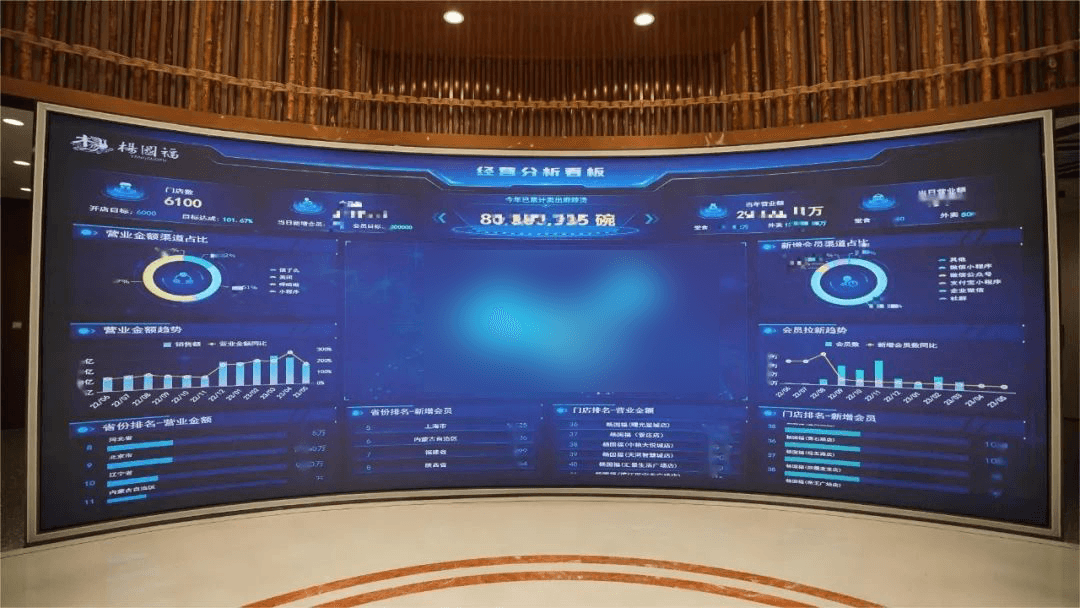
The YangGuoFu restaurant chain used FineReport to unify data across thousands of locations. Managers gained real-time insights into sales and supply chain performance. They improved menu offerings and increased profitability by acting on dashboard data. You can achieve similar results by customizing your dashboard and acting on the insights it provides.
Tip: Review your dashboard daily to catch trends early and make proactive decisions that support restaurant growth.
You drive growth and efficiency when you use a restaurant KPI dashboard. FineReport helps you track financial, customer, operational, and marketing metrics in your restaurant. You see how net profit margin, table turnover time, and digital order share impact your restaurant’s success. The dashboard lets you measure customer loyalty and improve restaurant operations. You make smarter decisions and boost your restaurant’s performance.
KPI Type
Examples
Impact on Restaurant Growth
Financial Metrics
Net profit margin, COGS
Monitor stability and profitability
Customer Metrics
CSAT, table turnover time
Enhance loyalty and satisfaction
Operational Metrics
Digital order share, labor efficiency
Identify improvements
Marketing Metrics
Order frequency, CAC
Measure campaign effectiveness
Take the next step. Use FineReport to unlock the full potential of your restaurant.
Access a wealth of case studies, industry insights, and solution guides to accelerate digital transformation.
FAQ
What is a restaurant KPI dashboard?
A restaurant KPI dashboard shows your key performance indicators in one place. You see sales, costs, and customer feedback together. This helps you make quick, informed decisions.
How does FineReport help with restaurant dashboards?
FineReport lets you connect data from different sources. You use a drag-and-drop interface to build custom dashboards. You can view reports on your phone or computer.
Can I access my dashboard on mobile devices?
Yes! FineReport dashboards work on smartphones and tablets. You check your restaurant’s performance anytime, anywhere.
What KPIs should I track in my restaurant dashboard?
You should track sales, food cost percentage, labor cost, table turnover rate, and customer satisfaction. These KPIs show how well your restaurant performs.
Is it hard to set up a KPI dashboard with FineReport?
No. FineReport makes setup easy. You import your data, choose your KPIs, and customize your dashboard. No advanced technical skills needed.