An office 365 reporting tool should do more than generate static usage charts. For IT managers, operations leaders, and Microsoft 365 administrators, the real value is operational visibility: who is actually using the platform, where security risks are emerging, and which licenses are draining budget without delivering value. If your team is jumping between admin centers, audit logs, spreadsheets, and manual exports, you are losing time and missing the bigger picture. A single reporting dashboard helps you move from reactive troubleshooting to proactive governance, faster cost control, and better executive reporting.
 Click To Try The Dashboard
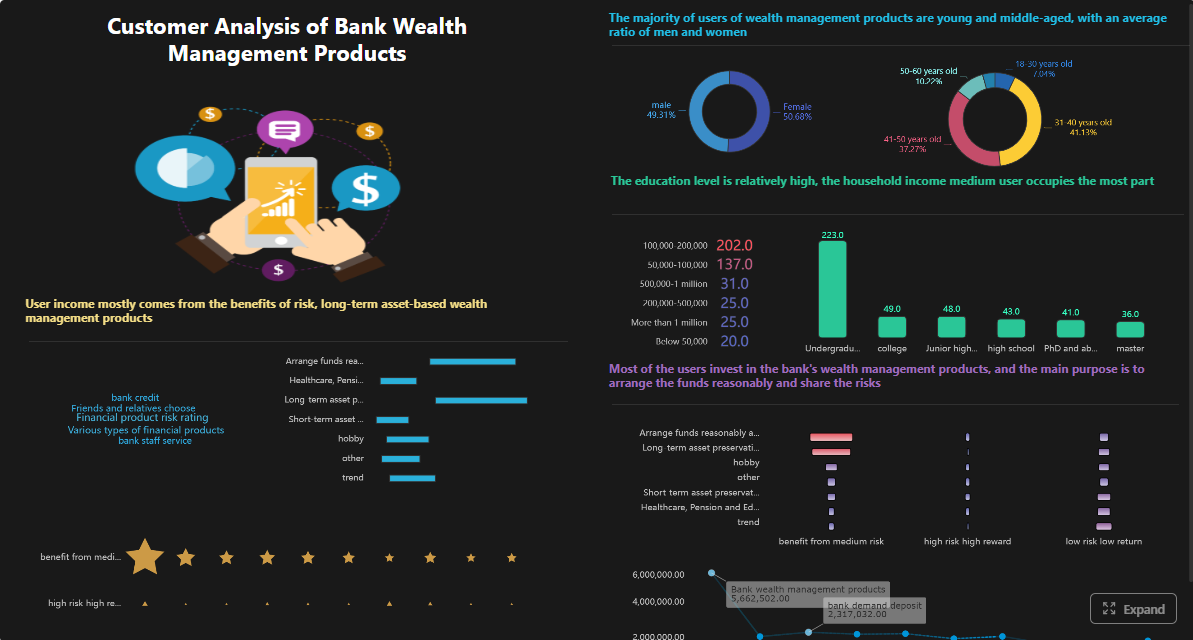
All reports in this article are built with FineReport
What an Office 365 Reporting Tool Should Help You See
A strong office 365 reporting tool gives IT teams one practical outcome: clear, actionable visibility across the Microsoft 365 environment. That means not just collecting data, but turning it into a dashboard that supports daily decisions.
Usage, adoption, and service activity
You need a clear view of how employees are interacting with Microsoft 365 services. That includes login frequency, mailbox activity, Teams engagement, SharePoint usage, and trend shifts over time. Without this visibility, it is difficult to know whether adoption programs are working or whether business units are paying for tools they barely use.
A good dashboard should help answer questions such as:
- Which departments are active in Teams but underusing SharePoint?
- Which users have not logged in for 30, 60, or 90 days?
- Are new licenses driving actual service adoption?
- Which locations show a decline in collaboration activity?
Security risks and policy gaps
Reporting is also a frontline security function. You need to spot unusual sign-in behavior, suspicious permission changes, admin actions, and policy exceptions before they evolve into incidents. Native logs often contain the data, but they are not always easy to consolidate into a usable management view.
The best dashboards surface security-relevant patterns quickly:
- Unusual login volumes or login failures
- Elevated admin activity outside business hours
- Changes to group memberships or permissions
- Sudden increases in file sharing or external access
Inactive accounts and license waste
Most Microsoft 365 environments contain some level of license inefficiency. Employees change roles, leave the business, stop using certain apps, or receive higher-tier licenses than they actually need. An office 365 reporting tool should make these waste patterns impossible to ignore.
This is where reporting becomes financial governance. By identifying inactive users and underused subscriptions, IT can reclaim licenses, realign plans, and support more accurate budgeting.
One dashboard for usage, auditing, and cost insights
The real advantage comes from bringing these views together. Usage alone does not explain risk. Security alone does not explain business value. Cost alone does not explain whether licenses are justified. A unified dashboard lets your team connect all three.
Core Reporting Areas IT Managers Should Prioritize
Not every metric matters equally. The most effective reporting strategy starts with the areas that drive operational control, risk reduction, and budget efficiency.
Usage and adoption reporting
Usage reporting shows whether Microsoft 365 is being used as intended and whether your investment is translating into productivity.
Focus on:
- Login activity across all users
- Mailbox usage and activity trends
- Teams chat, meeting, and collaboration engagement
- SharePoint and OneDrive access trends
- Service adoption by business unit, location, or role
Comparing usage across departments often reveals hidden issues. One location may have low Teams engagement because of training gaps. Another may show high mailbox use but weak document collaboration, suggesting poor SharePoint adoption.
Security and auditing visibility
Security reporting is not only for investigations. It is essential for continuous control monitoring.
Key visibility areas include:
- Admin actions and configuration changes
- Sign-in events and access failures
- Permission changes and privilege escalation
- External sharing activity
- User behavior patterns that may indicate misuse
This reporting supports faster incident response and stronger compliance readiness. When auditors or internal stakeholders ask for evidence, a centralized dashboard reduces the time spent gathering data from different tools.
License optimization and cost control
License management is one of the fastest reporting use cases to produce measurable ROI.
Track:
- Unused licenses assigned to inactive users
- Duplicate or overlapping subscriptions
- Premium plans assigned to low-usage accounts
- Department-level license consumption
- Trend-based forecasts for future demand
Done well, this creates a repeatable cycle: detect waste, reclaim seats, reassign appropriately, and forecast future licensing needs based on actual demand.
The Core Framework: Key Metrics That Matter Most
If you want one dashboard to work for operations, security, and cost management, start with a focused KPI model rather than tracking everything available.
Key Metrics (KPIs)
- Active Users: Number of users who logged in or used a Microsoft 365 service within a defined time period.
- Inactive Accounts: Users with no meaningful activity for 30, 60, or 90 days; critical for cleanup and license recovery.
- Service Adoption Rate: Percentage of licensed users actively using Teams, Exchange, SharePoint, OneDrive, or other services.
- Login Failure Rate: Volume or percentage of failed sign-ins; useful for detecting access issues or suspicious activity.
- Privileged Admin Activity: Count of high-impact administrative actions, especially role changes, policy updates, and permission modifications.
- Permission Change Events: Additions, removals, or escalations in user or group access rights.
- External Sharing Activity: Number of externally shared files, folders, links, or guest-access events.
- Mailbox Usage Trend: Growth or decline in mailbox activity, storage consumption, and engagement over time.
- Teams Engagement: Usage of chats, meetings, channels, or collaboration sessions by user group or department.
- SharePoint/OneDrive Usage: File access, upload, storage growth, and collaboration patterns across sites and users.
- Assigned vs Used Licenses: Comparison between licenses allocated and actual service consumption.
- License Waste Rate: Percentage of paid licenses attached to inactive or low-value usage profiles.
- Cost per Active User: Licensing cost divided by users showing meaningful activity; useful for budget justification.
- Trend Variance: Period-over-period changes in usage, security events, or licensing demand.
- Alert Volume: Number of automated warnings triggered for inactivity, risk, storage thresholds, or abnormal behavior.
Define each KPI by business outcome
The best KPI dashboards do not just display numbers. They link metrics to action:
- Low Active Users may indicate adoption issues.
- High Login Failure Rate may signal credential risk or user friction.
- Rising External Sharing Activity may require governance review.
- Poor Assigned vs Used Licenses points directly to reclaim opportunities.
That is the difference between reporting for information and reporting for decision-making.
Microsoft 365 Reporting Features That Matter Most
Once you know what to track, the next step is evaluating the capabilities that make reporting useful in practice.
Dashboard and customization options
A reporting platform should let you tailor views for different audiences. IT admins need detailed operational views. Leadership needs concise summaries. Security teams need audit visibility. Finance may need license and cost trends.
Look for:
- Flexible filters by department, location, role, and period
- Scheduled report delivery
- Export options for stakeholder sharing
- Role-based access to dashboards
- Drill-down capability from summary to detail
Customization matters because one-size-fits-all dashboards usually fail. Reporting should adapt to how each stakeholder consumes information.
Automation and alerting
Manual monitoring does not scale. A mature office 365 reporting tool should automate recurring reports and trigger alerts when specific conditions are met.
Prioritize alerts for:
- Risky sign-in behavior
- Inactive accounts crossing a threshold
- Storage growth nearing limits
- Sudden drops in service usage
- Unexpected permission changes
Automation reduces the chance that your team misses issues hidden in routine noise.
Historical data and benchmarking
Short reporting windows are useful for operations, but not enough for planning. Longer historical views help you identify trends, compare periods, and measure whether a change in policy, training, or licensing strategy is actually working.
Useful benchmarking scenarios include:
- Pre- and post-training adoption comparison
- Quarterly trend analysis by department
- Monthly license consumption review
- Incident rate comparison before and after security policy changes
How to Evaluate a Microsoft 365 Reporting and Management Tool
Choosing a reporting platform is not just a feature checklist exercise. It is an operational design decision that affects visibility, admin workload, and reporting consistency.
Questions to ask before choosing a platform
Before selecting a solution, ask:
- Does it combine reporting, auditing, and management workflows in a way that saves time?
- Can it support both daily monitoring and executive summaries?
- How quickly can admins learn and use it?
- Does it reduce spreadsheet work and manual data stitching?
- Can it scale as your tenant, users, and reporting needs grow?
These questions help filter out tools that look powerful on paper but create more maintenance overhead than value.
Comparing built-in and third-party options
Built-in Microsoft 365 reporting is useful for basic activity visibility and service-level monitoring. For smaller environments, native reports may cover immediate needs. But as complexity grows, gaps appear in data centralization, automation, retention, benchmarking, and executive-ready dashboards.
Third-party or custom dashboard approaches become more valuable when you need:
- Cross-service visibility in one place
- Better alerting and workflow support
- Longer historical analysis
- Tailored dashboards for multiple audiences
- Easier cost and license optimization analysis
The decision should come down to whether your team needs simple reporting or a reporting system that supports governance at scale.
Budget and value considerations
Cost should be assessed in terms of total value, not just license price. A low-cost option that lacks useful automation or forces manual work may be more expensive over time than a stronger solution.
Evaluate:
- Time saved for IT operations
- Faster issue detection and response
- Reduced license waste
- Better stakeholder reporting
- Lower risk of missed security events
A practical tool pays for itself when it reduces labor, improves decision speed, and uncovers measurable waste.
Building One Dashboard for Ongoing Reporting Success
A dashboard only creates value when it becomes part of a repeatable reporting process.
Define the metrics that matter
Start with a focused KPI set. Avoid the common mistake of tracking every available metric. Build around the business questions your team needs to answer consistently:
- Are users adopting the platform?
- Are we seeing risky behavior?
- Are we overpaying for licenses?
- Where should we take action this month?
Create reporting routines for different audiences
Strong reporting programs align cadence with audience.
Recommended routines:
-
Weekly admin review
Check activity changes, security alerts, inactive users, and storage thresholds. -
Monthly leadership summary
Share top trends, adoption progress, risk indicators, and cost optimization outcomes. -
Quarterly optimization review
Reassess license allocation, policy effectiveness, and long-term usage patterns. -
Incident-driven deep dives
Use audit and activity dashboards to support investigations and remediation.
These routines turn dashboards into management tools rather than passive visuals.
Turn insights into action
The final test of any office 365 reporting tool is whether it drives action. Good reporting should lead to decisions such as:
- Reclaiming licenses from inactive users
- Tightening access controls after suspicious behavior
- Launching targeted adoption training
- Adjusting policies for sharing and retention
- Forecasting future Microsoft 365 demand more accurately
Best Practices for Implementing an Office 365 Reporting Tool
The most successful deployments follow a disciplined operating model. Here is the approach I recommend to enterprise IT teams.
1. Start with three reporting objectives
Define one goal in each of these areas:
- Usage: Improve adoption visibility across business units
- Security: Detect risky events earlier
- Cost: Reduce inactive or mismatched licensing
This keeps the first dashboard focused and easier to operationalize.
2. Standardize your KPI definitions
Agree internally on what terms mean. For example:
- What counts as an active user?
- How many days define inactivity?
- Which admin events are high risk?
- What level of service usage justifies a premium license?
Without consistent definitions, your reports will trigger debate instead of action.
3. Build audience-specific views
Do not force executives, admins, and security staff into the same dashboard experience.
Create:
- A detailed operations dashboard for admins
- A risk-oriented view for security teams
- A concise summary for leadership
- A cost lens for finance or procurement stakeholders
4. Automate recurring reviews and alerts
Set up scheduled reports and threshold-based notifications. This reduces dependence on individual admins remembering to check the same data every week.
5. Tie every report to a workflow
A report without a follow-up action is just a visual. For every major metric, define:
- Who reviews it
- How often they review it
- What threshold triggers action
- What remediation step follows
This is how reporting becomes governance.
Build the Dashboard Faster with FineReport
Building this manually is complex; use FineReport to utilize ready-made templates and automate this entire workflow. Instead of stitching together exports from multiple Microsoft 365 admin views, IT teams can use FineReport to centralize usage reporting, security visibility, and license optimization into one executive-ready dashboard.
FineReport is especially valuable when you need to:
- Combine operational, audit, and cost data into one reporting layer
- Build role-based dashboards for admins, managers, and executives
- Automate scheduled distribution and alert-driven reporting
- Customize KPI scorecards, trend charts, and drill-down analysis
- Standardize reporting across departments and review cycles

Get Ready-to-Use Dashboard Templates in Fine Gallery
With FineReport, your team can move beyond fragmented reporting and create a reliable command center for Microsoft 365 governance. That means faster insight, less manual effort, and stronger confidence in every usage, security, and licensing decision.
Final Takeaway
The best office 365 reporting tool is not the one with the longest feature list. It is the one that helps your team see adoption clearly, respond to security risks faster, and eliminate license waste with confidence. If you can unify those three goals in one dashboard, you create real operational leverage.
For most IT teams, the challenge is not lack of data. It is turning scattered Microsoft 365 data into a reporting system people actually use. FineReport helps solve that by giving you a flexible way to build, automate, and scale the dashboards that matter.
FAQs
It should track Microsoft 365 usage, security events, and license utilization in one place. The most useful tools combine adoption metrics, audit activity, and cost insights so IT teams can act faster.
Yes, native reports can surface some of this data, but it is often spread across different admin centers and exports. A unified dashboard makes inactive accounts and license waste much easier to spot and manage.
It helps identify unusual sign-ins, failed login spikes, permission changes, and suspicious admin activity. This gives administrators a faster way to detect risks and respond before they grow into larger incidents.
License reporting shows which subscriptions are underused, duplicated, or assigned to inactive users. That visibility helps reduce waste, improve budgeting, and align plans with actual user needs.
One dashboard saves time by replacing manual exports and switching between multiple tools. It also gives leadership a clearer view of usage trends, security posture, and cost efficiency in a single report.


The Author
Yida Yin
FanRuan Industry Solutions Expert
Related Articles

Financial Reporting Valuation Explained: A Practical Guide to ASC 820, ASC 805, ASC 350, and ASC 718
$1 valuation is the process companies use to measure assets, liabilities, equity instruments, and reporting units for compliant $1. For CFOs, controllers, finance directors, and audit facing accounting teams, the challen
Yida Yin
Jun 25, 2026

Best Ad Reporting Tool in 2026: 8 Options Compared for Marketers and Analysts
$1 is an $1 and dashboard platform that helps teams unify ad data, build highly customized reports, and automate distribution at scale. 8 ad reporting tool options compared 1. DashThis One sentence overview: DashThis is
Yida YIn
Jun 25, 2026

Marketing Automation Reporting Framework: 7 KPIs, Dashboard Templates, and Workflow Steps
Marketing automation reporting gives enterprise marketing teams a repeatable way to prove impact, spot bottlenecks, and act faster without waiting for analysts to rebuild the same report every week. If you manage demand
Yida Yin
Jun 24, 2026