A sales reporting tool is software that helps revenue teams track pipeline, monitor rep performance, review forecast accuracy, and share decision-ready sales metrics with managers and executives. If you are evaluating one in 2026, you are probably trying to answer a practical question: Should your team rely on CRM-native reports, adopt a BI platform for broader analysis, or invest in an enterprise reporting platform with stronger governance and standardized reporting?
That choice matters because sales reporting has expanded far beyond simple dashboards. Many teams now need to combine CRM data with ERP, finance, marketing, spreadsheets, and warehouse data. Others need executive-ready reports, scheduled distribution, regional standardization, and tighter control over how metrics are defined.
What Sales Reporting Is and Why It Matters for Revenue Teams
Sales reporting is the process of turning sales activity and revenue data into structured reports, dashboards, and recurring management views. Its purpose is not just to show what happened. A good sales report helps teams understand why performance changed, where pipeline is stalling, and what action to take next.
For revenue teams, sales reporting usually supports four core goals:
Pipeline visibility: See whether enough qualified pipeline exists to hit targets
Performance tracking: Monitor reps, teams, regions, and products against goals
Forecasting: Estimate likely revenue based on current opportunities and trends
Executive decision-making: Give leadership a reliable view of risks, growth, and execution gaps
Operational Reporting vs Strategic Analytics vs Performance Management
These terms are often grouped together, but they solve different problems.
Operational reporting
Operational reporting supports day-to-day sales execution. Examples include open opportunities by stage, overdue follow-ups, lead response time, and activity volume. These reports need freshness, filtering, and often scheduled delivery.
Strategic analytics
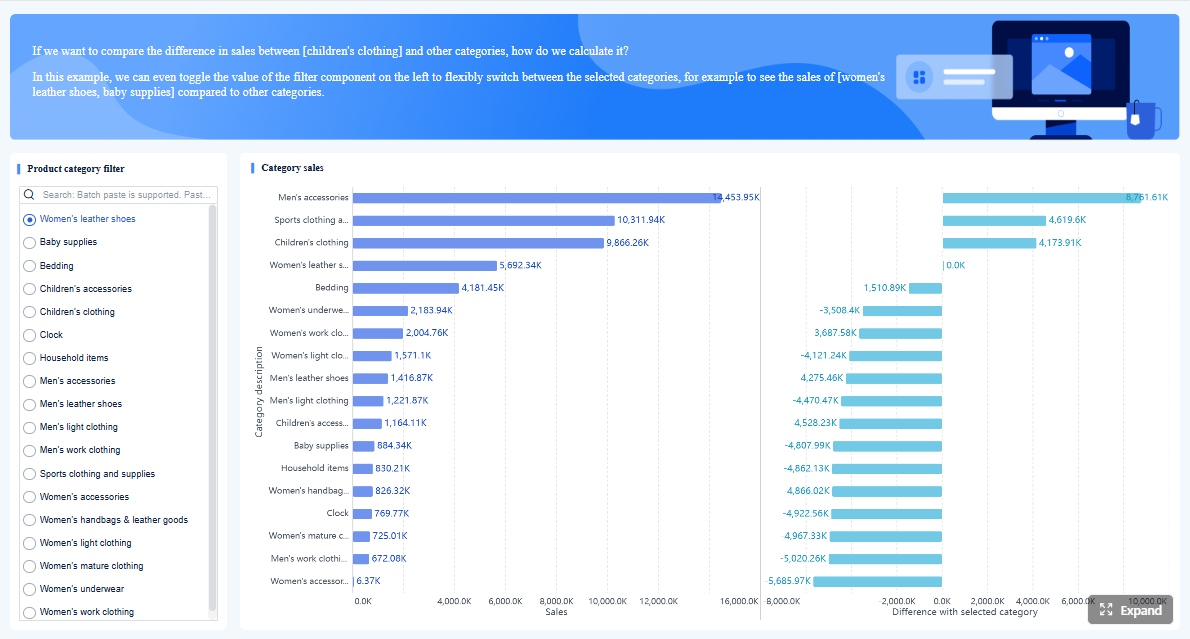
Strategic analytics goes deeper into trends and relationships across systems. This might include win rates by channel, sales cycle changes by segment, CAC-to-revenue analysis, or marketing-to-sales conversion patterns. BI tools are often strong here.
Performance management
Performance management adds governance, review processes, and standardized reporting for managers and executives. This may include approved KPI definitions, regional rollups, formal monthly business reviews, and tightly controlled access to sensitive data.
Common Sales Reports Most Teams Rely On
Nearly every sales organization depends on a core set of recurring reports:
The difference between average and high-performing teams is usually not whether they have these reports. It is whether those reports are trusted, standardized, and connected to action.
When Built-In CRM Reports Are Enough
CRM-native reporting is often enough when:
Most critical data already lives inside the CRM
The team mainly needs pipeline visibility and rep dashboards
Sales managers need speed more than deep modeling
Executive reporting is relatively lightweight
The business has limited reporting resources
When Teams Outgrow CRM Reporting
Many organizations outgrow built-in CRM reporting when they need to:
Blend CRM data with ERP, finance, billing, product, or warehouse data
Standardize KPIs across regions and business units
Deliver highly formatted executive or board reports
Schedule recurring reports for multiple stakeholder groups
Support more advanced permissions and governance
Build operational workflows that include write-back or form-based processes
How to Choose the Right Sales Reporting Tool in 2026
Choosing the right sales reporting tool starts with identifying what kind of reporting problem you actually have. Many teams buy for dashboard visuals when their real challenge is data consistency, executive reporting, or cross-system alignment.
Define Whether You Need CRM-Native Dashboards, BI Analysis, or Enterprise Reporting Governance
Start by placing your needs into one of three buckets.
CRM-native dashboards
Choose this route if sales works primarily inside one CRM and wants quick adoption. These tools keep reporting close to daily workflows and are often easiest for reps and frontline managers.
Cross-source BI analysis
Choose BI if your main need is deeper analysis across CRM, finance, marketing, customer, and product systems. This is usually the best fit for organizations with analysts or RevOps support.
Enterprise-grade reporting governance
Choose enterprise reporting if you need standardized reports, formal executive packs, auditable metrics, tighter permissions, and repeatable distribution across departments or regions.
Core Evaluation Criteria
When comparing any sales reporting tool, review these criteria first:
Data freshness: How often is the data updated, and is that enough for your sales motion?
Dashboard flexibility: Can managers and executives see metrics in the format they need?
Forecasting support: Does the tool support pipeline, weighted forecast, and trend-based reporting?
Permissions: Can access be controlled by role, region, manager, or business unit?
Automation: Can reports be scheduled, distributed, and refreshed without manual work?
Total cost of ownership: Consider implementation, admin burden, training, and maintenance, not just license cost.
Match Reporting Needs to Team Size and Sales Complexity
A startup with a straightforward pipeline usually needs something very different from a multinational sales organization.
Startups: Prioritize speed, ease of use, and CRM alignment
Mid-market teams: Often need a mix of dashboard flexibility and cross-source analysis
Global enterprises: Usually need governance, standard definitions, role-based access, and executive-standard reporting
Identify Must-Have Integrations
A sales reporting tool becomes much more valuable when it can work across the systems your teams already use. Common requirements include:
CRM platforms
ERP or finance systems
Marketing automation tools
Spreadsheets
Data warehouses
Customer support or product platforms
If leadership expects one trusted version of the truth, integration strategy matters as much as front-end dashboards.
10 Best Sales Reporting Tools Compared for 2026
Rather than forcing every tool into a single ranking formula, it is more useful to compare them by category. That reflects how buyers actually evaluate a sales reporting tool: based on reporting style, data needs, and operational complexity.
CRM Analytics Tools
CRM analytics tools are best for teams that want reporting close to daily sales workflows and CRM data. Their biggest advantages are fast adoption, role-based dashboards, and strong visibility into pipeline movement. Their main trade-off is that cross-system analysis and advanced modeling can be harder.
1. FineReport
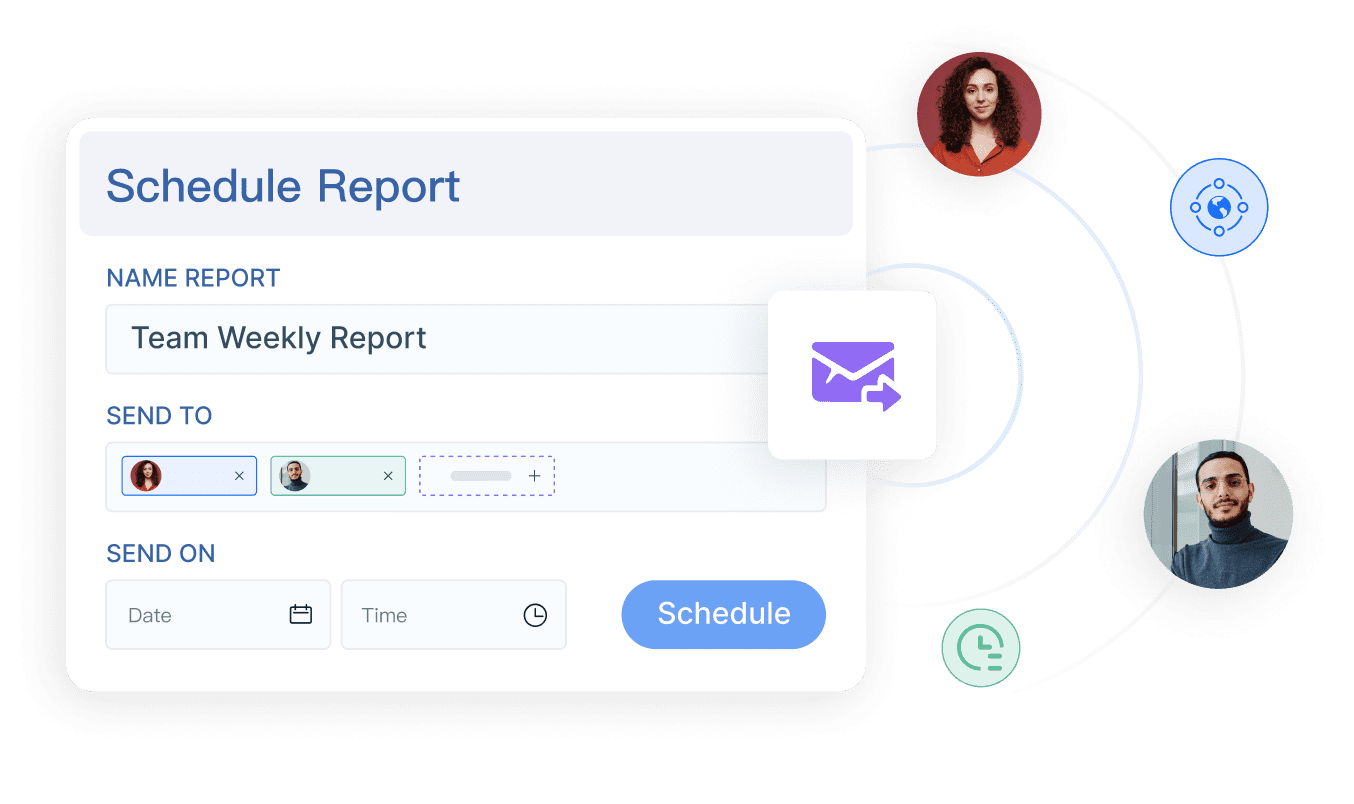
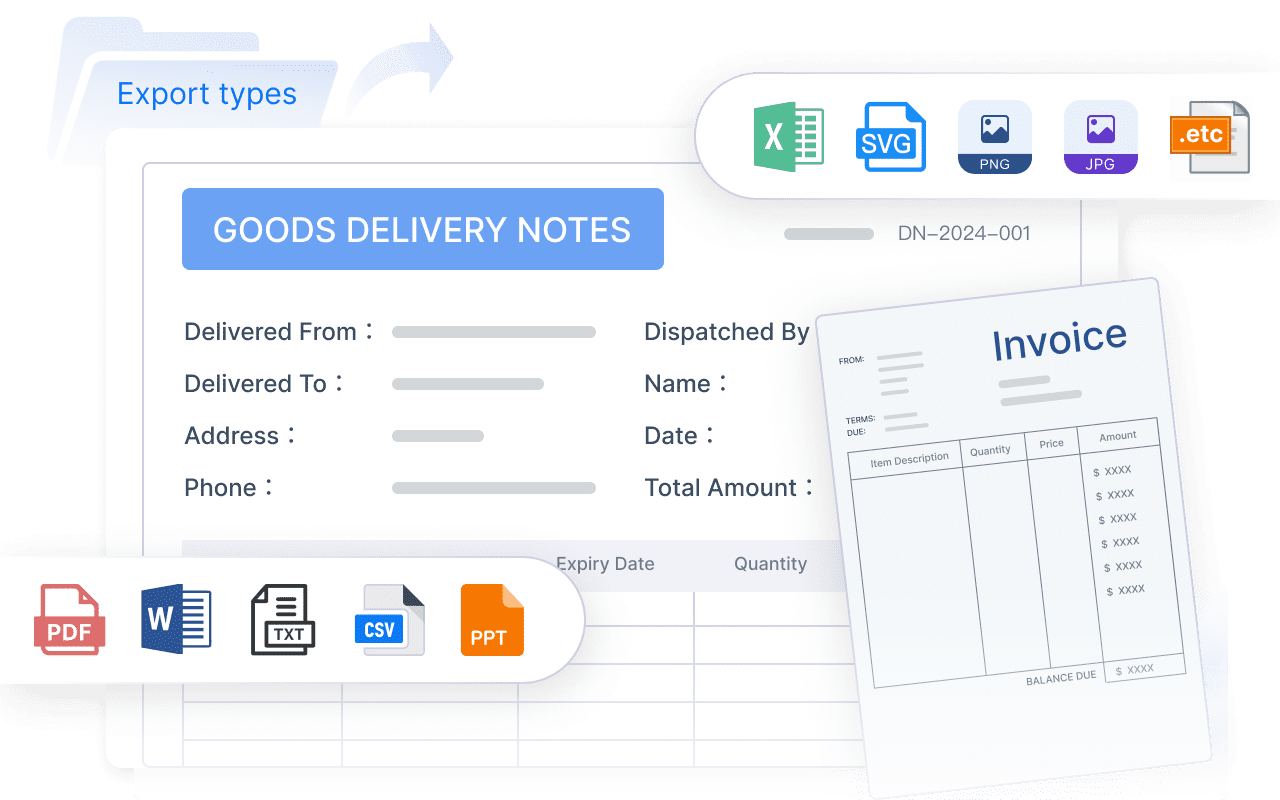
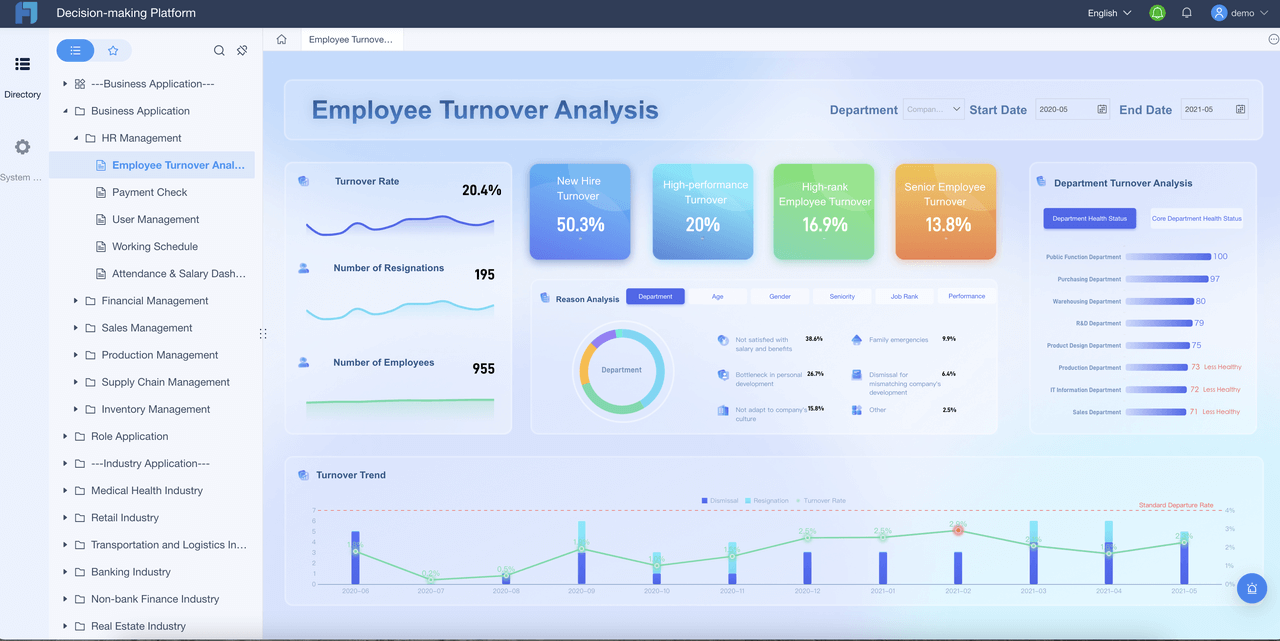
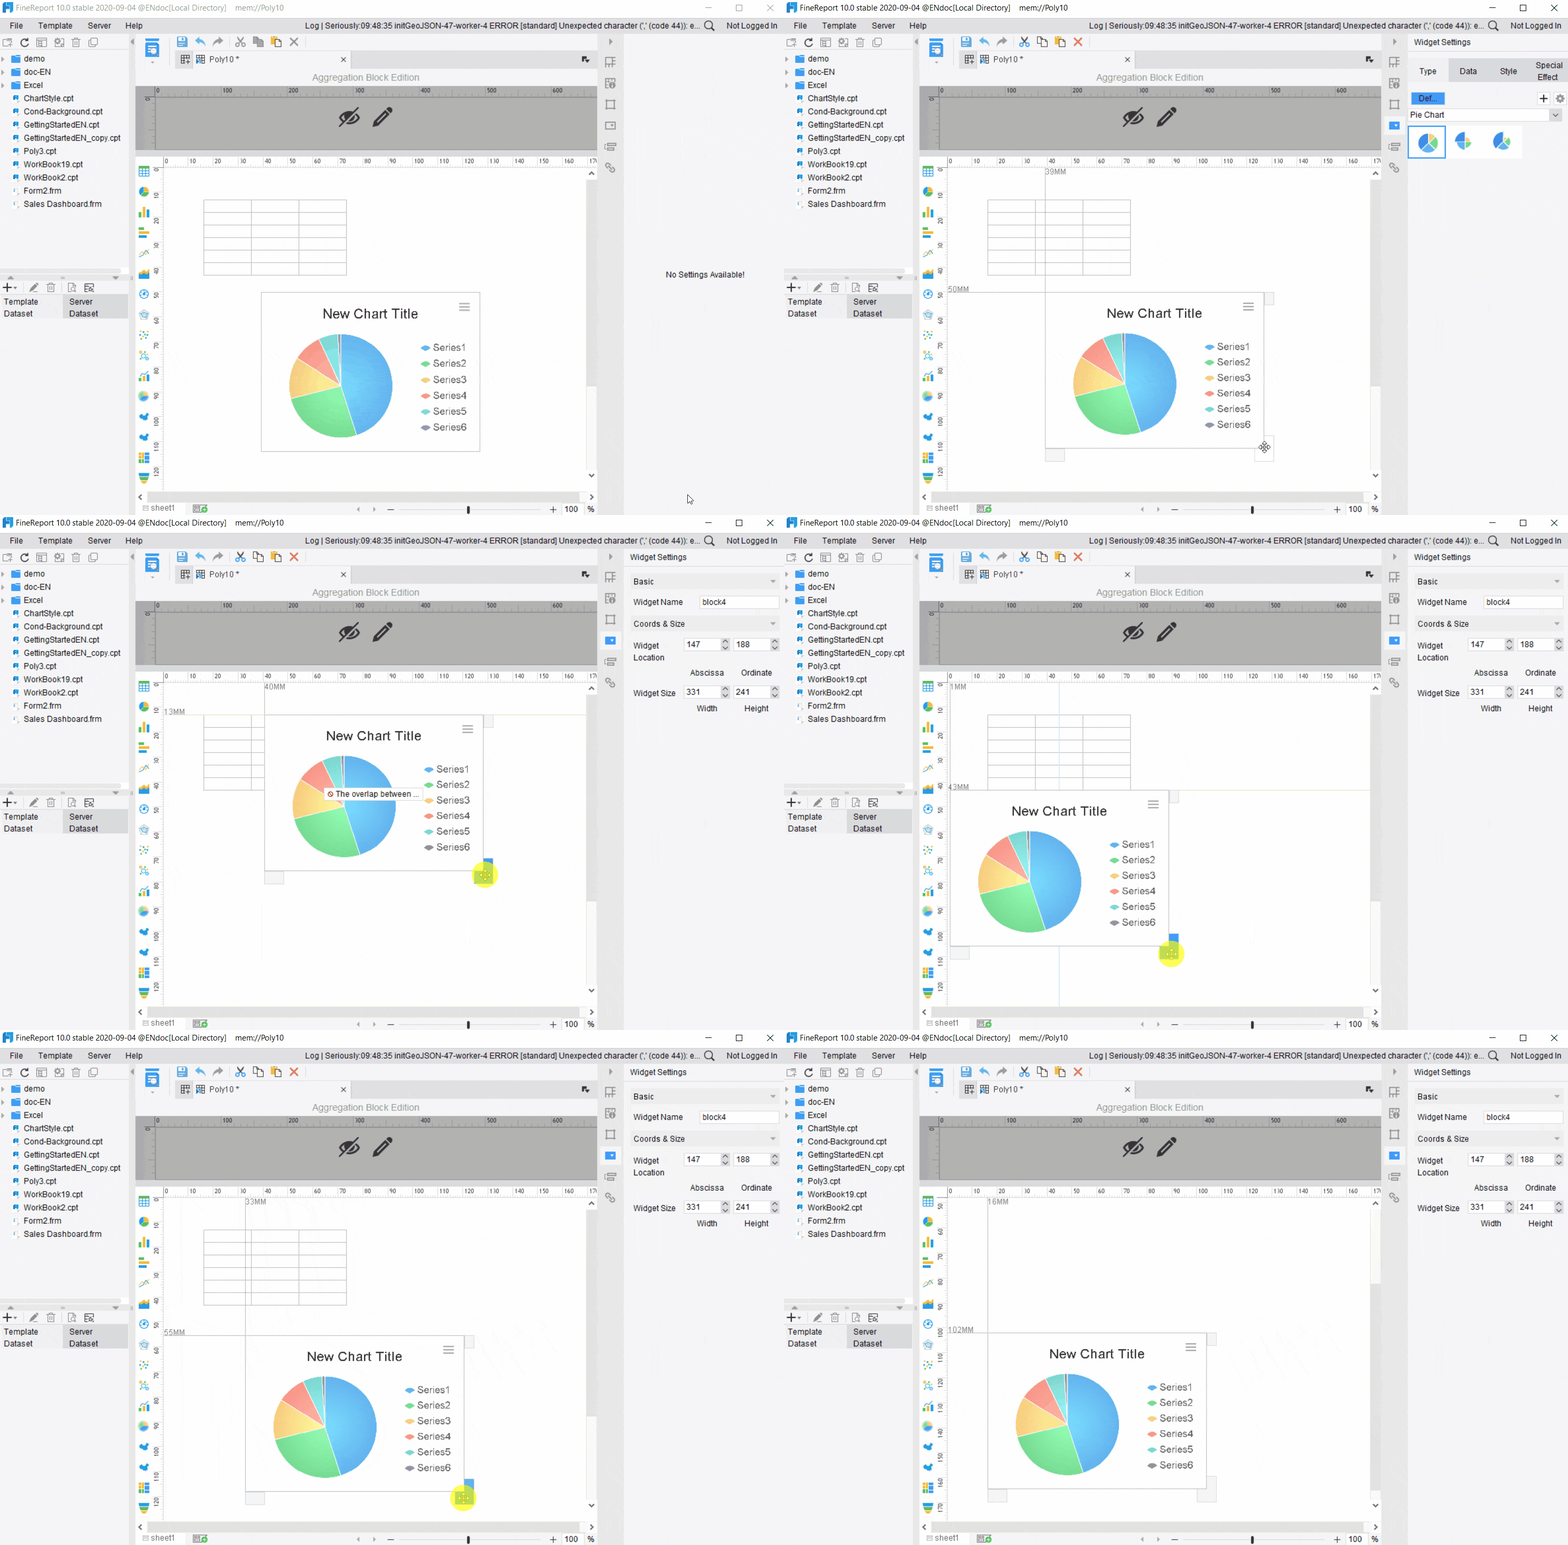
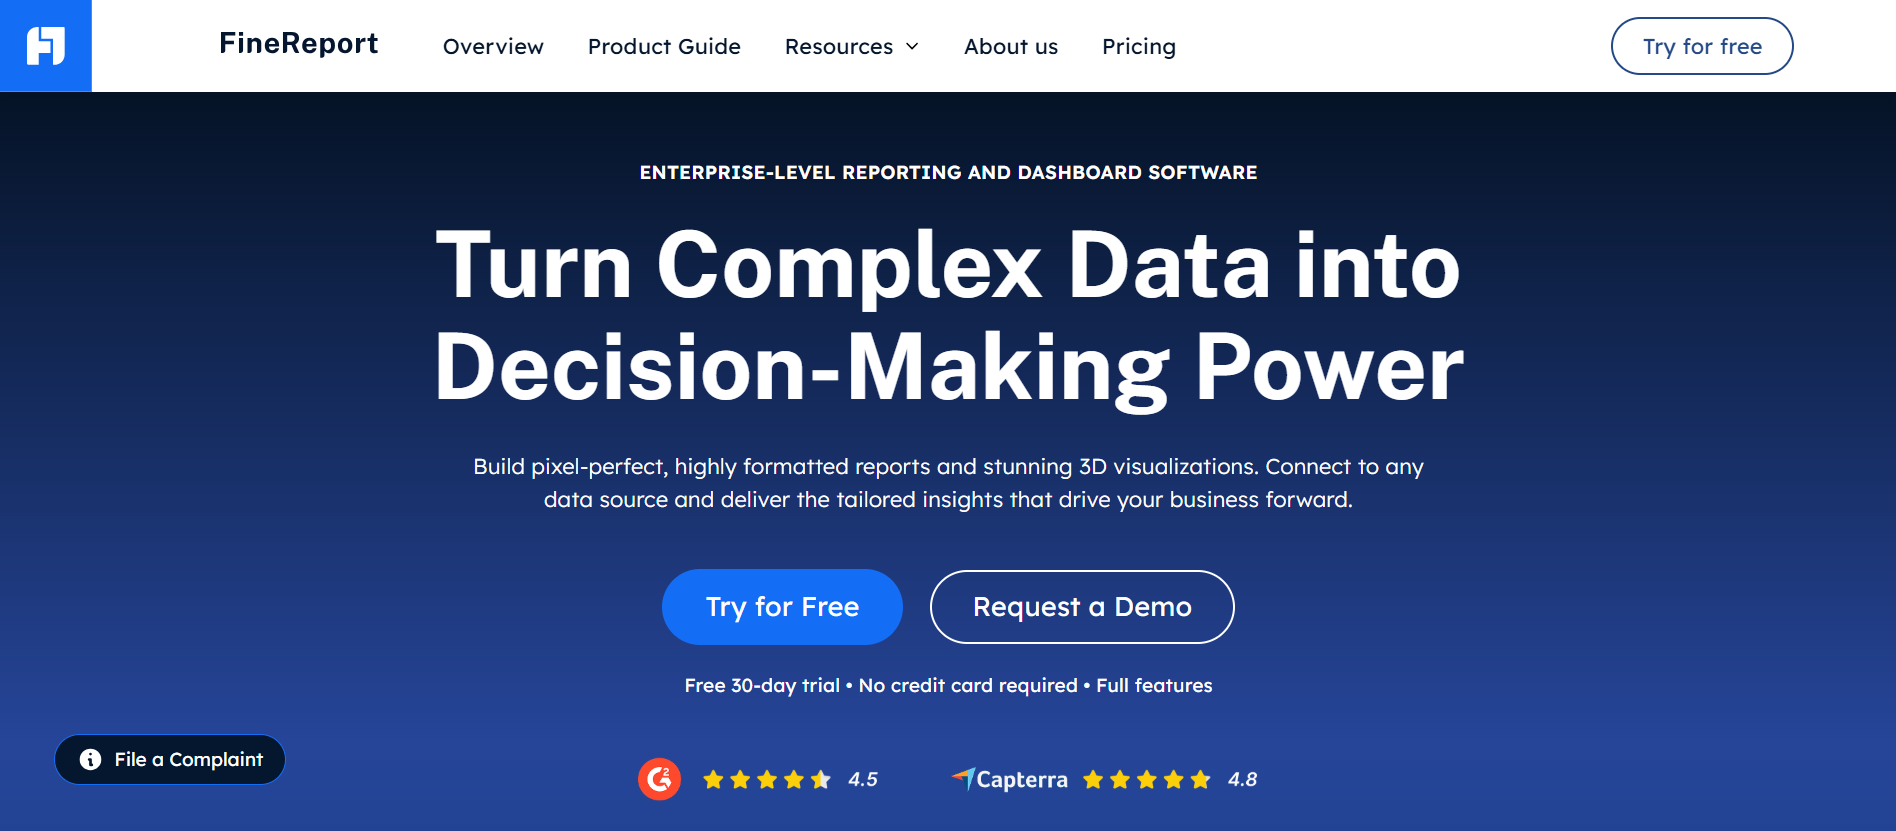
FineReport is an enterprise reporting platform designed for organizations that need more than dashboarding alone. It is especially relevant when sales reporting must support pixel-perfect reports, paginated output, parameter queries, scheduled distribution, dashboard-and-report integration, and form-based workflows.
For sales organizations, that can matter when managers need standardized territory packs, executives need formatted recurring reports, or operations teams need governed reporting connected to broader business systems.
Best fit: Organizations that need structured enterprise reporting alongside dashboards
Supports parameterized queries and scheduled reporting
Useful when dashboards and formal reports need to work together
Can support data entry or form-based operational workflows
Cons
More reporting-oriented than lightweight CRM analytics tools
Usually a better fit when reporting complexity justifies a dedicated platform
2. Salesforce Sales Cloud
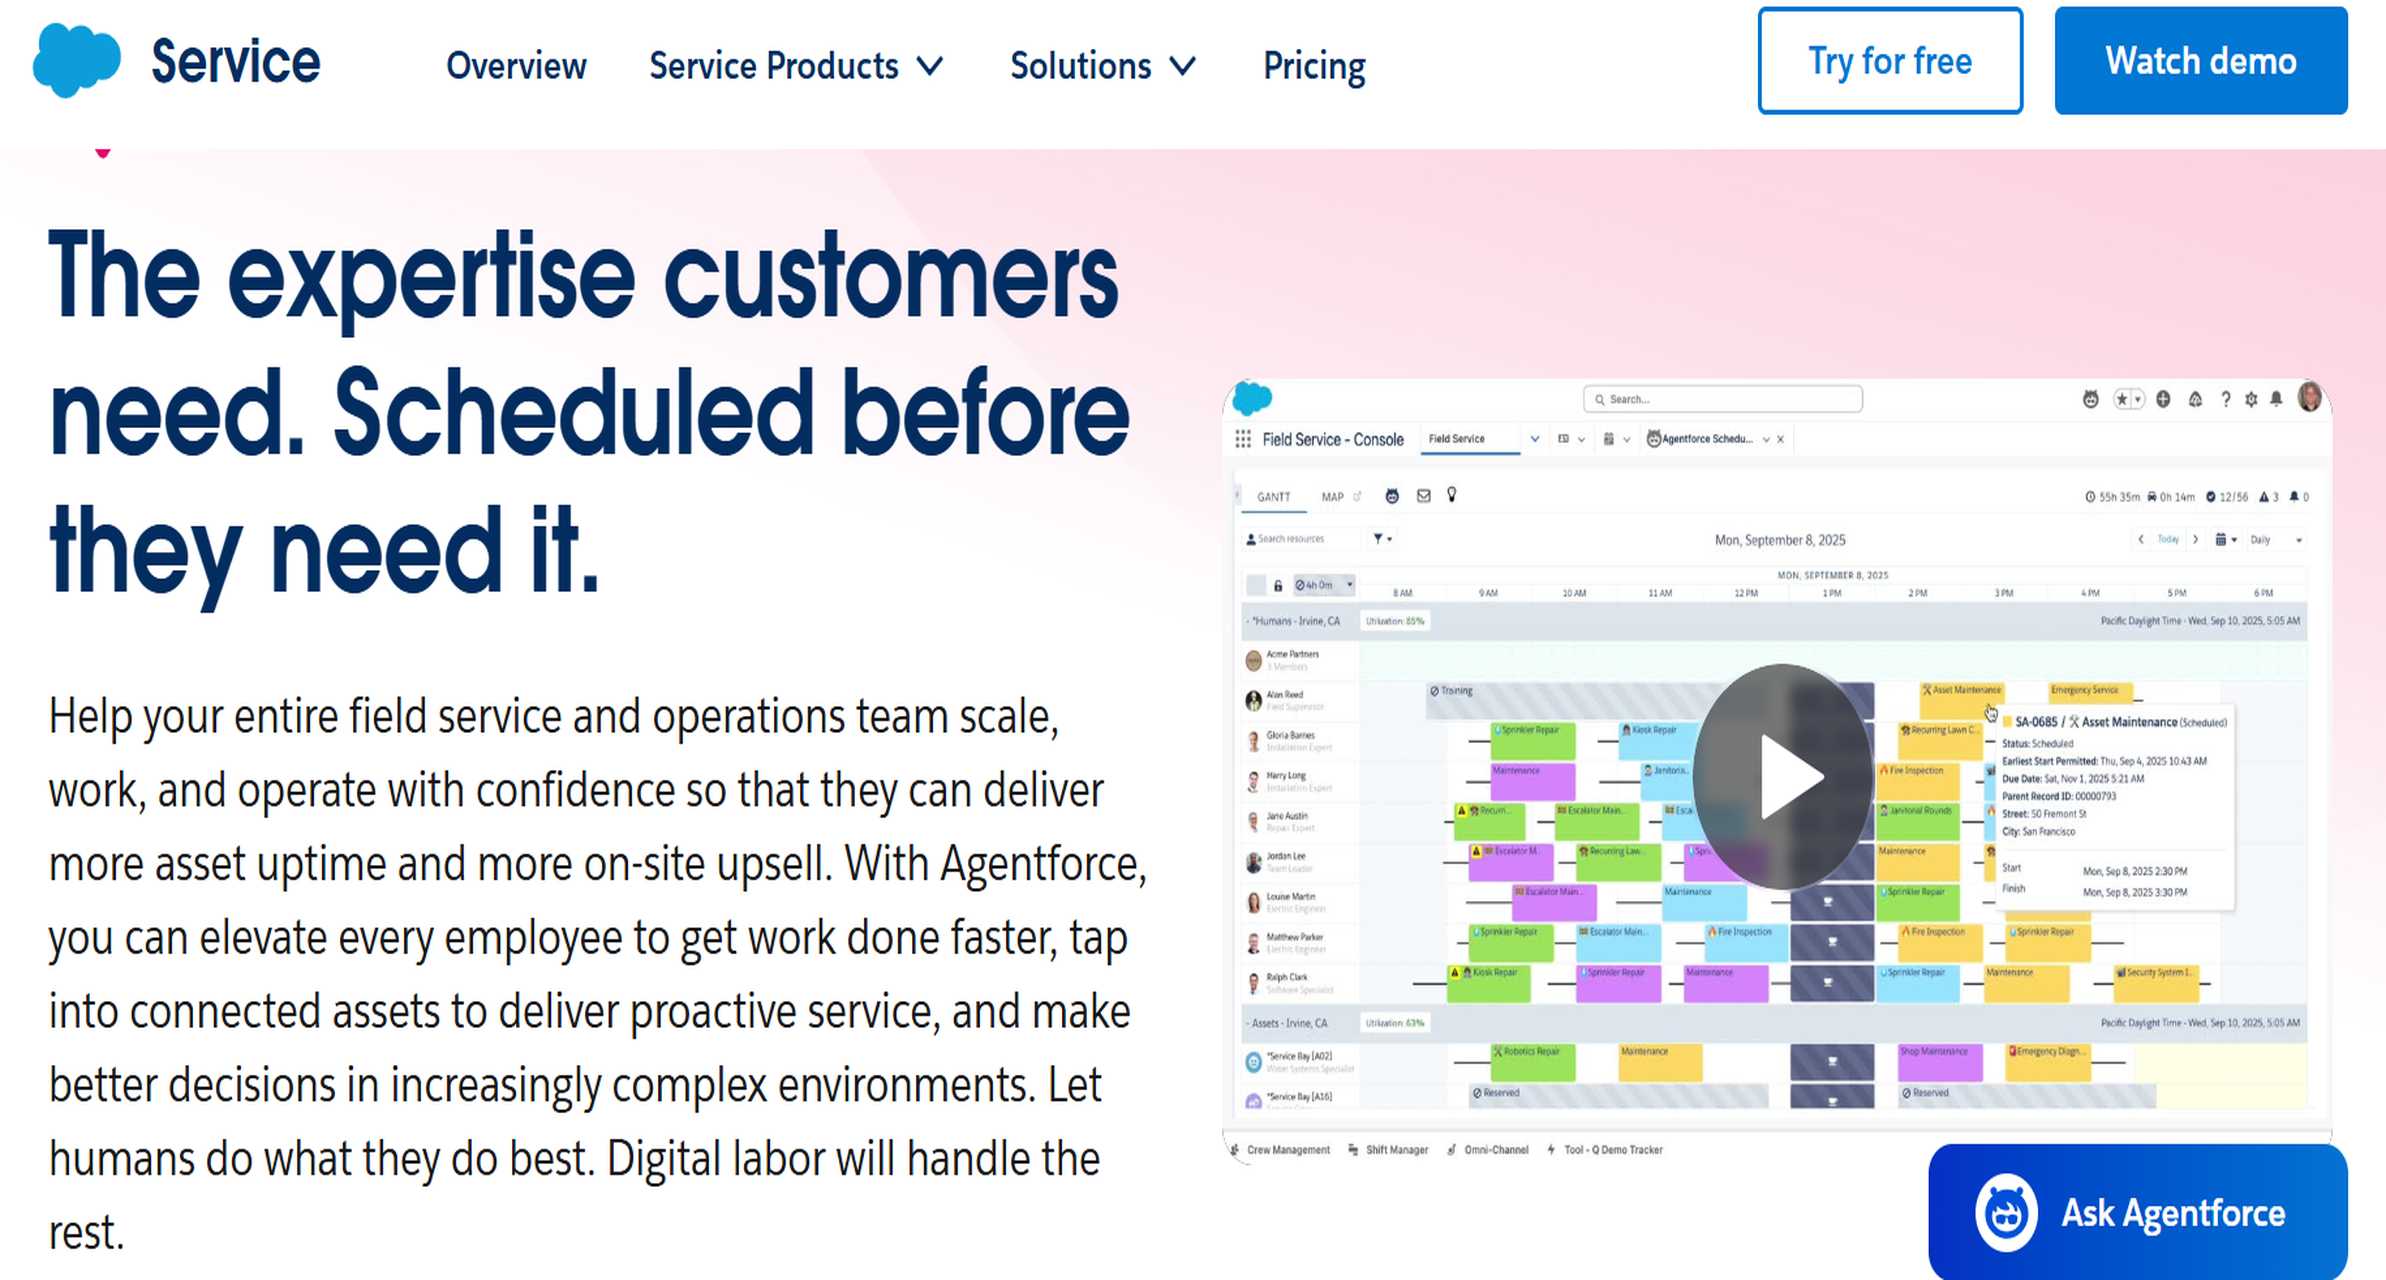
Salesforce is widely used by large and growing sales organizations and includes mature CRM reporting capabilities. It is a strong option for pipeline analysis, role-based dashboards, and sales forecasting inside the Salesforce ecosystem.
Best fit: Enterprises and established sales teams already committed to Salesforce
Pros
Deep CRM-native reporting
Strong pipeline and forecast visibility
Extensive customization potential
Cons
Can become complex to administer
Full reporting value often depends on strong CRM structure and setup
3. HubSpot Sales Hub
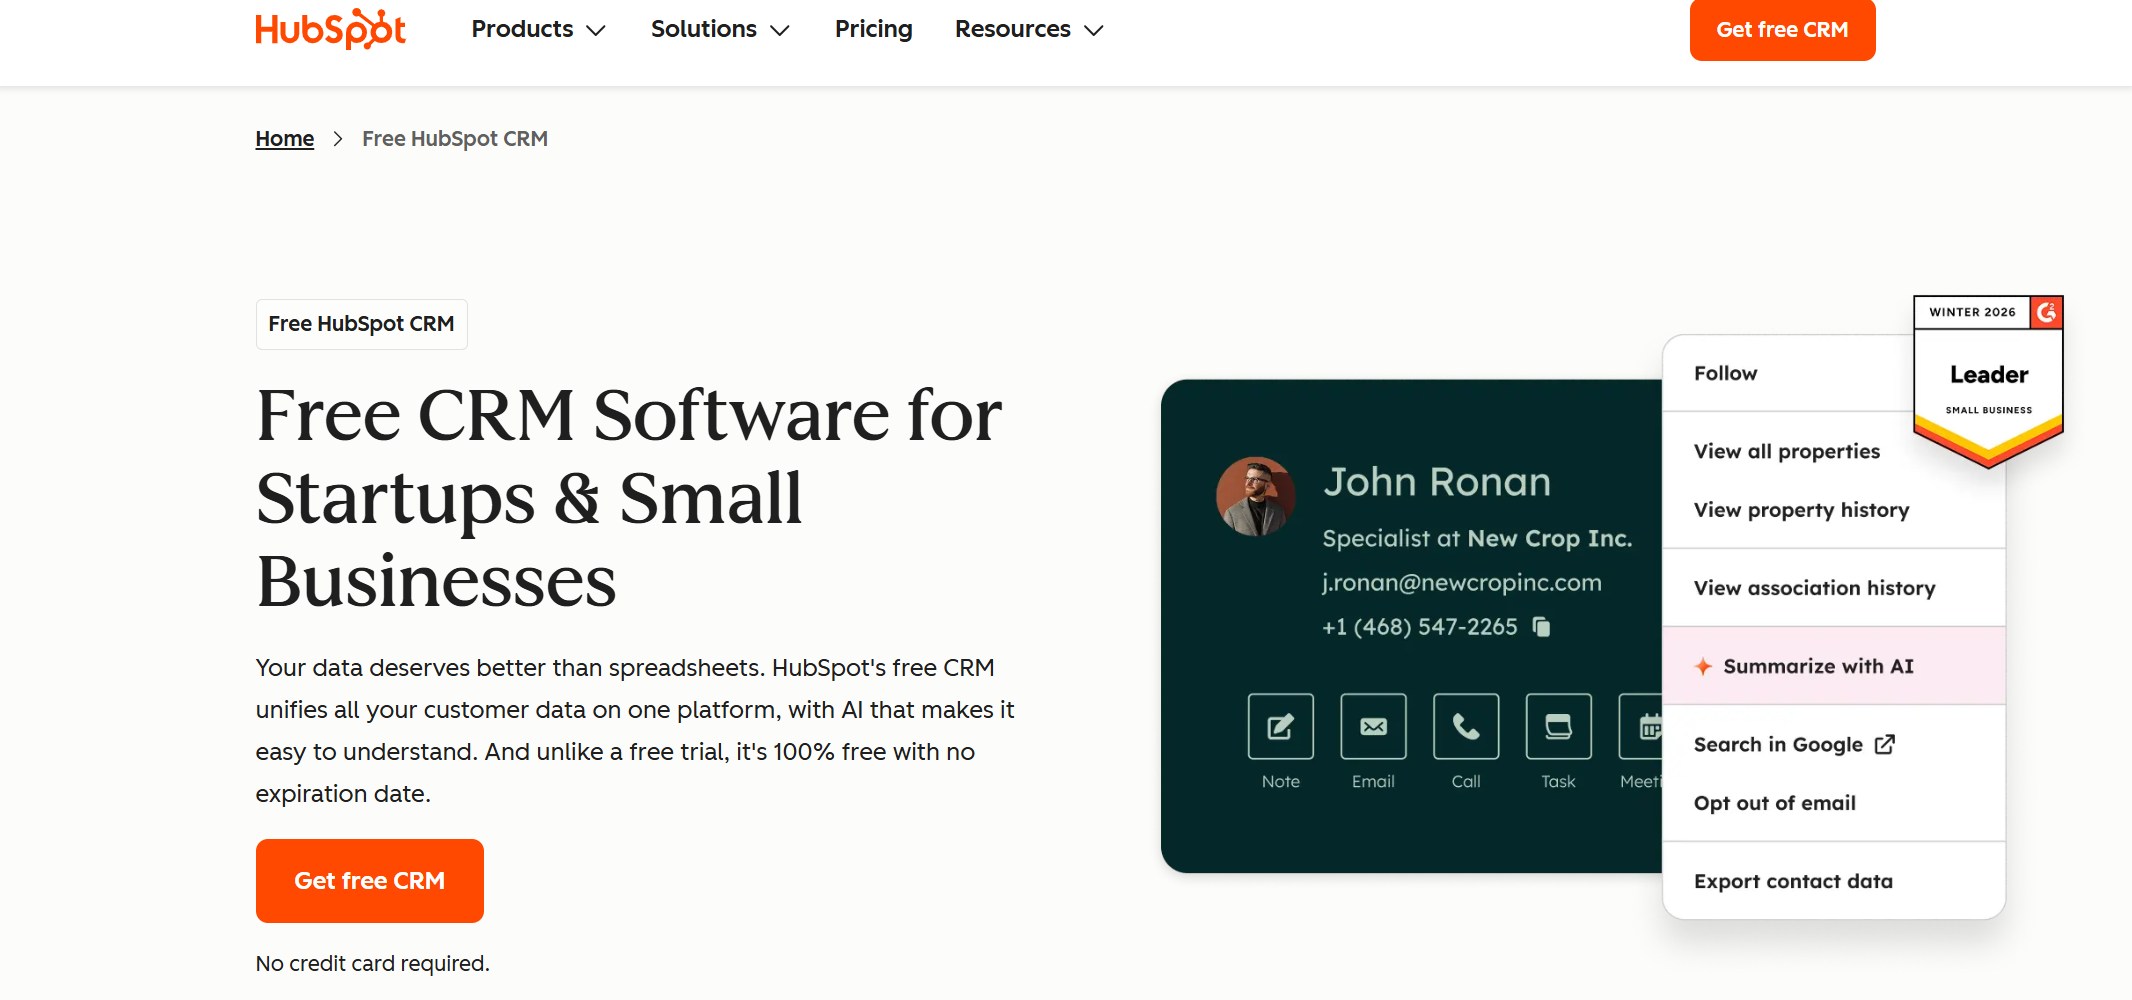
HubSpot is popular with small and mid-sized teams that want easier setup and a cleaner user experience. Its reporting is practical for tracking sales performance, activity, and funnel movement.
Best fit: SMBs and mid-market teams that want quick adoption
Pipedrive focuses on pipeline visibility and ease of use. It works well for teams that want visual deal tracking and lightweight reporting without significant implementation overhead.
Best fit: Small teams and process-focused sales managers
Pros
Easy to learn
Clear pipeline views
Good for day-to-day sales monitoring
Cons
Less depth for broader analytics
Limited fit for complex cross-functional reporting
BI Platforms for Sales Teams
BI platforms are best for organizations that need deeper analysis across CRM, finance, marketing, and product data. Their strengths include custom dashboards, broader data blending, and stronger trend analysis. Their trade-offs usually involve data modeling effort, setup complexity, and greater reliance on analysts or BI teams.
5. Microsoft Power BI
Power BI is a common choice for organizations that already use Microsoft tools and need flexible BI for sales, finance, and operations reporting. It is well suited for cross-source dashboards and trend analysis.
Best fit: Teams with Microsoft alignment and moderate to advanced analytics needs
Business users may depend on analysts for more advanced reporting
6. Tableau
Tableau is widely recognized for visual analytics and exploratory dashboards. Sales teams use it to analyze pipeline, segment performance, and trends across many data sources.
Best fit: Data-driven organizations that value interactive analysis
Can be less convenient for highly formatted recurring reports
7. Looker
Looker is often chosen by organizations that want governed metrics and modeled analytics on top of cloud data environments. It can be a good fit when sales reporting depends on warehouse-centered data strategy.
Best fit: Organizations with mature data teams and warehouse-first reporting
Setup and maintenance often require technical resources
Less suited to teams seeking quick self-service deployment
8. Qlik
Qlik remains a relevant option for organizations that want interactive analysis and associative exploration of business data. It can support sales trend analysis and multi-source reporting.
Best fit: Organizations with established BI teams and varied data exploration needs
Pros
Flexible analytics
Good for discovering patterns across datasets
Supports more advanced analysis scenarios
Cons
Learning curve can be meaningful
May require specialist support for broader rollout
Enterprise Reporting and Performance Management Platforms
These platforms are best for large organizations that need governance, standardized metrics, auditability, and executive reporting. Their strengths include control, scalability, permissions, and formal reporting workflows. Their trade-offs often include longer implementation cycles and more change management.
9. SAP Analytics Cloud
SAP Analytics Cloud is relevant for organizations operating in larger enterprise data and planning environments. It can support broader performance management use cases that extend beyond sales alone.
Best fit: Enterprises with SAP-centric planning and reporting requirements
Pros
Broad enterprise performance coverage
Suitable for larger governance-oriented environments
Can support planning and analytics together
Cons
Often more than smaller sales teams need
Enterprise setup can be substantial
10. Oracle Analytics
Oracle Analytics is often considered by large organizations with established Oracle environments and enterprise reporting needs. It can support governed analytics and structured distribution at scale.
Best fit: Enterprises with Oracle alignment and centralized reporting strategy
Pros
Enterprise-oriented governance capabilities
Supports broad analytical use cases
Useful in larger, controlled data environments
Cons
May require substantial IT involvement
Not ideal for teams prioritizing lightweight adoption
The right sales reporting tool depends less on feature lists and more on trade-offs. Most buyers are balancing speed, flexibility, and governance.
Ease of Setup, Adoption, and Maintenance
CRM analytics tools usually win on speed. If your sales data already lives in the CRM and your users want fast access to dashboards, these tools are often easiest to deploy.
BI platforms usually demand more setup because data modeling, transformations, and dashboard design require planning. They can deliver deeper insights, but maintenance often grows with complexity.
Enterprise reporting platforms typically require more structure upfront, especially if the goal is standardized reports across departments, regions, or leadership tiers. The benefit is stronger long-term consistency and control.
Reporting Depth, Forecasting, and Customization
CRM tools are strong for core sales reporting, such as:
For many revenue teams, the biggest challenge is not visualizing data. It is ensuring consistent definitions.
Questions to ask include:
Can the tool combine CRM, ERP, and marketing data reliably?
Can metric definitions be standardized across teams?
Are permissions granular enough for region and hierarchy-based access?
Is report refresh dependable enough for operational decisions?
Can the organization audit what was shared and when?
CRM tools are often strongest inside their own ecosystems. BI platforms are strongest for broader integration. Enterprise reporting tools are strongest where controlled distribution and standardized outputs matter most.
Pricing, Scalability, and Best-Fit Use Cases
A lower entry price does not always mean lower total cost. Consider admin effort, analyst time, dashboard rework, and reporting sprawl.
CRM analytics tools: Often efficient for straightforward sales reporting
BI platforms: Good value when one platform supports many analytical needs across departments
Enterprise reporting platforms: More justified when reporting complexity, governance, and recurring executive distribution are core requirements
Pros, Cons, and Best-Fit Recommendations by Team Type
Best Option Profiles for Startups
Startups generally benefit from CRM-native reporting first. They usually need fast pipeline visibility, rep accountability, and basic forecasting without creating a large reporting project.
Best fit: HubSpot Sales Hub or Pipedrive, depending on CRM preference and workflow style
Why
Faster setup
Lower training burden
Strong enough for early-stage sales processes
Best Option Profiles for Mid-Market Sales Teams
Mid-market teams often hit a transition point. Sales leaders want more than pipeline dashboards, but the organization may not yet need a formal enterprise reporting program.
Best fit: Salesforce reporting for CRM-centric teams, or Power BI/Tableau for teams that need broader analysis
Global enterprises usually need reporting standardization across regions, product lines, and management layers. They also tend to have stronger governance requirements.
Best fit:Enterprise reporting and performance management platforms, sometimes paired with BI
Why
Better permissions and structured distribution
Supports executive reporting consistency
More suitable for formal management reviews and operational governance
Where CRM Analytics Tools Outperform BI Platforms
CRM analytics tools often outperform BI when the priority is:
Quick adoption
Sales-user friendliness
Daily pipeline management
Reporting embedded in CRM workflow
Where BI Platforms Outperform CRM Analytics Tools
BI platforms often outperform CRM reporting when the priority is:
Cross-source analysis
Trend and segmentation analysis
More flexible KPI creation
Shared analytics across sales, finance, and marketing
Where Enterprise Reporting Tools Justify the Investment
Do we mainly report from CRM data, or do we need multi-source reporting?
Who consumes the reports: reps, managers, executives, or all three?
Do we need dashboards only, or also formal recurring reports?
How important are scheduling, permissions, and governance?
Will business users self-serve, or will analysts maintain the system?
Do we need regional standardization and executive-ready formatting?
Common Sales Reporting Templates and Metrics to Standardize
Standardized templates reduce confusion, improve trust, and make performance reviews more productive. They ensure that managers in different regions are not using different definitions for the same KPI.
Core Templates to Standardize
Every revenue team should consider standardizing these templates:
When templates are standardized, managers spend less time debating numbers and more time discussing action. Executives get consistent views across teams. Regional leaders can compare like-for-like performance. RevOps can maintain cleaner governance.
Practical Recommendations for Choosing a Sales Reporting Tool
Here are five practical recommendations based on common reporting evaluation mistakes.
1. Choose for reporting workflow, not just dashboard visuals
A polished dashboard is not enough if your executives still need spreadsheet exports and manual presentations every month.
2. Separate operational reporting from strategic analysis
You may need one tool for frontline dashboarding and another for broader analysis or formal reporting. Do not assume one interface solves every reporting need equally well.
3. Evaluate governance early
As reporting scales, inconsistent metrics become expensive. Review permissions, semantic consistency, and distribution controls before rollout.
4. Test real use cases during demos
Ask vendors to show pipeline reporting, forecast reporting, manager drill-down, and scheduled executive packs using realistic workflows.
5. Plan for adoption beyond sales ops
The most useful sales reporting often involves finance, operations, and leadership. Choose a platform that can support those stakeholders, not just frontline reps.
Tools like Salesforce, HubSpot, Power BI, and Tableau are widely used for sales dashboards and BI analysis. But teams with complex reporting workflows may also need a dedicated enterprise reporting platform like FineReport.
FineReport is especially relevant when a sales reporting tool must do more than display visual KPIs. For example, many enterprises need:
Pixel-perfect sales reports for executives and management reviews
Paginated and printable reports for formal reporting packs
Parameter queries so users can filter by manager, region, segment, or period
Scheduled distribution for recurring stakeholder updates
Dashboards plus detailed reports in one reporting workflow
Sales operations reporting tied to workflow approvals or submissions
FineReport is not a replacement for every CRM analytics or BI use case. Rather, it is a practical option when your organization needs a stronger reporting layer for structured, repeatable, and governed business reporting.
Get Ready-to-Use Dashboard and Report Templates in Fine Gallery
Final Thoughts
The best sales reporting tool in 2026 depends on what your team needs most:
Choose CRM analytics tools for speed and in-workflow reporting
Choose BI platforms for cross-source analysis and deeper trends
Choose enterprise reporting platforms for governance, standardized outputs, and executive-ready reporting
For many organizations, the right answer is not purely CRM or BI. As sales reporting grows more complex, teams often need a reporting layer that supports dashboards, structured reports, automation, and governance together. That is where FineReport can be a strong fit.
A sales reporting tool helps teams track pipeline, rep performance, forecast accuracy, and revenue trends in a structured way. It turns raw sales data into dashboards and reports that managers and executives can act on.
CRM-native reports are usually enough when most important data already lives in the CRM and the team mainly needs pipeline views, rep dashboards, and basic forecast tracking. They are often a strong fit for smaller teams that want fast setup and simple reporting.
BI platforms are better for analyzing sales data across multiple systems like CRM, finance, and marketing. Enterprise reporting tools are stronger when you need standardized KPI definitions, governed access, scheduled distribution, and highly formatted reports at scale.
Most teams rely on pipeline, forecast, win rate, sales activity, rep performance, regional performance, and deal aging reports. These reports help leaders spot bottlenecks, measure execution, and make better planning decisions.
Start by defining whether you need simple CRM dashboards, cross-source analysis, or governed enterprise reporting. Then compare tools based on integrations, reporting depth, scheduling, permissions, ease of use, and how well they support your sales process.
Product Trial
FineReport
Pixel-perfect reports · Interactive dashboards · Easy data entry · Digital twins


 Salesforce is widely used by large and growing sales organizations and includes mature
  HubSpot is popular with small and mid-sized teams that want easier setup and a cleaner user experience. Its reporting is practical for tracking
 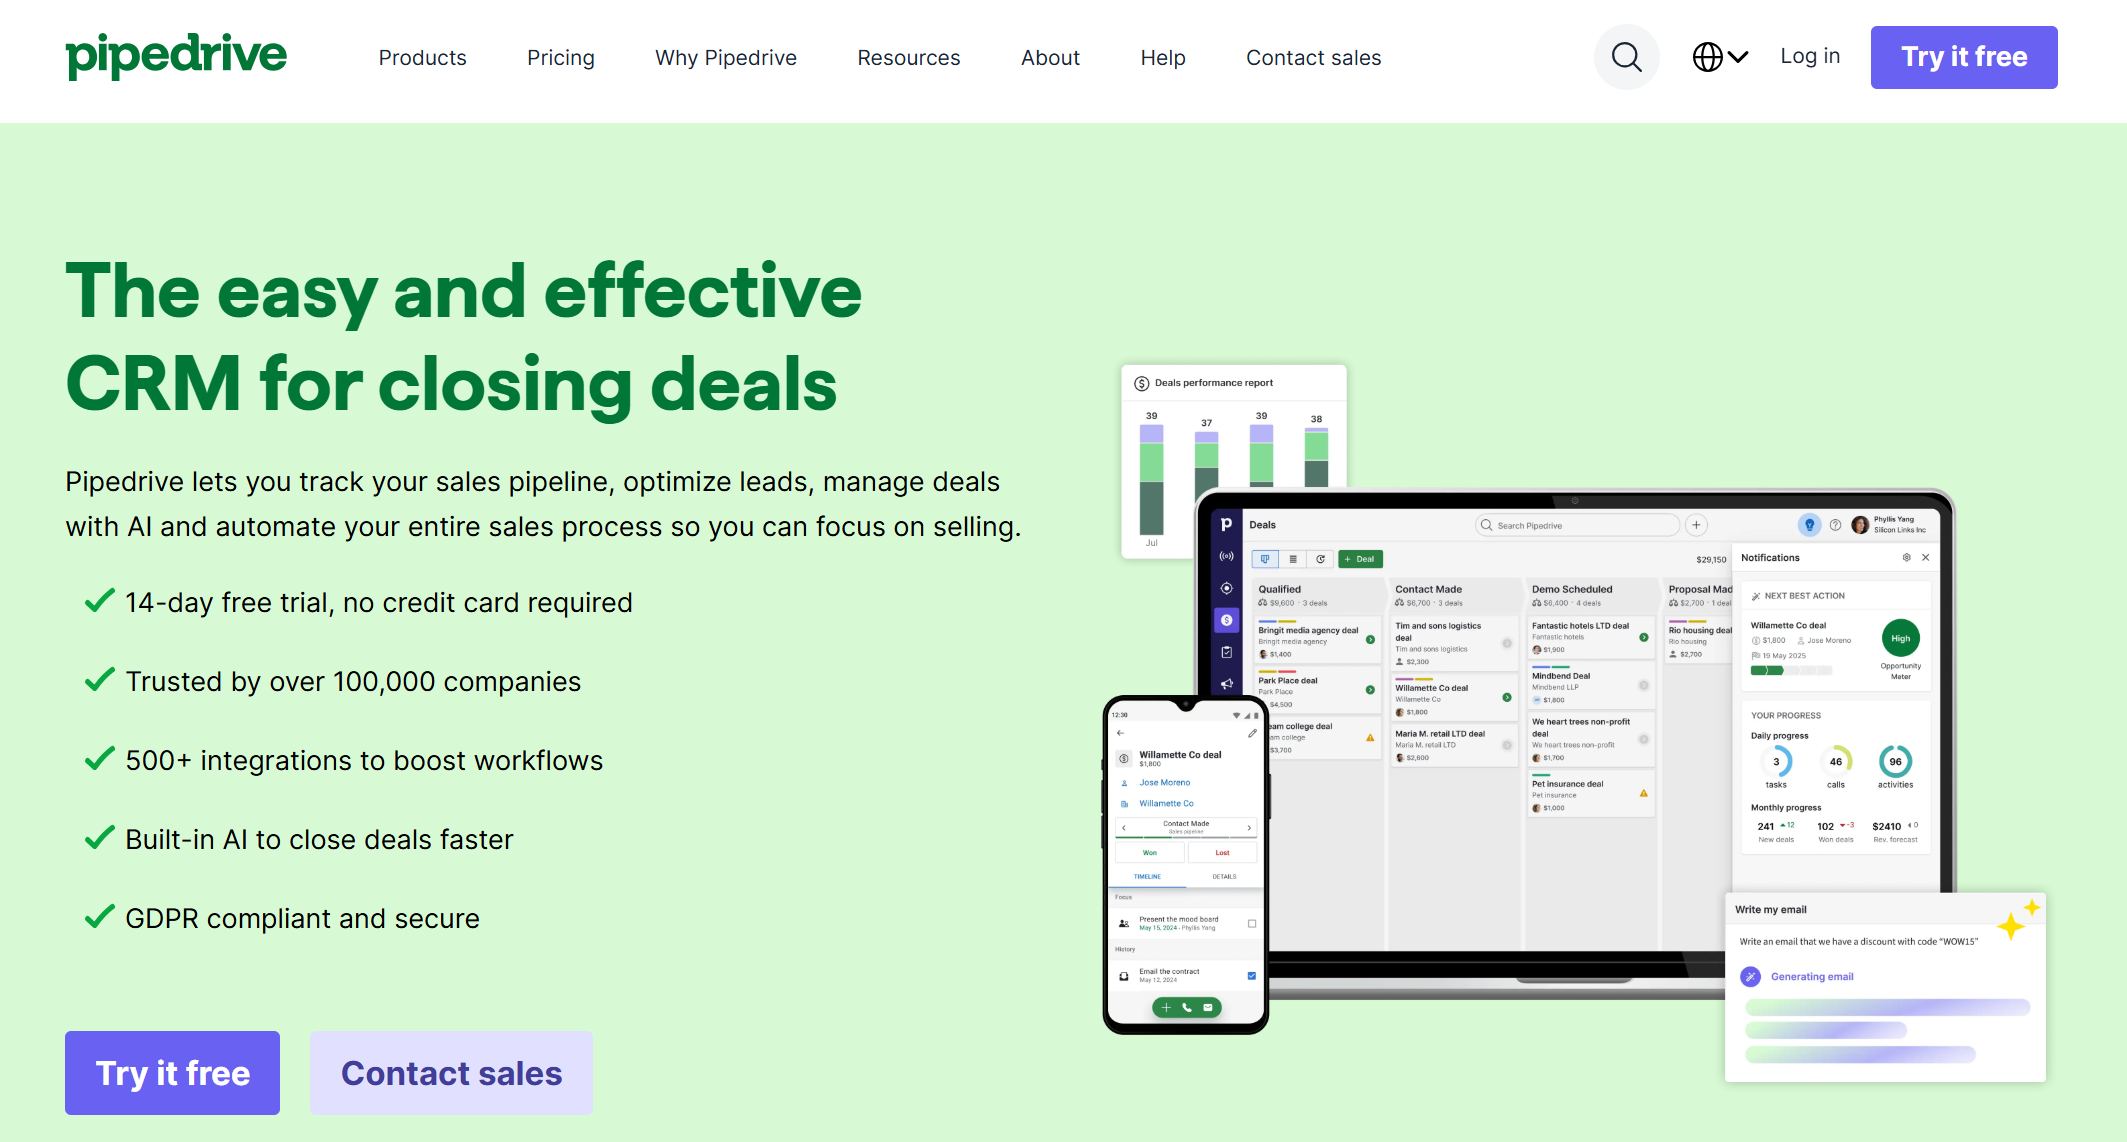 Pipedrive focuses on pipeline visibility and ease of use. It works well for teams that want visual deal tracking and lightweight reporting without significant implementation overhead.
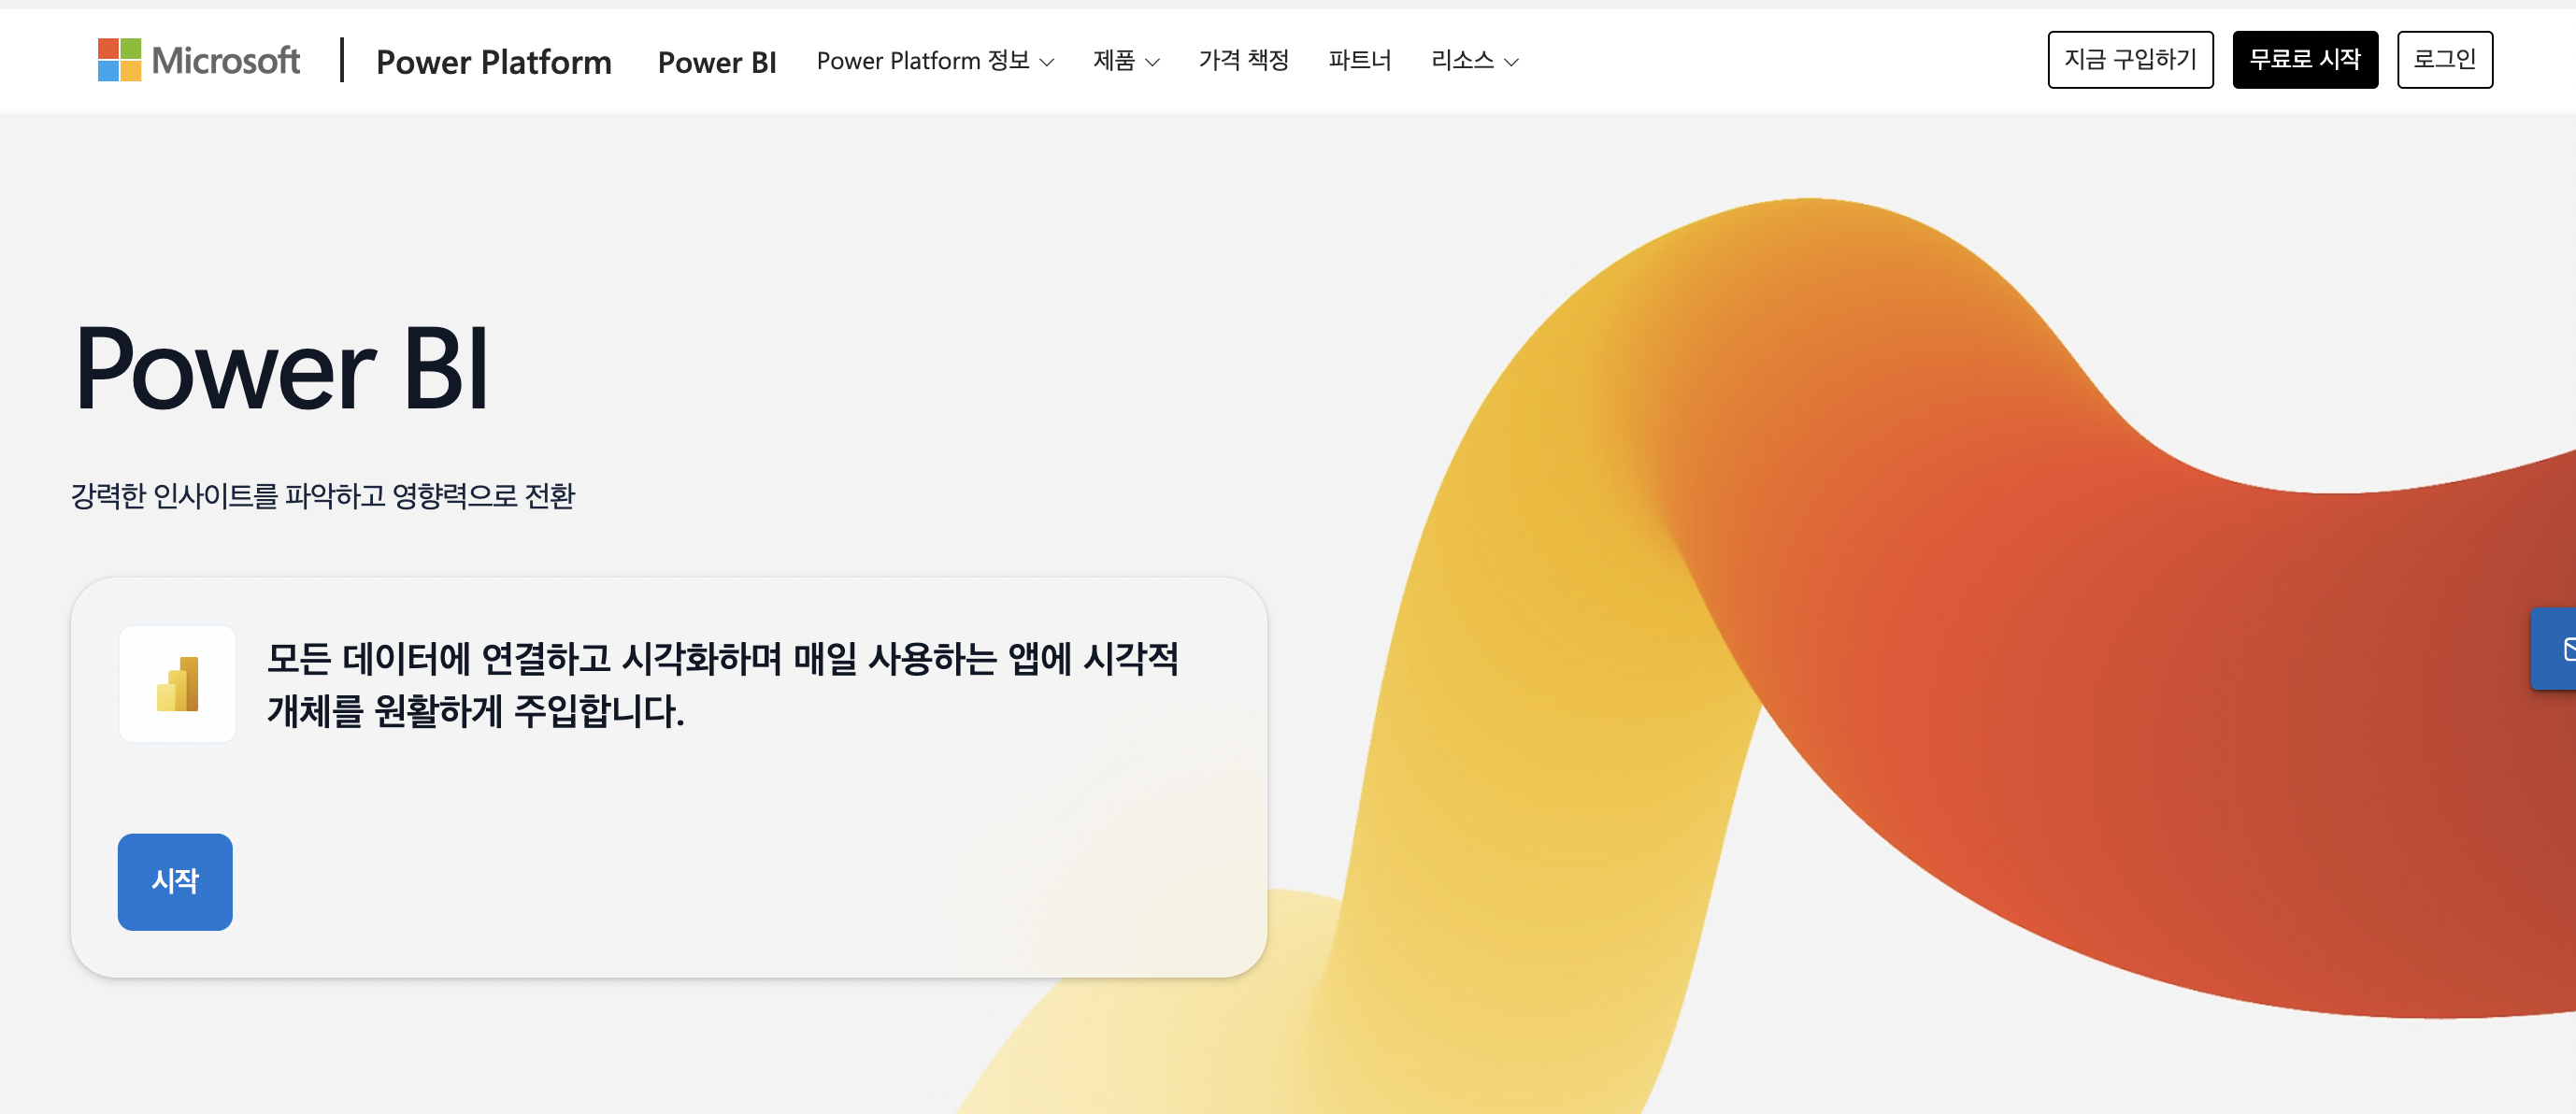 Power BI is a common choice for organizations that already use Microsoft tools and need flexible BI for sales, finance, and operations reporting. It is well suited for cross-source dashboards and trend analysis.
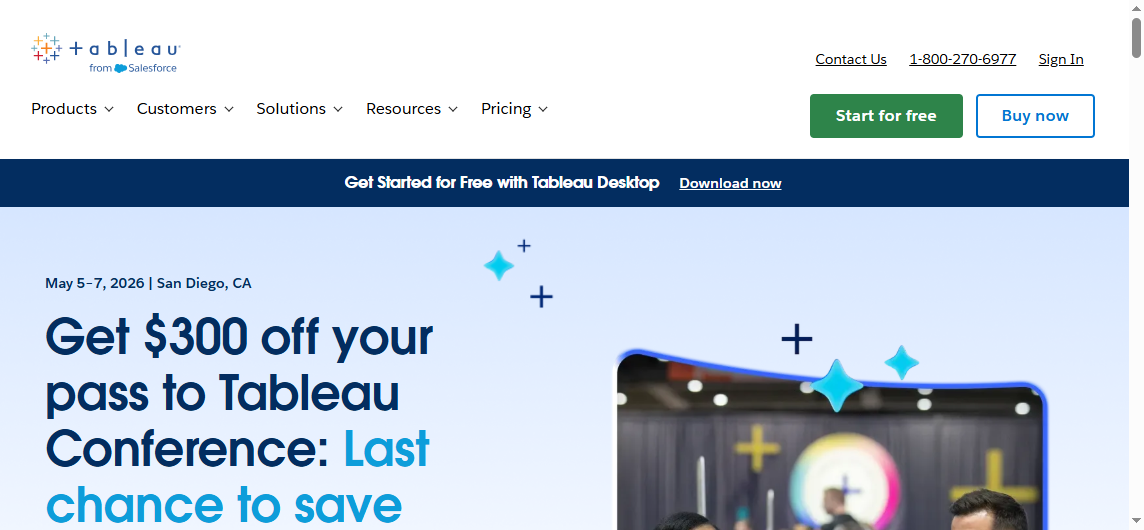 Tableau is widely recognized for visual analytics and exploratory dashboards. Sales teams use it to analyze pipeline, segment performance, and trends across many
 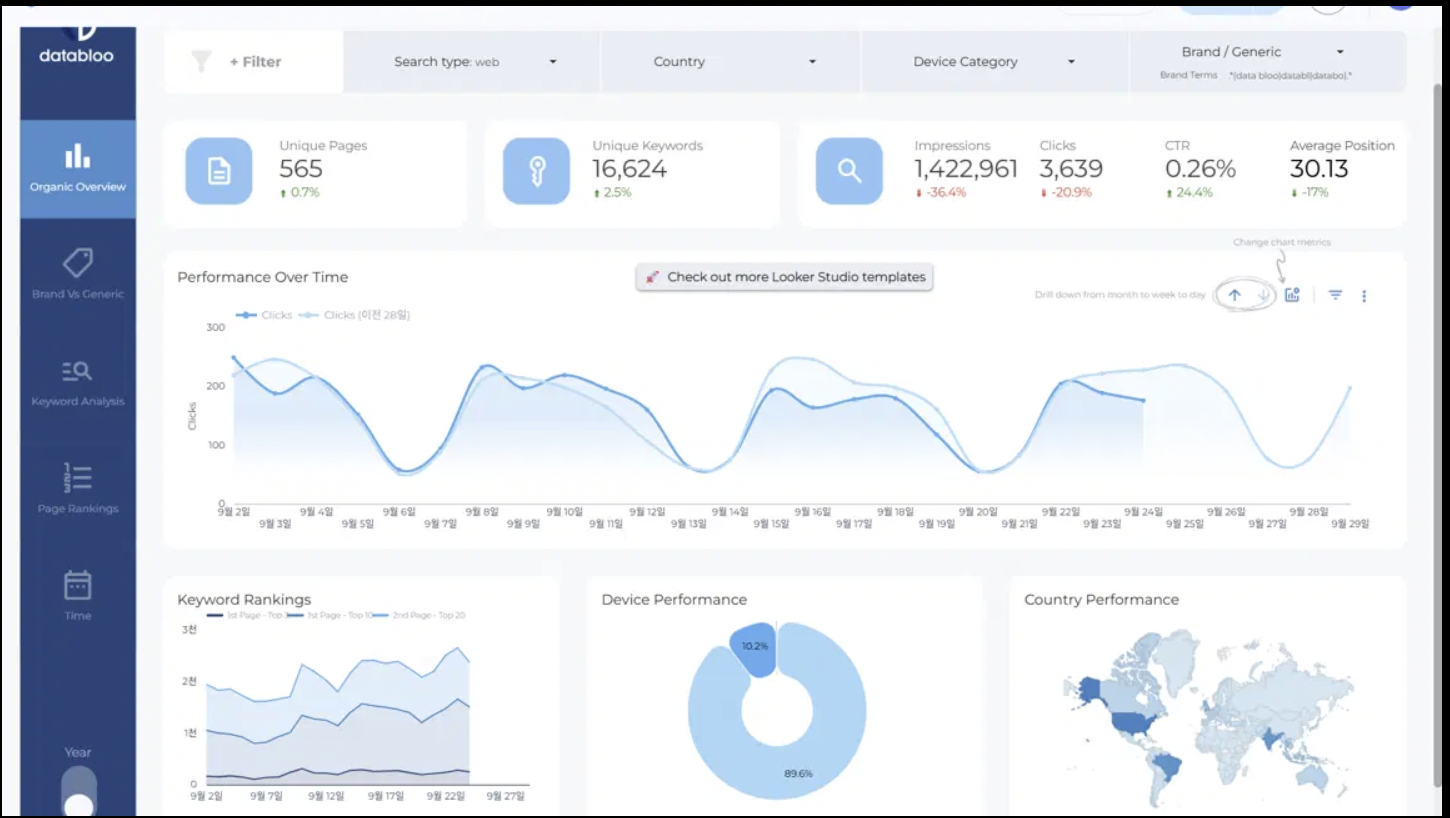 Looker is often chosen by organizations that want governed metrics and modeled analytics on top of cloud data environments. It can be a good fit when sales reporting depends on warehouse-centered data strategy.
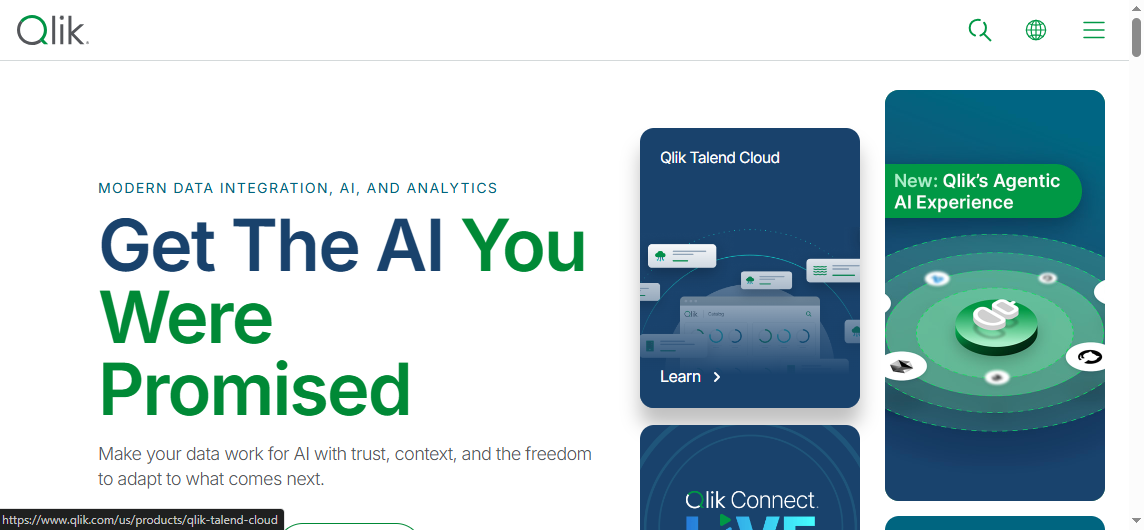 Qlik remains a relevant option for organizations that want interactive analysis and associative exploration of business data. It can support sales trend analysis and multi-source reporting.
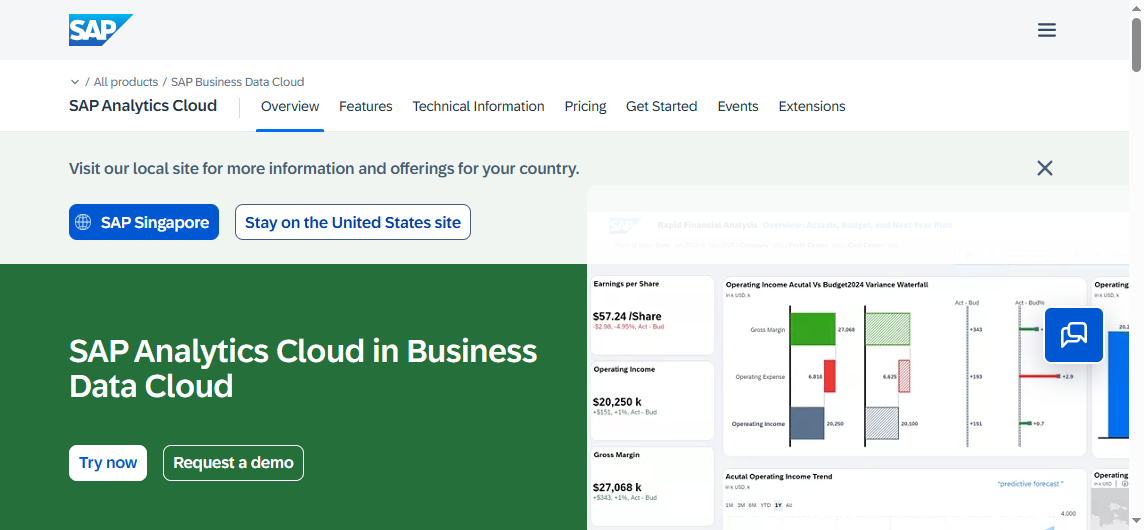 SAP Analytics Cloud is relevant for organizations operating in larger
 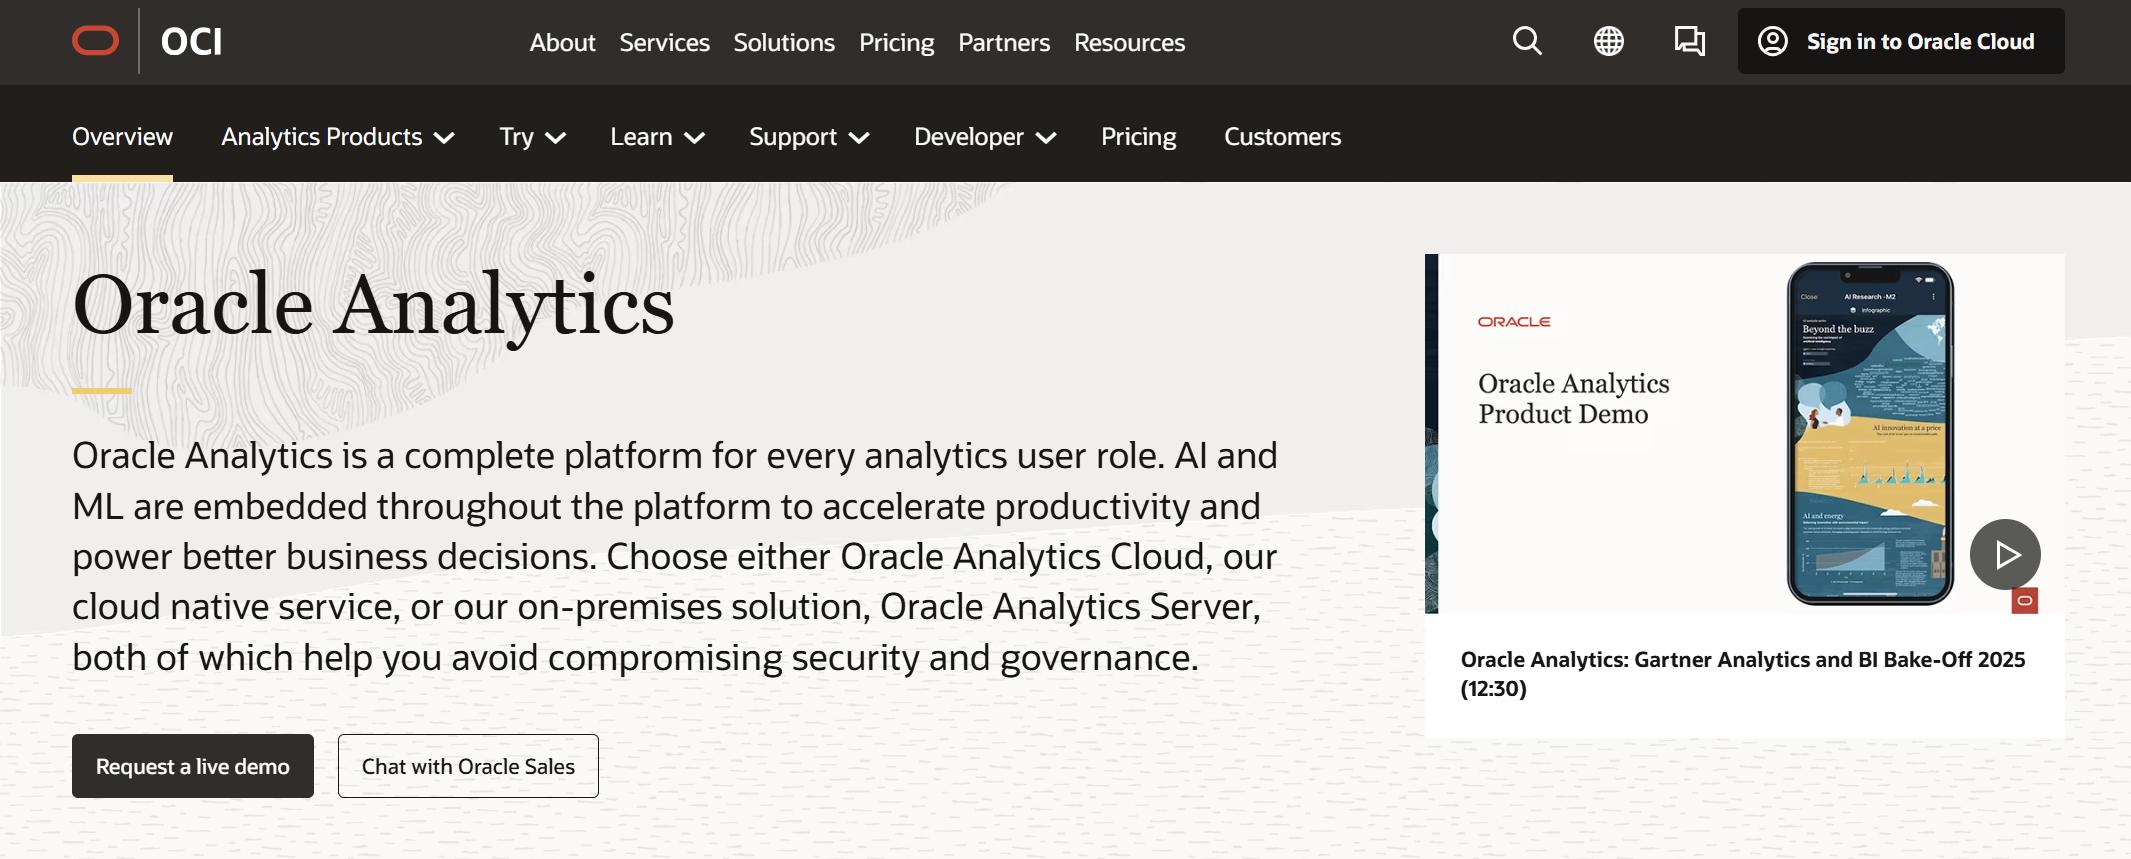 Oracle Analytics is often considered by large organizations with established Oracle environments and