Environmental social and governance reporting is no longer a side project for sustainability teams. It is now a management discipline that affects investor confidence, regulatory readiness, capital access, brand trust, and board oversight. For IT managers, finance leaders, compliance teams, and operations directors, the real challenge is not understanding that ESG matters. It is turning scattered emissions files, HR metrics, supplier records, audit logs, and policy data into one reliable dashboard that leadership can actually use. This guide shows you how to build an ESG reporting dashboard step by step so your organization can move from fragmented disclosure work to decision-ready reporting.
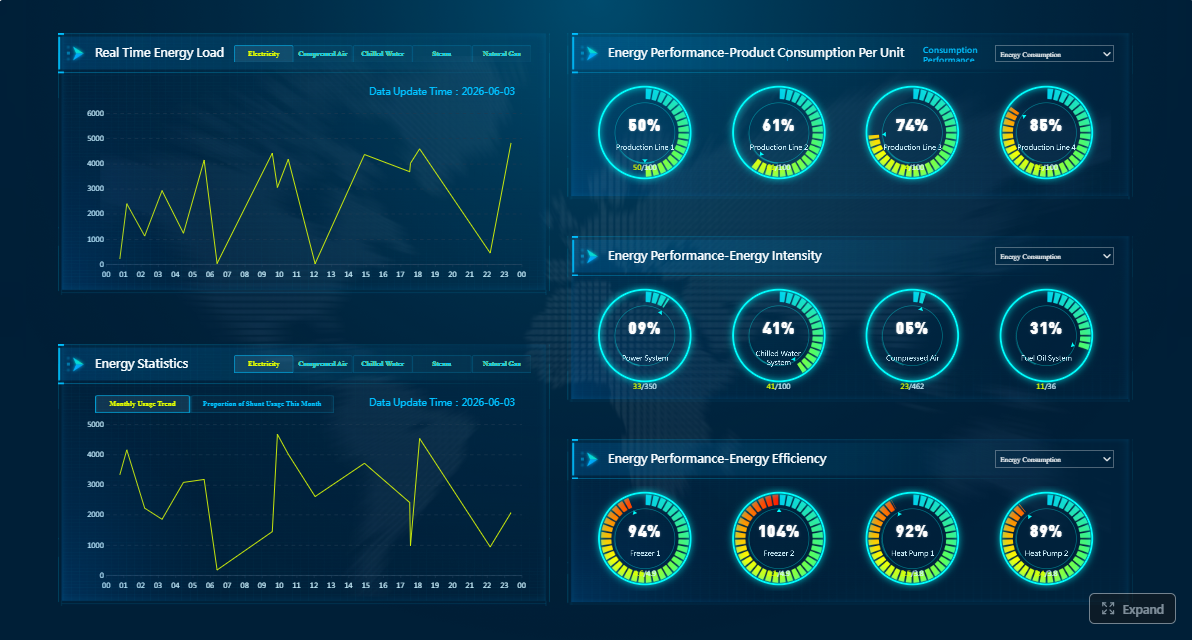 Click To Try The Dashboard
All reports in this article are built with FineReport
Why environmental social and governance reporting matters for modern organizations
Environmental social and governance reporting helps organizations measure performance beyond revenue, margin, and cash flow. It gives leaders and external stakeholders a structured view of how the business manages climate impact, people-related risks, ethical conduct, and governance quality. That matters because investors increasingly evaluate resilience, customers compare suppliers on sustainability expectations, regulators demand more transparency, and boards need better visibility into non-financial risk.
For most organizations, the real operational problem is data fragmentation. Environmental data may sit in utility invoices, carbon accounting tools, or plant systems. Social data often lives in HR platforms, safety logs, and engagement surveys. Governance data may be split across legal, compliance, audit, and board reporting workflows. Without a dashboard, reporting becomes slow, manual, inconsistent, and hard to defend.
A structured ESG dashboard changes that. It consolidates metrics, standardizes definitions, tracks progress against targets, and gives decision-makers one source of truth. Instead of producing ESG reports once a year through spreadsheet-heavy effort, teams can monitor trends continuously, identify gaps early, and prepare disclosures with more confidence.
This article will help you understand what ESG reporting includes, how to plan a dashboard around the right audience and metrics, how to build the reporting structure, and how to maintain the dashboard as expectations evolve.
What ESG reporting is and how it connects to sustainability disclosures
ESG reporting is the structured disclosure of data related to environmental, social, and governance performance. In plain language, it is how an organization measures and communicates how it manages sustainability-related risks, impacts, and responsibilities using defined metrics and controls.
Sustainability storytelling is broader. It often includes narrative about mission, community impact, innovation, and long-term commitments. ESG reporting is more disciplined. It focuses on measurable indicators, reporting boundaries, material topics, targets, and governance processes.

The three pillars of ESG reporting are straightforward:
- Environmental: How the organization uses energy and resources, manages emissions, handles waste, and addresses environmental impacts.
- Social: How it manages workforce conditions, health and safety, diversity, labor practices, community impact, and human rights considerations.
- Governance: How it is directed and controlled through board oversight, ethics, compliance, risk management, executive accountability, and internal controls.
It is also important to separate internal management reporting from external stakeholder disclosures. Internal reporting supports decisions: where emissions are rising, which sites have safety issues, which suppliers need review, or where diversity targets are off track. External disclosures are designed for investors, regulators, lenders, and customers who need standardized, defensible information.
Common ESG topics organizations track
Most organizations track a mix of quantitative and qualitative topics, including:
- Greenhouse gas emissions: Scope 1, Scope 2, and where relevant, Scope 3 categories
- Energy use: Total consumption, renewable share, intensity by facility or production output
- Water: Withdrawal, discharge, recycling, and site-level stress exposure
- Waste: Generation, hazardous waste, recycling rate, landfill diversion
- Workforce metrics: Headcount, turnover, training, absenteeism, and engagement
- Diversity metrics: Representation by gender, ethnicity, leadership level, and hiring pipeline
- Health and safety: Incident rates, lost-time injuries, near misses, corrective actions
- Ethics and compliance: Hotline cases, training completion, policy acknowledgments, investigations
- Risk management: ESG risk assessments, internal controls, remediation status
- Board oversight: Committee structures, meeting cadence, policy approval, accountability mapping
Who uses ESG reports and why
Different stakeholders rely on ESG data for different decisions:
- Investors: Assess risk exposure, long-term resilience, and governance quality
- CFOs: Connect ESG performance to capital planning, assurance readiness, and disclosure risk
- Boards: Monitor oversight responsibilities, strategic exposure, and target progress
- Customers: Evaluate supplier credibility and procurement alignment
- Employees: Judge culture, inclusion, and trust in leadership commitments
- Lenders: Factor ESG risk into financing terms and due diligence
- Regulators: Review disclosure completeness, consistency, and compliance posture
How to plan your ESG reporting dashboard
A strong ESG dashboard starts with planning, not visualization. Teams often fail by jumping straight into chart design before defining audience, material issues, metric ownership, and reporting controls.
First, clarify who the dashboard is for. A board committee needs a concise summary of material trends, emerging risks, and target status. Operations leaders need site-level drill-downs. Compliance teams need traceability, documentation, and disclosure alignment. One ESG dashboard rarely serves everyone equally well unless it is designed with role-based views.
Second, define the business goal. Are you building for quarterly management reviews, annual disclosure readiness, customer questionnaires, financing discussions, or all of the above? The use case determines the level of detail, frequency, and control requirements.
Third, establish reporting frequency. Monthly monitoring supports corrective action. Quarterly reporting supports executive governance. Annual reporting supports disclosures, but annual-only tracking usually creates avoidable surprises.
Fourth, identify data owners and source systems before design begins. If no one owns the data, no dashboard will stay credible. Each metric should have a business owner, technical source, approval workflow, and update schedule.
Decide which frameworks and disclosure requirements to follow
Framework alignment should be decided early. The correct reporting expectations depend on your industry, geography, investor base, and customer requirements. Some organizations need investor-focused disclosure alignment. Others need more detailed environmental and social impact reporting. Many need a hybrid approach.
At planning stage, answer these questions:
- Which regulatory requirements apply to the organization?
- Which voluntary standards are expected by investors or customers?
- Which topics are material to the business model and risk profile?
- Do you need site-level, entity-level, regional, or group-level reporting?
- Will you require audit support or assurance preparation?
Your dashboard should not blindly mirror every framework. It should map internal metrics to the disclosure requirements that matter most.
Define dashboard views for different decision-makers
An effective ESG reporting dashboard usually includes multiple views:
- Executive summary view: High-level KPIs, trend indicators, target progress, and top risks
- Operational view: Site, plant, region, department, or supplier-level detail for action-taking
- Compliance view: Disclosure mapping, evidence links, sign-offs, and version history
- Board view: Strategic summaries, material deviations, policy oversight, and escalation items
This role-based design prevents clutter and improves usability.
Step-by-step process for building the dashboard
The best ESG dashboards are built through a disciplined process. Below is the practical framework I recommend when advising enterprise teams.
1. Audit current data sources and assess data quality
Start by inventorying all relevant ESG data sources. Include spreadsheets, ERP systems, HRIS platforms, EHS software, procurement tools, audit systems, utility data, and manual submissions from business units.
For each source, assess:
- Data completeness
- Update frequency
- Ownership
- Historical coverage
- Consistency across sites or regions
- Known control weaknesses
- Whether the data is estimated, calculated, or system-generated
This is where many ESG projects uncover the real issue: the organization does not have a dashboard problem, it has a data governance problem.
2. Create a metric dictionary
Before building visuals, document every KPI in a metric dictionary. This avoids endless confusion later.
Your metric dictionary should define:
- Metric name
- Business purpose
- Formula
- Unit of measure
- Reporting period
- Organizational boundary
- Inclusion and exclusion rules
- Data source
- Data owner
- Approval owner
- Disclosure mapping
This step is critical for environmental social and governance reporting because similar metrics can be calculated in very different ways across departments.
3. Build a reporting structure that supports decisions
An ESG dashboard should not be a wall of disconnected charts. It should answer practical management questions:
- Are we improving or declining?
- Are we meeting targets?
- Where are the biggest gaps?
- Which regions, plants, teams, or suppliers are driving the result?
- What action is required next?
A strong reporting structure combines:
- Historical trends
- Current-period status
- Target tracking
- Benchmark comparisons
- Exceptions and alerts
- Narrative context for interpretation
4. Establish review, approval, and version control workflows
If ESG data may be disclosed externally, your dashboard needs governance discipline. Build workflows for submission, validation, approval, and publication.
At a minimum, include:
- Draft and final status indicators
- Reviewer assignments
- Approval timestamps
- Change logs
- Locked reporting periods
- Archived versions for traceability
These controls reduce the risk of inconsistent numbers appearing across reports, board papers, and regulatory submissions.
5. Pilot the dashboard before full rollout
Do not launch the dashboard enterprise-wide without testing. Run a pilot with a representative group from finance, sustainability, compliance, operations, and leadership. Ask them whether the dashboard answers their actual decisions, not whether the charts look attractive.
Test for:
- Metric clarity
- Filter logic
- Drill-down usefulness
- Data reconciliation
- Export consistency
- Approval workflow usability
- Executive readability
Design dashboard components that improve usability
Good ESG dashboards make complexity easier to understand. Bad ones overwhelm users with too many indicators and technical labels.
Use these design principles:
- Highlight core KPIs at the top
- Use trend lines to show direction over time
- Add filters for region, site, business unit, or reporting period
- Include drill-down views for investigation
- Use status colors sparingly and consistently
- Add short metric definitions or hover explanations
- Keep executive pages concise
Key Metrics (KPIs)
A high-performing ESG dashboard typically includes a tightly governed KPI set such as:
- Total GHG emissions: Measures absolute greenhouse gas output across defined scopes.
- Emissions intensity: Shows emissions relative to revenue, output, or another business denominator.
- Energy consumption: Tracks total energy use across facilities or operations.
- Renewable energy share: Indicates the percentage of energy sourced from renewables.
- Water withdrawal: Measures total water consumed or extracted for operations.
- Waste diversion rate: Shows the percentage of waste diverted from landfill through reuse or recycling.
- Recordable incident rate: Measures workplace safety incidents relative to hours worked.
- Employee turnover rate: Tracks workforce stability and retention trends.
- Diversity representation: Measures representation across workforce levels and key groups.
- Training completion rate: Shows completion of required ethics, compliance, or ESG-related training.
- Policy breach cases: Tracks reported ethics or compliance incidents.
- Board ESG oversight activity: Measures governance engagement through reviews, meetings, or approvals.
- Target achievement status: Shows progress toward internal ESG commitments.
- Data completeness rate: Measures whether required submissions were delivered on time and in full.
- Assurance readiness status: Indicates whether data, evidence, and controls are sufficient for review or assurance.

Integrate controls for accuracy and disclosure readiness
For enterprise reporting, dashboard usability is only half the job. Accuracy and auditability matter just as much.
Build in control mechanisms such as:
- Automated validation rules
- Threshold alerts for abnormal values
- Reconciliation checks against source systems
- Evidence attachment fields
- Audit trails for changes
- Submission deadlines and reminders
- Documentation panels linked to metric definitions
These controls support disclosure readiness and reduce the burden of rechecking every number manually.
Test the dashboard with stakeholders before launch
A credible ESG dashboard should be reviewed across functions because ESG data spans the business. Finance can validate reconciliation logic. Sustainability can confirm methodology. Compliance can check control adequacy. Leadership can confirm strategic usefulness.
In testing sessions, ask questions like:
- Which metrics are most decision-useful?
- Which views are too detailed or too shallow?
- Are the targets clearly visible?
- Can users understand what changed and why?
- Is there enough evidence to support disclosure use?
Best practices for maintaining and improving ESG reporting over time
Once the dashboard is live, the real work begins. ESG reporting is not static. Metrics evolve, frameworks change, stakeholder expectations shift, and organizational priorities move with them.
The strongest teams treat the dashboard as a managed product, not a one-time project.
1. Refresh metrics as priorities and regulations evolve
Review your KPI set regularly. Some metrics become less useful over time, while others become mandatory or strategically important. Keep the dashboard focused on what is material and actionable.
2. Improve automation to reduce manual effort
Manual ESG reporting consumes time and increases risk. Prioritize automation for recurring data feeds, validation checks, approval reminders, and report generation. This allows teams to spend more time interpreting trends and less time compiling spreadsheets.
3. Review whether outputs support board and management decisions
A dashboard is valuable only if it changes decisions. Periodically ask whether leaders use the outputs to set targets, allocate resources, monitor risk, or intervene in underperforming areas.
4. Strengthen governance as reporting matures
As ESG disclosures become more formal, controls must mature too. Strengthen roles, sign-offs, documentation standards, and change management so the dashboard remains trustworthy under internal review or external scrutiny.
Common mistakes to avoid
The most common ESG dashboard failures are predictable:
- Tracking too many metrics: More data does not mean better management.
- Using inconsistent definitions: Different business units interpreting metrics differently undermines trust.
- Ignoring governance controls: A visually impressive dashboard is useless if the data cannot be defended.
- Overlooking audience needs: Executives, operators, and compliance teams need different views.
- Relying on annual-only updates: Infrequent reporting hides emerging issues until it is too late.
- Separating ESG from business planning: ESG insights should influence operations, risk, and capital decisions.

When to seek outside support
External support may be the right move when internal teams face one or more of these conditions:
- ESG data lives across too many disconnected systems
- Disclosure requirements are changing quickly
- Leadership needs dashboards fast
- Assurance preparation is becoming a priority
- Internal teams lack dashboard architecture or reporting workflow expertise
A specialist partner can help design the reporting model, structure metric governance, and accelerate implementation without forcing teams into trial-and-error cycles.
How to turn dashboard insights into action
The goal of environmental social and governance reporting is not to publish more charts. It is to improve decisions.
When your dashboard is working well, it should help leadership do three things:
- Set smarter targets: Use trend and baseline data to define realistic but meaningful goals
- Prioritize initiatives: Direct resources toward sites, teams, or processes with the biggest performance gaps
- Communicate progress clearly: Share consistent, evidence-backed updates with boards, investors, customers, and employees
Dashboard insights should also connect directly to core business management. Rising energy intensity may trigger capital investment reviews. Safety trends may reshape training programs. Supplier risk signals may influence sourcing decisions. Governance gaps may lead to policy revisions or stronger oversight routines.
The most mature organizations use ESG dashboards as a bridge between reporting and execution. They move from basic disclosure to a living management system that supports risk reduction, operational improvement, and strategic credibility.
Build the workflow faster with FineReport
Building this manually is complex; use FineReport to utilize ready-made templates and automate this entire workflow.
FineReport helps organizations turn ESG reporting from a spreadsheet-heavy exercise into a governed, visual, and scalable dashboard system. Instead of stitching together data manually from multiple departments, teams can connect data sources, standardize KPIs, build role-based dashboards, automate refresh cycles, and apply approval workflows in one reporting environment.
That matters for ESG programs because success depends on more than charting. You need reliable integration, metric consistency, drill-down analysis, scheduled distribution, and traceable workflows for disclosure readiness. FineReport supports exactly that operating model.
With FineReport, you can:
- Build executive ESG summaries and detailed operational views
- Connect environmental, HR, compliance, and financial data sources
- Standardize formulas and definitions across business units
- Add filters, drill-downs, alerts, and scheduled reporting
- Support governance with controlled workflows and consistent output
- Accelerate delivery with reusable dashboard templates

Get Ready-to-Use Dashboard Templates in Fine Gallery
If your organization is trying to improve ESG disclosure quality, reduce reporting effort, and give leadership a clearer view of sustainability performance, a dedicated reporting platform will outperform a patchwork of spreadsheets and slide decks.
FAQs
ESG reporting is the structured disclosure of measurable environmental, social, and governance data. Sustainability reporting is often broader and more narrative, while ESG reporting focuses on defined metrics, controls, and decision-useful disclosures.
An ESG dashboard brings scattered data from finance, HR, operations, compliance, and suppliers into one reliable view. This helps teams monitor performance continuously, reduce manual reporting work, and prepare more defensible disclosures.
Most dashboards include emissions, energy, water, waste, workforce diversity, health and safety, ethics, compliance, risk, and board oversight metrics. The final selection should match your business goals, reporting requirements, and material topics.
Internal users often include executives, CFOs, boards, compliance teams, and operations leaders who need data for planning and oversight. External users typically include investors, regulators, lenders, customers, and other stakeholders evaluating risk and performance.
Start by standardizing metric definitions, assigning data owners, and documenting reporting boundaries and calculation methods. A centralized dashboard with validation rules and traceable source data makes reviews, assurance, and updates much easier.


The Author
Yida Yin
FanRuan Industry Solutions Expert
Related Articles

Inventory Reporting: The KPI Framework That Prevents Stockouts, Overstock, and Margin Leakage
Inventory reporting is the operating system behind smarter replenishment, tighter working capital control, and more reliable customer service. For supply chain leaders, finance managers, and operations directors, the cha
Yida Yin
Jun 25, 2026

Best Oil and Gas Production Reporting Software in 2026: 7 Tools Compared for Operators
$1 is an $1 and dashboard platform that helps oil and gas teams turn production, operations, and business data into governed, shareable reports and real time $1. Best oil and gas production reporting software in 2026 at
Yida Yin
Jun 24, 2026

ESG Reporting Process: A 7-Step Operating Model for Cross-Functional Teams
The $1 process is no longer a year end publishing task. It is an operating model for collecting decision useful data, coordinating multiple business functions, maintaining control over disclosures, and producing reports
Yida Yin
Jun 23, 2026