A marketing reporting template is not just a formatting tool. It is the operating framework that helps marketing leaders turn channel data, campaign activity, and attribution signals into a business story executives can act on. If you are reporting to a CMO, CFO, revenue leader, or CEO, the challenge is rarely a lack of data. The real problem is too much disconnected data, inconsistent definitions, and reports that describe activity without proving commercial impact. An executive-ready monthly report solves that by linking marketing performance to pipeline, revenue, efficiency, and forecast confidence.
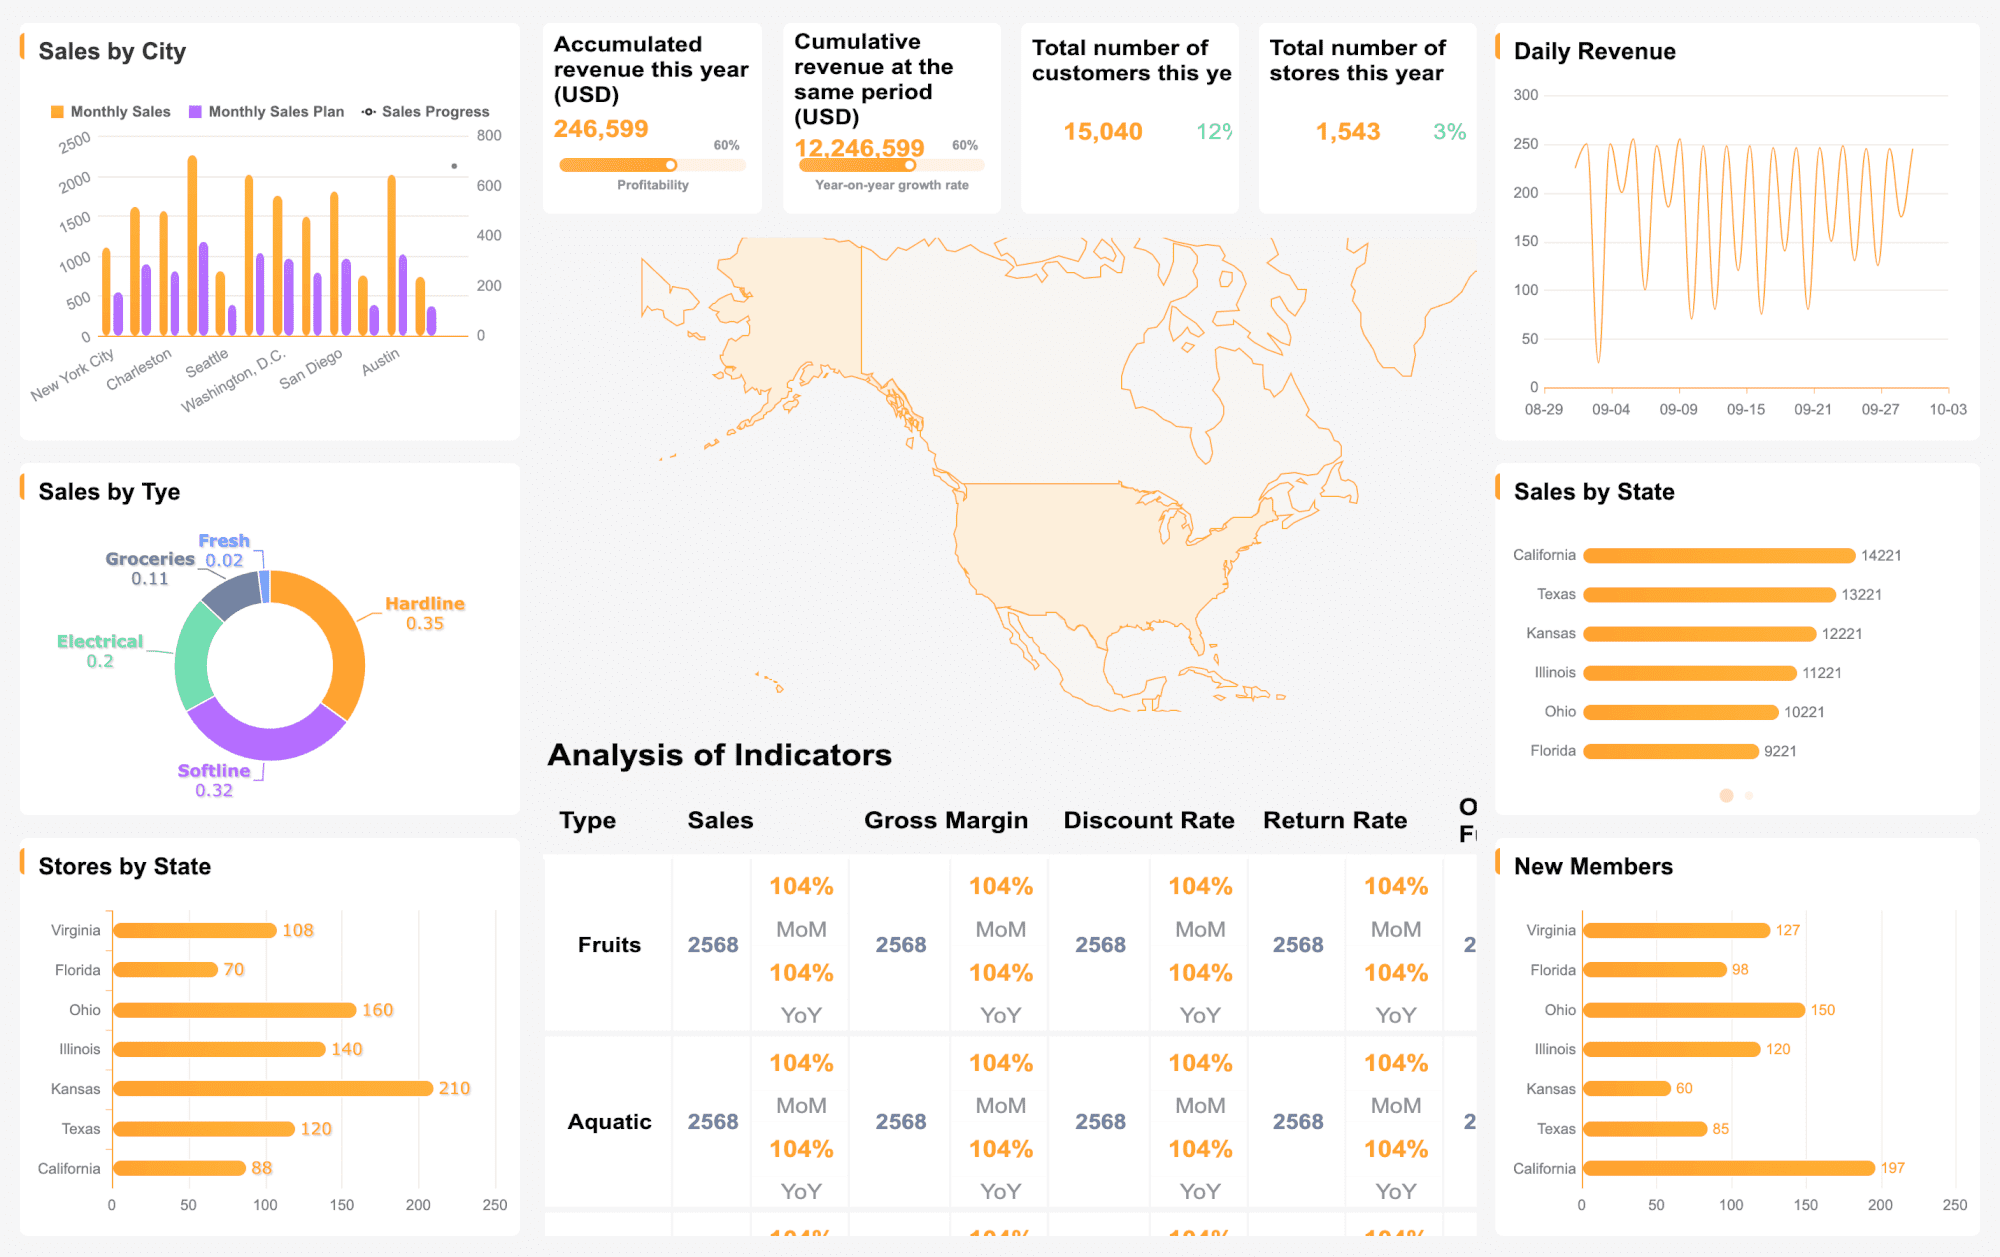
 Click To Try The Dashboard
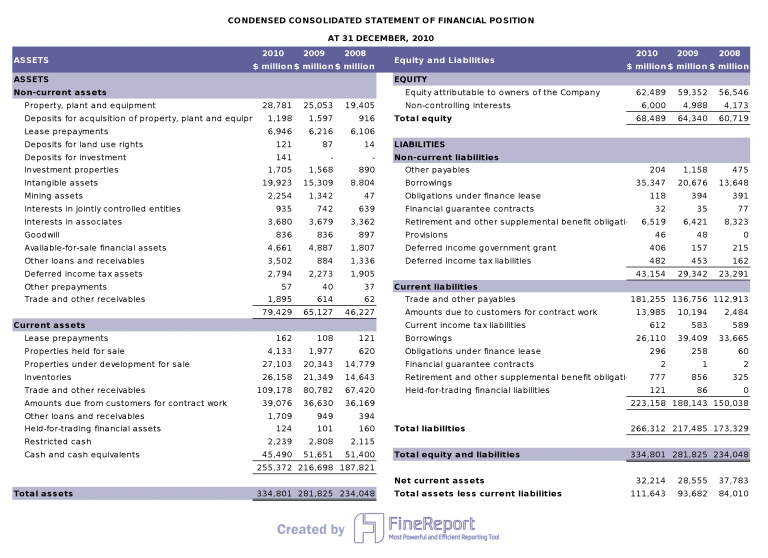
All reports in this article are built with FineReport
What a marketing reporting template should accomplish
A strong monthly marketing report must work for three audiences at once: executives who need strategic clarity, marketing managers who need performance context, and channel owners who need actionable direction. That means the template should not simply list metrics. It should explain what changed, why it changed, and what the business should do next.
For executives, the report should answer questions like: Are we contributing to revenue growth? Are acquisition costs under control? Which channels deserve more budget? For managers, it should reveal where conversion rates, campaign quality, or lead flow improved or declined. For channel owners, it should clarify where optimizations are needed at the campaign, audience, or funnel-stage level.
A well-designed marketing reporting template turns fragmented metrics into a coherent revenue narrative. Website sessions, ad spend, MQLs, SQLs, conversion rates, and closed-won revenue should not appear as isolated figures. They should connect across the funnel so stakeholders can see how top-of-funnel activity translates into downstream business outcomes.
Just as important, the template must distinguish between three different reporting jobs:
- Reporting activity: What campaigns launched, what assets shipped, what budget was spent
- Measuring performance: What results were achieved against KPI targets
- Guiding decisions: What should change next month based on evidence
If your report does not support decisions, it is only documentation.
Core sections every executive-ready monthly marketing report needs
An executive-ready monthly report should be concise in structure but rigorous in logic. The following sections create the right balance between summary, accountability, and operational depth.
Executive summary and business context
Start with plain language, not jargon. Executives should understand the month’s headline story in less than two minutes.
Your executive summary should cover:
- The biggest wins
- The most material risks
- The major changes in market conditions, budget, audience behavior, or campaign mix
- The implications for pipeline and revenue
For example, instead of saying “paid social CTR improved 18%,” say “paid social creative refresh improved engagement and lowered cost per lead, but conversion quality declined in mid-funnel follow-up.” That framing is more useful because it connects the metric to business consequence.
The business context section should also align marketing outcomes to larger company goals such as revenue growth, market expansion, product adoption, or pipeline coverage.

KPI performance snapshot
This section should provide a fast, scannable view of what matters most. The goal is not to show every available metric. The goal is to show the right metrics in the right hierarchy.
Separate leading indicators from lagging outcomes:
- Leading indicators help predict future performance
- Lagging indicators confirm business results already realized
Key Metrics (KPIs)
- Marketing-sourced pipeline: Total pipeline value created directly from marketing-generated leads or opportunities
- Influenced revenue: Revenue from deals where marketing had a measurable contribution during the buyer journey
- Lead-to-opportunity conversion rate: Percentage of leads that progressed into qualified opportunities
- Opportunity-to-win rate: Percentage of opportunities that converted into closed revenue
- Customer acquisition cost (CAC): Total marketing and sales investment required to acquire a new customer
- Return on ad spend (ROAS): Revenue generated for every dollar spent on advertising
- Cost per lead (CPL): Average cost to generate one lead
- Marketing qualified leads (MQLs): Leads that meet predefined qualification criteria and indicate buying potential
- Sales qualified leads (SQLs): Leads accepted by sales as ready for deeper pursuit
- Website conversion rate: Percentage of website visitors who complete a target action
- Pipeline velocity: Speed at which qualified demand moves through funnel stages toward revenue
- Forecast attainment: Progress against the month’s or quarter’s expected contribution target
- Channel efficiency: Comparative output by channel relative to spend, effort, or resource allocation
- Engagement quality: Meaningful engagement indicators such as demo requests, content depth, return visits, or high-intent sessions
A KPI snapshot should also show comparisons such as:
- Month over month
- Quarter over quarter
- Year over year
- Actual vs target
- Actual vs benchmark

Channel and campaign analysis
Once leadership sees the headline results, they need the drivers behind them. This section breaks performance down by:
- Channel
- Campaign
- Audience segment
- Geography
- Product line
- Funnel stage
A good channel analysis does more than rank top performers. It explains why performance changed. That may include creative fatigue, improved audience targeting, landing page quality, seasonality, offer strength, or SDR follow-up speed.
For example:
- Search may generate the highest-intent leads but face rising CPC pressure
- Paid social may expand reach efficiently but contribute less to immediate conversion
- Email may produce the highest ROI because it re-engages known prospects
- Organic search may improve assisted pipeline even when last-click conversions remain flat
The real value is finding causal patterns, not just channel summaries.
Insights, actions, and next steps
This is the section most teams underinvest in, yet it is where the report becomes operationally valuable.
Every major finding should translate into a clear action. Use a simple structure:
- Insight: What the data suggests
- Action: What should be done
- Owner: Who is accountable
- Timeline: When the action will happen
- Expected impact: What business improvement is anticipated
Examples:
-
Insight: Paid search branded campaigns are efficient but nearing saturation
Action: Shift 12% of spend to non-branded high-intent terms
Owner: Performance marketing lead
Timeline: Next 2 weeks
Expected impact: Increase new pipeline volume without materially raising CAC -
Insight: Webinar leads convert well to MQL but stall before SQL
Action: Redesign handoff criteria and tighten follow-up SLA
Owner: Demand gen manager and SDR manager
Timeline: Before next reporting cycle
Expected impact: Improve MQL-to-SQL conversion rate
This is how reporting drives decisions rather than simply recording history.
How to build a monthly report that connects KPIs to revenue
An effective marketing reporting template starts with business logic, not with charts. Below is the implementation approach I recommend to enterprise teams that need board-ready reporting without constant rework.
Start with revenue goals and attribution logic
Before choosing metrics, define the revenue question the report must answer. That usually includes:
- How much pipeline marketing generated
- How much revenue marketing influenced
- Which channels accelerate or slow funnel movement
- Whether current performance supports future revenue targets
Then document the attribution logic. If your team uses first-touch, last-touch, multi-touch, or custom weighted attribution, state it clearly in the report. Otherwise, the same performance can be interpreted in conflicting ways by different stakeholders.
At a minimum, align metrics to these funnel checkpoints:
- Inquiry or lead creation
- Marketing qualification
- Sales acceptance
- Opportunity creation
- Pipeline value
- Closed-won revenue

Choose metrics executives actually care about
Executives care about marketing when it informs growth, efficiency, and forecast reliability. That means your template should prioritize metrics such as:
- Revenue contribution
- Pipeline creation
- Pipeline conversion
- CAC
- ROAS
- Payback period
- Forecast pacing
- Budget efficiency
Remove vanity metrics unless they support a business decision. Impressions, likes, reach, and opens may still matter, but only if they explain movement in pipeline quality, demand generation efficiency, or brand momentum in a measurable way.
A useful test is simple: if a metric changes, would leadership make a different decision? If not, it probably belongs in a supporting appendix or operational dashboard, not the executive report.
Use visuals that make trends easy to understand
The best report visuals are designed around leadership questions, not around data availability.
Use visuals that answer:
- Are we on target?
- What changed from last month?
- Which channels created the most value?
- Where are conversion bottlenecks?
- What is likely to happen next if trends continue?
Recommended visual structures include:
- Bullet charts for actual vs target
- Line charts for month-over-month and quarter-over-quarter trends
- Waterfall charts for contribution analysis
- Funnel charts for stage conversion
- Heat maps for channel efficiency comparisons
- Summary tables with variance columns for executive review
Keep labels clear, minimize chart clutter, and annotate major spikes or drops. Executives do not want to decode dashboards. They want the visual to support the decision instantly.
Marketing reporting template formats and examples to adapt
The best template format depends on who consumes the report and how often they review it. Most organizations benefit from more than one reporting format built on the same metric logic.
Dashboard-based reporting templates
A dashboard-based marketing reporting template is ideal for recurring leadership reviews and real-time visibility. It works best when stakeholders need self-service access to current numbers without waiting for manual report compilation.
Best use cases include:
- Weekly operating reviews
- Monthly executive check-ins
- Campaign pacing reviews
- Budget monitoring across channels
The strongest dashboard layouts are concise. They surface headline KPIs first, then allow drill-down into channels, campaigns, and geographies.
Presentation and document-style report templates
A presentation or document-style report is better when you need narrative, context, and recommendation depth. This format is especially useful for:
- Board meetings
- Monthly business reviews
- QBRs
- Cross-functional stakeholder updates
A strong narrative report usually follows this sequence:
- Executive summary
- KPI snapshot
- Business context
- Channel analysis
- Key insights
- Risks and dependencies
- Recommendations and next steps
This format is not a replacement for dashboards. It is the interpretation layer that turns data into leadership communication.
Agency and client reporting variations
For agencies or external reporting teams, the template needs more flexibility. Client-facing reports usually require adjustments in:
- Branding and white-labeling
- Commentary depth
- Strategic framing
- Data granularity
- Approval workflows
For single-channel programs, the report can focus deeply on channel mechanics such as search terms, creatives, or audience segments. For multi-channel programs, the structure should emphasize cross-channel contribution, spend allocation, and integrated funnel performance.
In either case, consistency matters. Each client report should preserve common KPI definitions and reporting logic while tailoring narrative and scope to the audience.
Common reporting mistakes and how to avoid them
Most monthly reports fail for predictable reasons. The good news is that these issues are fixable with a better template and stronger reporting discipline.
Reporting too many KPIs without linking them to business outcomes
When every metric looks equally important, nothing is actually prioritized. Executives should not have to infer which numbers matter. Structure the report so each KPI ties to growth, efficiency, contribution, or risk.
Mixing raw data with insights without a clear narrative
A table full of metrics is not a story. First show the outcome, then explain the driver, then recommend the action. That order makes the report much easier to consume.
Using inconsistent definitions, date ranges, or attribution rules
A report becomes politically risky when teams define pipeline, lead status, or influenced revenue differently. Lock down shared definitions and keep them stable. If logic changes, state it explicitly in the report.
Ending the report without decisions, owners, or follow-up actions
This is one of the biggest misses I see. If the report ends with charts instead of commitments, it creates observation without execution. Every monthly report should conclude with next steps, owners, and expected impact.
A practical workflow for maintaining consistent monthly reporting
Consistency is what makes a marketing reporting template scalable. Without a documented process, even a good template becomes unreliable over time.
Create a repeatable reporting process
Use a monthly workflow with fixed checkpoints:
- Collect data from approved systems such as CRM, ad platforms, web analytics, and marketing automation
- Validate data for completeness, date alignment, attribution consistency, and duplicate records
- Analyze performance against targets, trends, and benchmarks
- Draft insights with business context and recommended actions
- Review with stakeholders before executive distribution
As a best practice, define reporting deadlines in advance for each contributor. This reduces last-minute reconciliation and improves confidence in the final report.
Customize the template without losing consistency
Different stakeholders need different levels of detail, but your core reporting structure should remain fixed. Keep these sections standardized:
- Executive summary
- KPI snapshot
- Channel analysis
- Insights and actions
- Definitions and reporting logic
Then customize only what is necessary:
- Additional campaign tabs for channel owners
- Condensed summaries for executives
- Branded views for clients
- Regional slices for market leaders
Review the template quarterly. As strategy, budget mix, attribution maturity, and leadership priorities evolve, the template should evolve too. But do not change it so often that trend comparison becomes unreliable.
Build the system, then automate it with FineReport
Building this manually is complex; use FineReport to utilize ready-made templates and automate this entire workflow.
When enterprise teams try to build executive-ready marketing reports manually, they usually run into the same bottlenecks:
- Data spread across CRM, ad platforms, analytics tools, and spreadsheets
- Repeated copy-paste work every month
- Inconsistent metric definitions between teams
- Delayed reporting cycles
- Limited drill-down capability for executives and managers
FineReport solves these issues by helping teams centralize data, standardize KPI logic, automate recurring monthly reporting, and build dashboards and presentation-ready views from the same trusted dataset. That means your marketing reporting template becomes a repeatable reporting system rather than a one-off document.
It is especially valuable when you need to:
- Build executive dashboards and narrative monthly reports from one source
- Track pipeline and revenue contribution across channels
- Standardize KPI definitions across business units
- Offer drill-down analysis without rebuilding reports manually
- Reuse templates for internal teams, agencies, or client reporting

Get Ready-to-Use Dashboard Templates in Fine Gallery
If your current monthly reporting process depends on spreadsheets, screenshots, and manual commentary, the hidden cost is not just time. It is slower decisions, weaker alignment, and lower trust in the data.
The right marketing reporting template should help your leadership team answer three questions every month:
- What did marketing contribute to revenue?
- What is improving or underperforming across the funnel?
- What decisions should we make next?
When your report answers those clearly and consistently, marketing becomes easier to evaluate, defend, and scale.
FAQs
It should include an executive summary, a KPI snapshot, funnel metrics, channel performance, budget efficiency, and clear recommendations for next steps. The most useful templates also connect marketing activity to pipeline, revenue, and forecast progress.
A dashboard shows current performance in near real time, while a report explains what happened over a defined period and why it matters. Monthly reports are better for executive communication because they add context, trends, and decisions.
The most important KPIs are usually marketing-sourced pipeline, influenced revenue, CAC, ROAS, conversion rates, and forecast attainment. Supporting metrics like MQLs, SQLs, CPL, and website conversion rate help explain what is driving those outcomes.
Most teams should create it monthly because that cadence is frequent enough to spot trends without overwhelming stakeholders. Weekly views can support campaign optimization, but monthly reporting is usually best for executive review.
FineReport can centralize data from multiple channels, standardize KPI definitions, and automate executive dashboards. That makes it easier to produce consistent reports that link marketing performance to revenue and business decisions.


The Author
Yida Yin
FanRuan Industry Solutions Expert
Related Articles

Inventory Reporting: The KPI Framework That Prevents Stockouts, Overstock, and Margin Leakage
Inventory reporting is the operating system behind smarter replenishment, tighter working capital control, and more reliable customer service. For supply chain leaders, finance managers, and operations directors, the cha
Yida Yin
Jun 25, 2026

Best Oil and Gas Production Reporting Software in 2026: 7 Tools Compared for Operators
$1 is an $1 and dashboard platform that helps oil and gas teams turn production, operations, and business data into governed, shareable reports and real time $1. Best oil and gas production reporting software in 2026 at
Yida Yin
Jun 24, 2026

Environmental Social and Governance Reporting: A Step-by-Step Guide to Building an ESG Reporting Dashboard
Environmental social and governance reporting is no longer a side project for sustainability teams. It is now a management discipline that affects investor confidence, regulatory readiness, capital access, brand trust, a
Yida Yin
Jun 23, 2026