If you are searching for the best project reporting tools, you are probably trying to solve a practical problem: how to turn project data into clear, repeatable, stakeholder-ready reporting without creating a manual reporting burden for PMOs, project managers, operations leaders, and executive teams.
Project reporting tools sit at the intersection of project management, BI, and operational reporting. Some tools are built directly into project management platforms, which makes them convenient for day-to-day delivery tracking. Others are stronger as reporting layers, helping teams build executive dashboards, scheduled reports, audit-friendly workflows, and portfolio-level visibility across systems.
For 2026, the best choice depends less on flashy dashboards and more on whether a platform can support the reporting realities that teams face every week:
Teams wanting flexible work management and visual reporting
Strong
Limited
Limited
Moderate
Moderate
Moderate to strong
Easy
Small to mid-sized teams, agencies, ops teams
Wrike
Larger teams needing portfolio visibility and work management controls
Strong
Limited
Limited
Moderate
Strong
Strong
Moderate
Enterprise teams, PMOs, marketing and professional services
Asana
Team collaboration with straightforward status visibility
Good
Limited
Limited
Limited
Moderate
Moderate
Easy
Cross-functional teams, smaller PMOs
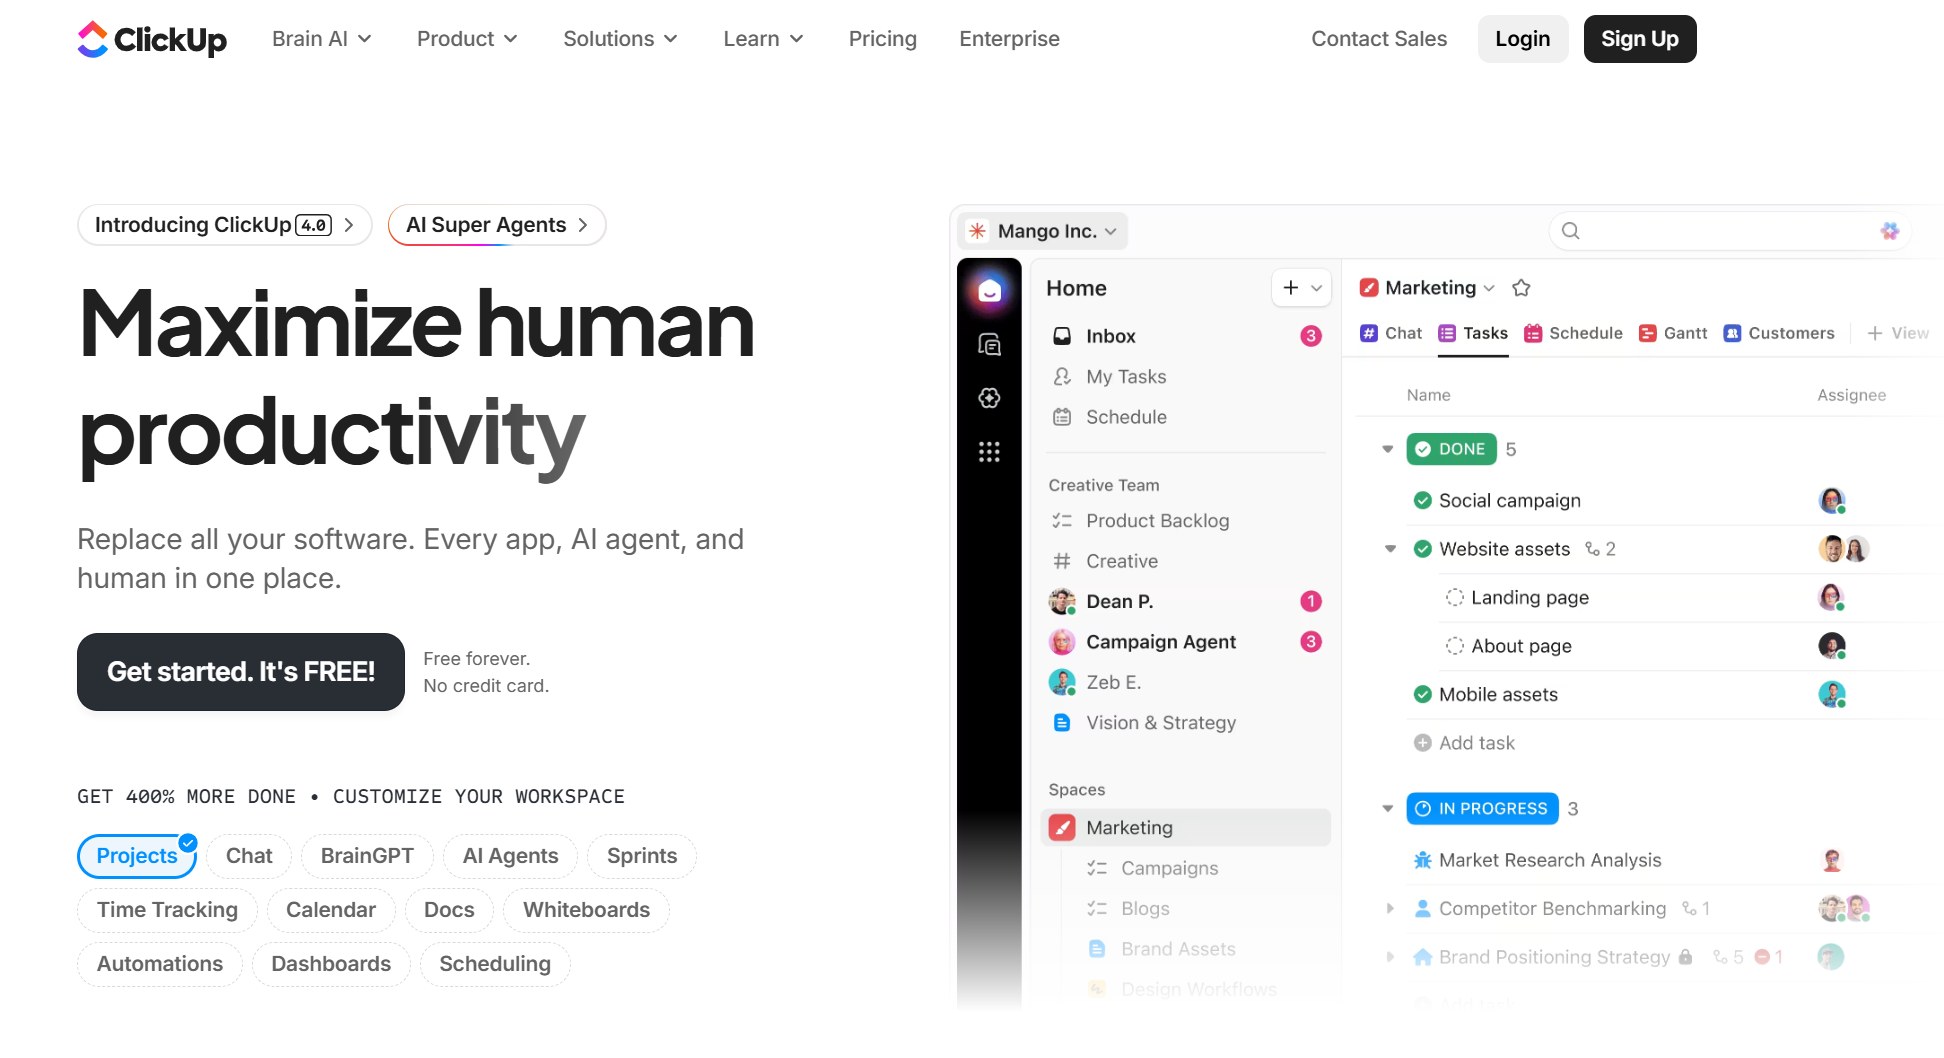
ClickUp
Highly customizable team productivity and reporting
Good
Limited
Limited
Moderate
Moderate
Moderate
Moderate
Scaling teams, internal ops, startups
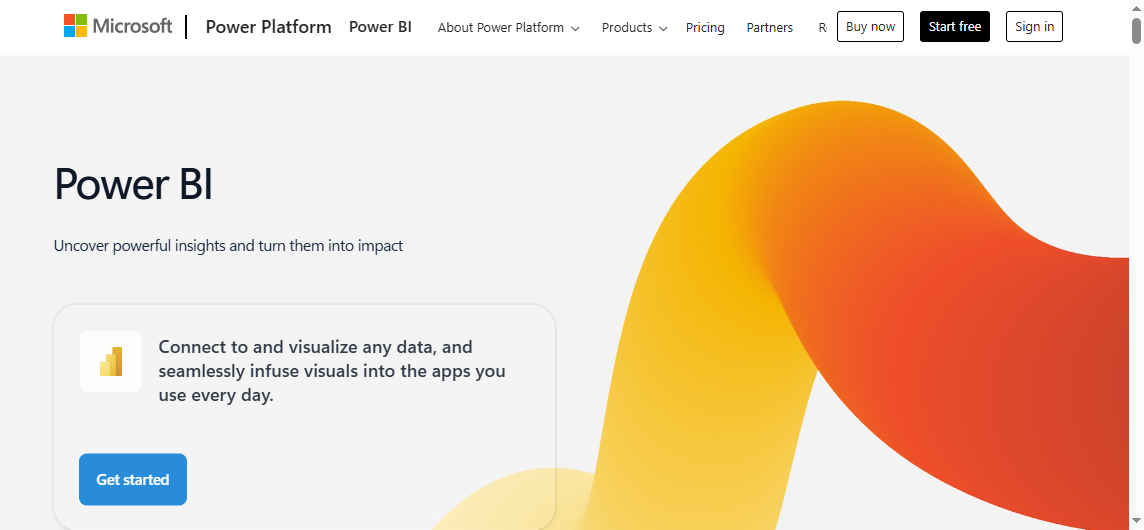
Power BI
Analytics layer on top of project data from multiple systems
Strong
Limited
Moderate with Microsoft stack
Limited
Strong
Strong
Moderate
BI teams, analysts, enterprises with data models
This comparison is intentionally balanced. Native project management platforms usually win on convenience and workflow context. Dedicated reporting platforms and BI tools usually win on reporting depth, governance, and executive-ready output.
How we compared the best project reporting tools for 2026
Not every project reporting tool is trying to solve the same problem. Some are built for daily project coordination. Others are built for executive reporting, governance, or large-scale portfolio oversight. So instead of judging them all by a single standard, this comparison uses five lenses that matter most in real reporting environments.
The evaluation lens: reporting depth, automation, governance, integrations, and ease of adoption
Here is the framework used for this review:
Reporting depth: Can the tool support both dashboards and structured reports? Does it handle cross-project visibility, stakeholder summaries, and drill-down analysis?
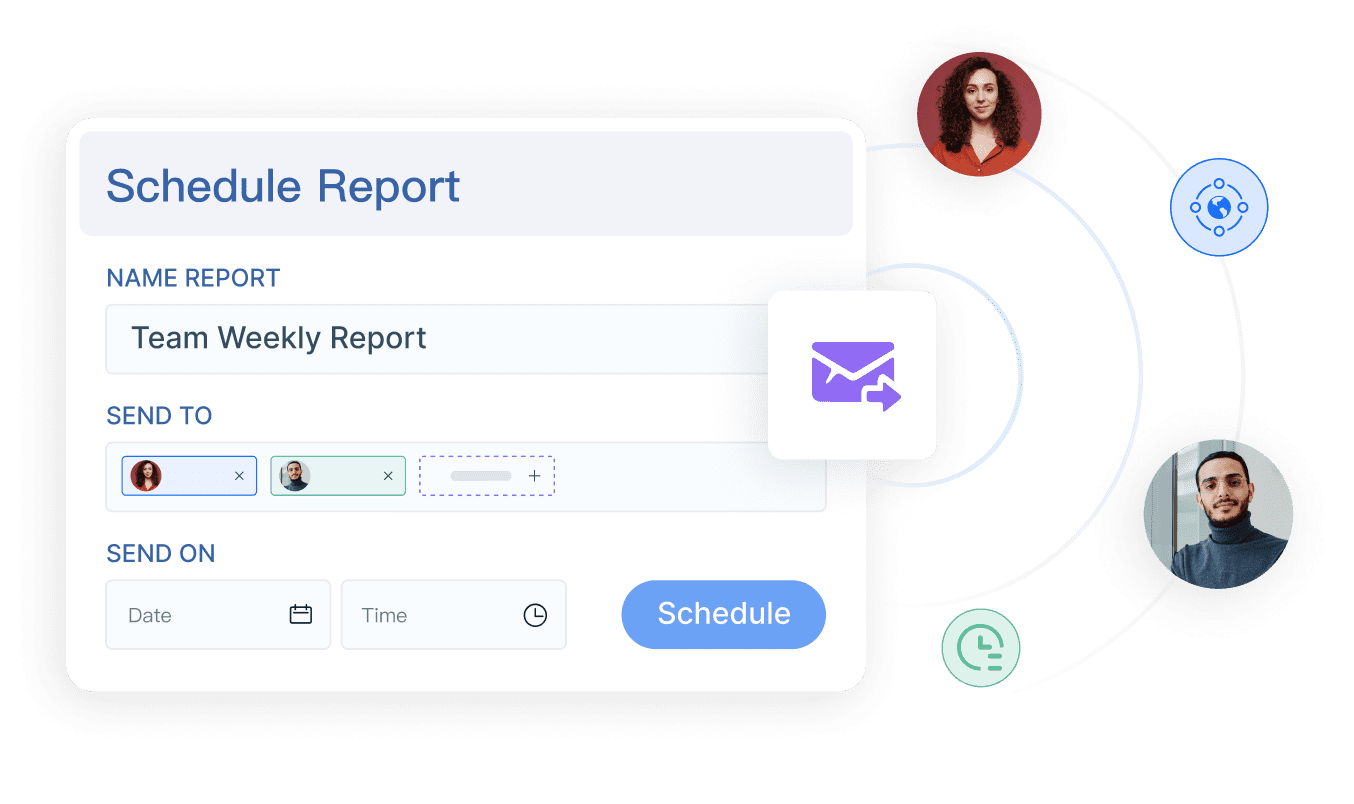
Automation: Can teams schedule recurring reports, trigger alerts, distribute updates automatically, and reduce manual status reporting?
Governance: Does the platform support permissions, auditability, approval controls, consistent metrics, and role-based visibility?
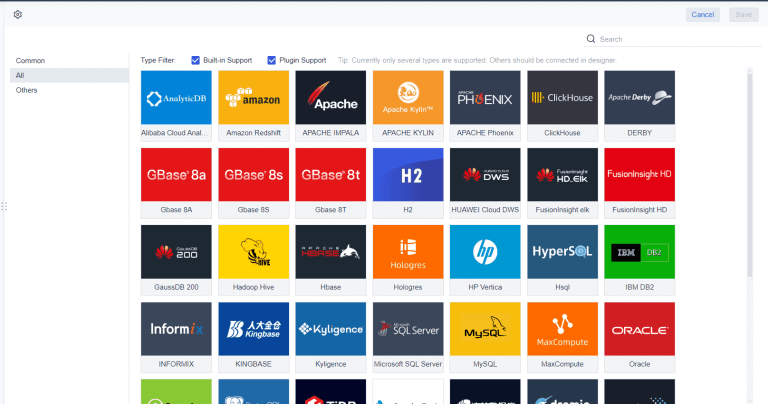
Integrations: Can the tool work with project systems, spreadsheets, databases, and analytics layers without creating data silos?
Ease of adoption: How quickly can teams create useful reporting workflows without a long implementation cycle?
For PMOs and enterprise teams, reporting depth and governance often matter more than pure dashboard aesthetics. A nice chart is helpful, but repeatable, controlled, trusted reporting matters more when the audience includes finance, operations, executives, and compliance stakeholders.
Who this comparison is for
This guide is designed for teams that need more than a simple project board:
Project managers who prepare weekly and monthly status packs
Operations leaders who need project data tied to delivery outcomes
Cross-functional teams that report across multiple workstreams and systems
Enterprise application and reporting teams that support governed reporting at scale
If your reporting needs are limited to checking task status inside one workspace, almost any project tool can work. If your stakeholders expect scheduled updates, printable summaries, approvals, audit trails, or executive-ready rollups, the shortlist becomes narrower.
The testing criteria used in this comparison
We assessed each tool based on practical reporting tasks teams perform every week:
Dashboards
We looked at whether the platform supports:
Real-time KPI cards
Project health indicators
Portfolio rollups
Drill-down into project details
Dashboard customization for different audiences
Scheduled reports
We evaluated whether users can:
Schedule recurring status reports
Export reports to common formats
Distribute reports automatically by email or workflow
Reduce manual copy-paste work
Permissions and governance
We reviewed support for:
Role-based access
Departmental or team-level visibility rules
Approval workflows
Consistent metric definitions
Auditability for report changes and access
Executive visibility
We considered whether the tool can deliver:
High-level portfolio summaries
Clear project risk and issue reporting
Printable or presentation-ready outputs
Cross-project comparisons for leadership reviews
Good project reporting is not just about seeing data. It is about making sure the right people see the right version of the truth at the right time.
7 best project reporting tools for 2026 compared
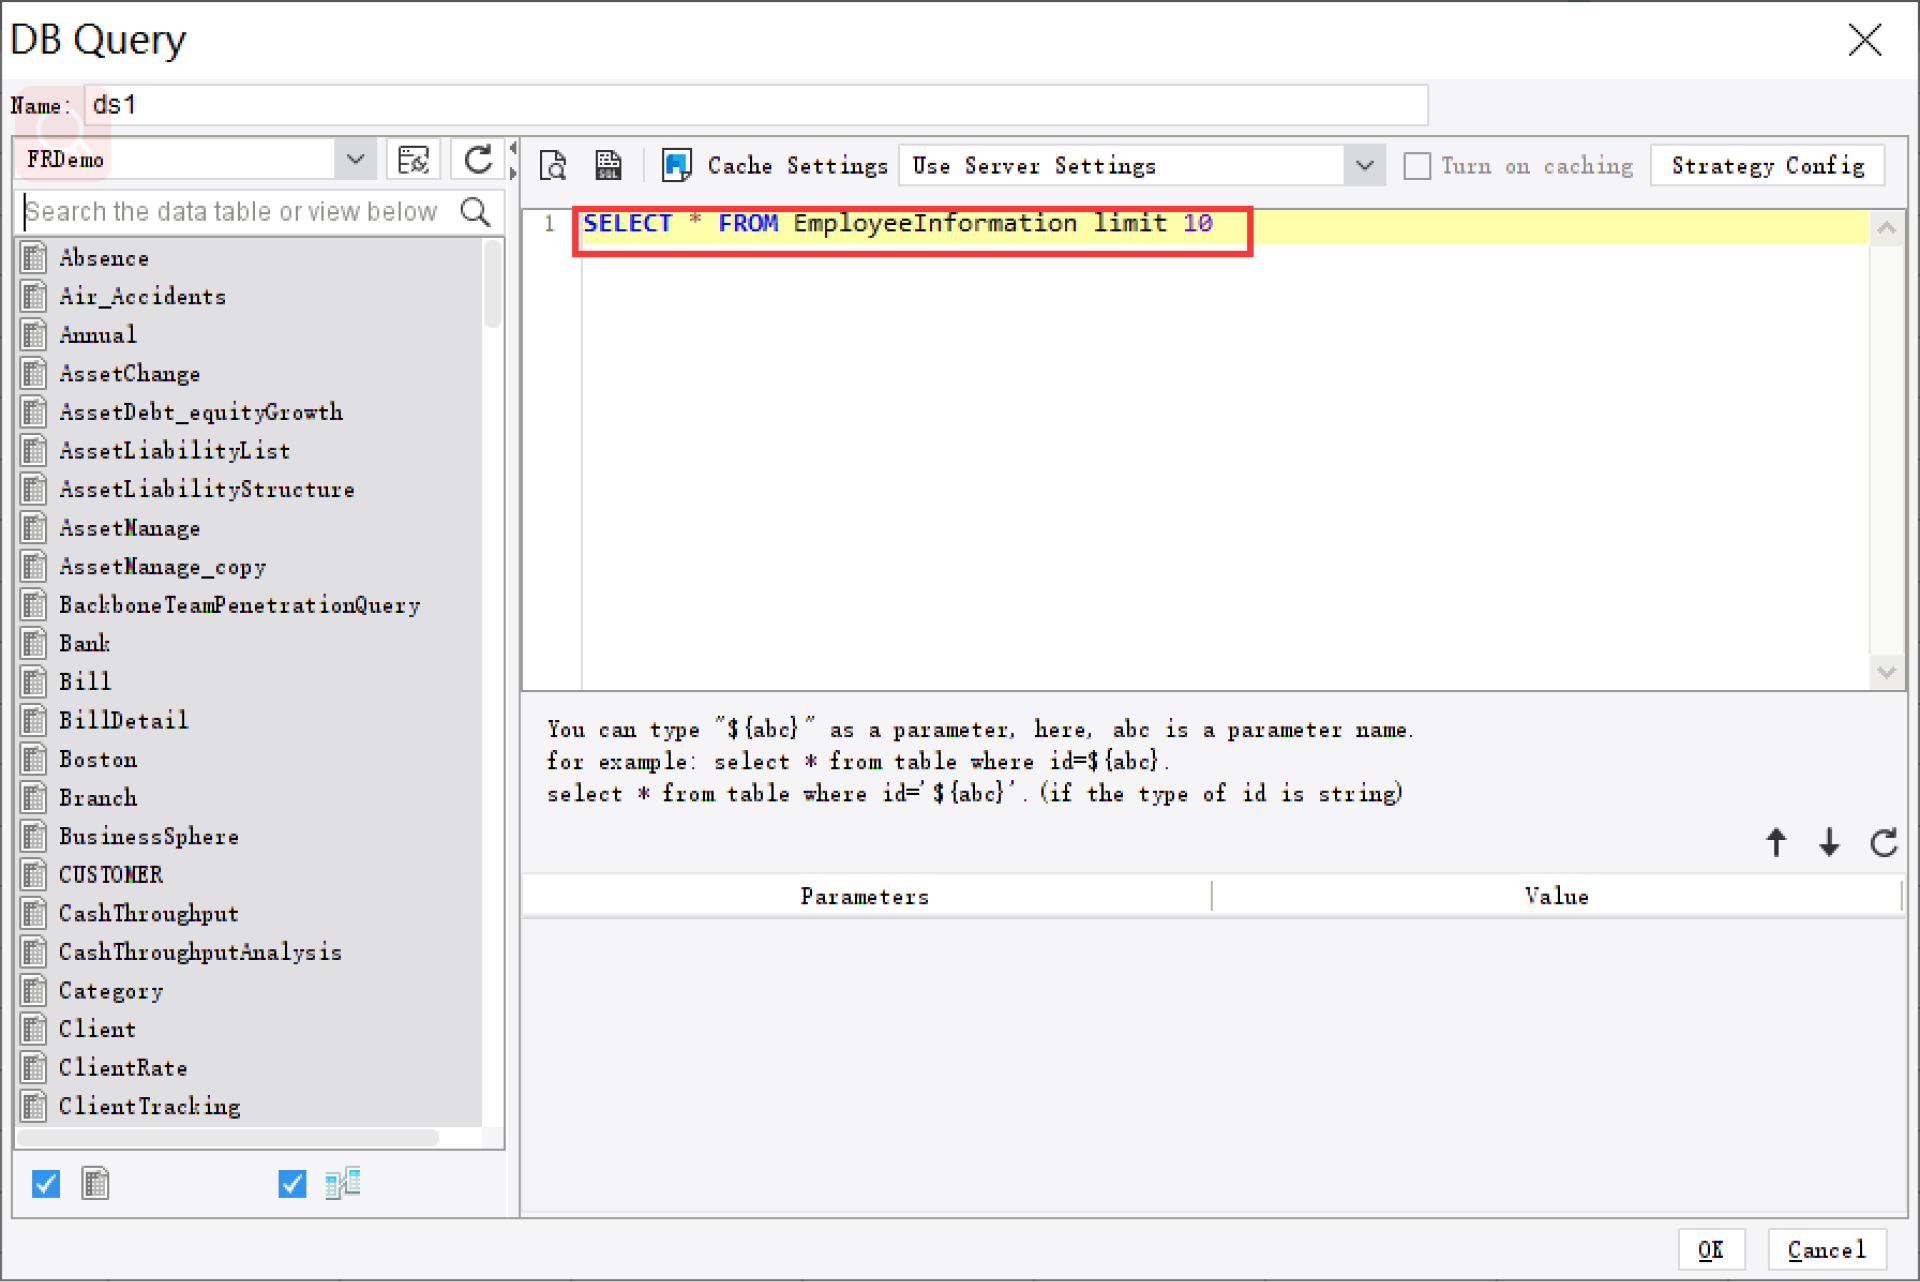
2. FineReport overview
Best for organizations prioritizing workflow automation and report distribution.
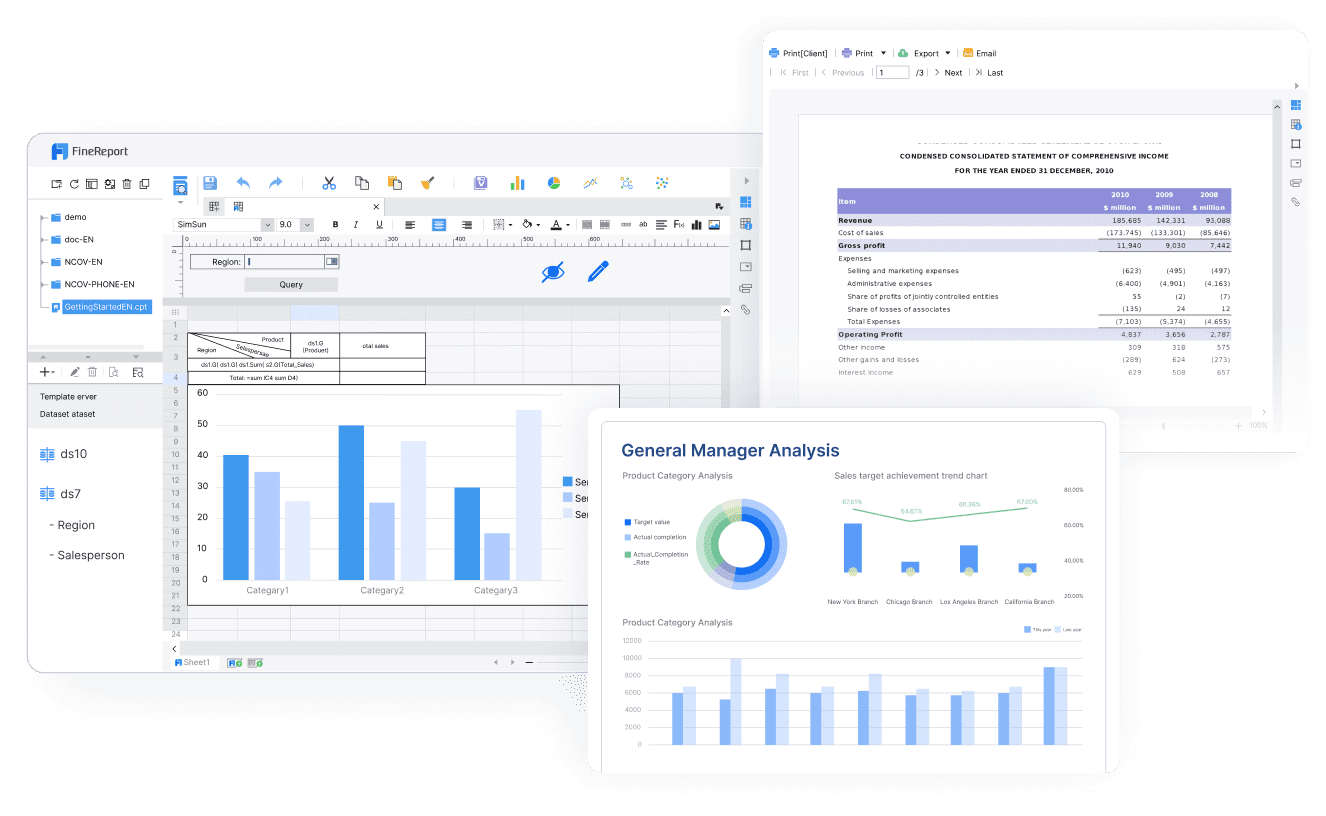
FineReport is not a project management platform in the traditional sense. It is an enterprise reporting and dashboard platform that can sit on top of project data from business systems, databases, and operational workflows. That makes it especially relevant for organizations that already have project data in one or more systems but need better reporting automation, structured outputs, and governance.
Tools like Smartsheet, Wrike, or monday.com are often used to run project work. FineReport becomes valuable when the reporting requirement grows beyond native dashboards and into recurring executive packs, parameterized reports, printable summaries, multi-source views, and controlled distribution.
Supports data entry forms and workflow-oriented reporting scenarios
Well suited for organizations that need consistent reporting across departments or business units
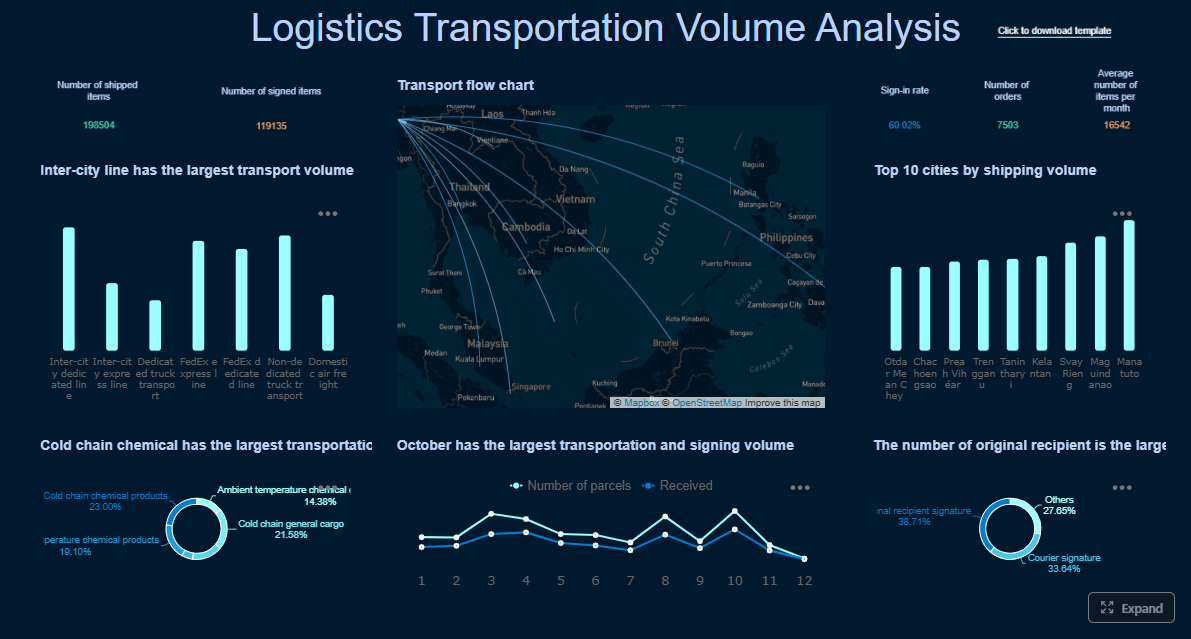
Useful for operational reporting beyond pure project status, such as finance, delivery, manufacturing, logistics, and management reviews
Notable limitations
It is not a full project execution workspace like a task management platform
Teams looking for lightweight task tracking alone may find it broader than they need
Best results depend on having clear project data sources and reporting requirements
Pricing approach
FineReport is typically positioned as an enterprise reporting platform, so pricing generally depends on deployment scope, usage needs, and implementation context.
Ideal use case
FineReport is a strong fit for enterprises, PMOs, and reporting teams that need governed, automated, executive-ready project reporting across one or more operational systems.
Best for teams that need strong dashboards and flexible stakeholder reporting.
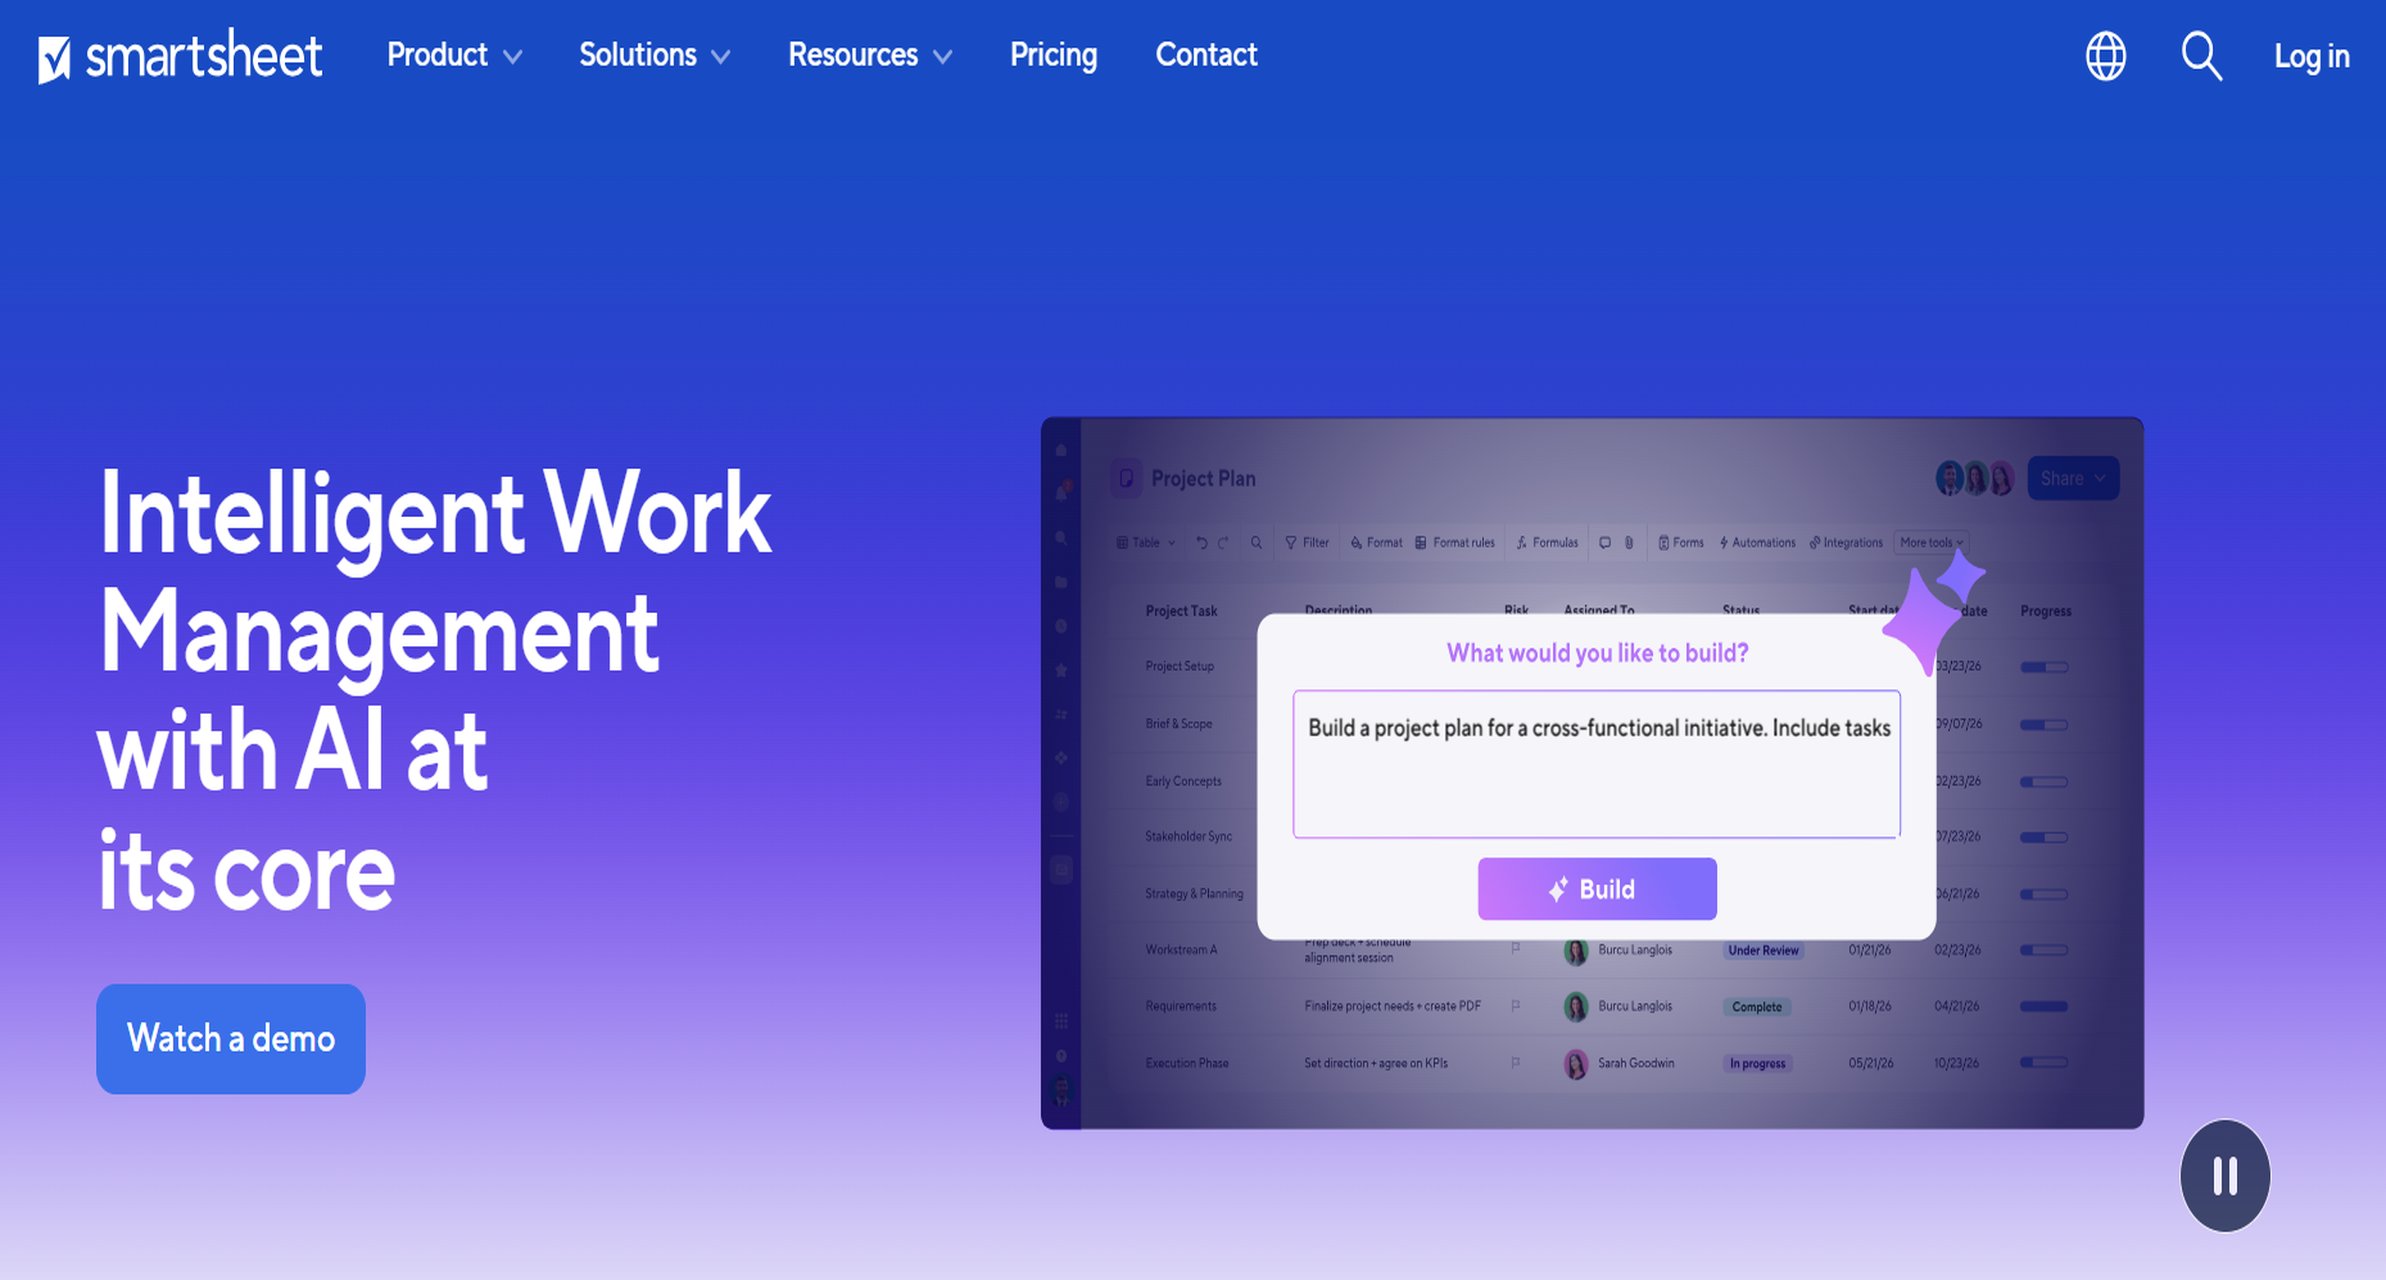
Smartsheet remains one of the strongest options for organizations that want project work management and reporting in the same environment. It combines familiar sheet-style project tracking with dashboards, reports, portfolio views, and automation features that appeal to PMOs and operations teams.
Key strengths
Flexible workspace for projects, programs, and processes
Good dashboarding and portfolio visibility
Strong automation for reminders, updates, and workflows
Useful for teams that want planning, execution, and reporting in one platform
Widely adopted in operations-heavy environments
Notable limitations
Reporting can be less presentation-ready than a dedicated enterprise reporting platform
Complex stakeholder reporting may require extra setup
Teams with strict formatting or print-ready requirements may want a more specialized reporting layer
Pricing approach
Smartsheet typically uses subscription-based pricing by plan and user tier, with advanced capabilities often tied to higher plans or enterprise packages.
Ideal use case
Smartsheet is a good fit for PMOs, transformation offices, and operational teams that want a balance of project execution, reporting, and process automation without building a separate BI stack first.
3. monday.com overview
Best for companies needing tighter governance, approvals, and portfolio-level visibility.
monday.com has grown from a team planning tool into a broader work management platform. It offers dashboards, automations, portfolio views, and integrations that make it useful for organizations managing campaigns, operations, client delivery, or internal initiatives.
For reporting, monday.com is attractive because it is visual, approachable, and relatively quick to adopt. Teams can create stakeholder views without heavy BI skills.
Key strengths
Easy-to-use visual interface
Good dashboard creation for team and manager visibility
Flexible workflows and automation rules
Helpful for cross-functional work management
Suitable for agencies and mid-market teams that need adaptable reporting
Notable limitations
Governance depth may not satisfy every enterprise PMO
Highly formatted reports and print-ready executive packs may require external reporting support
Reporting depth can be strong for operational visibility but lighter for formal reporting requirements
Pricing approach
monday.com generally follows seat-based subscription pricing with higher plans unlocking more advanced automation, dashboards, and governance capabilities.
Ideal use case
A solid option for agencies, internal operations teams, and scaling organizations that want visual reporting tied directly to work execution.
4. Tools #4–#7 at a glance
Several other tools are worth considering depending on your reporting model, team maturity, and data environment.
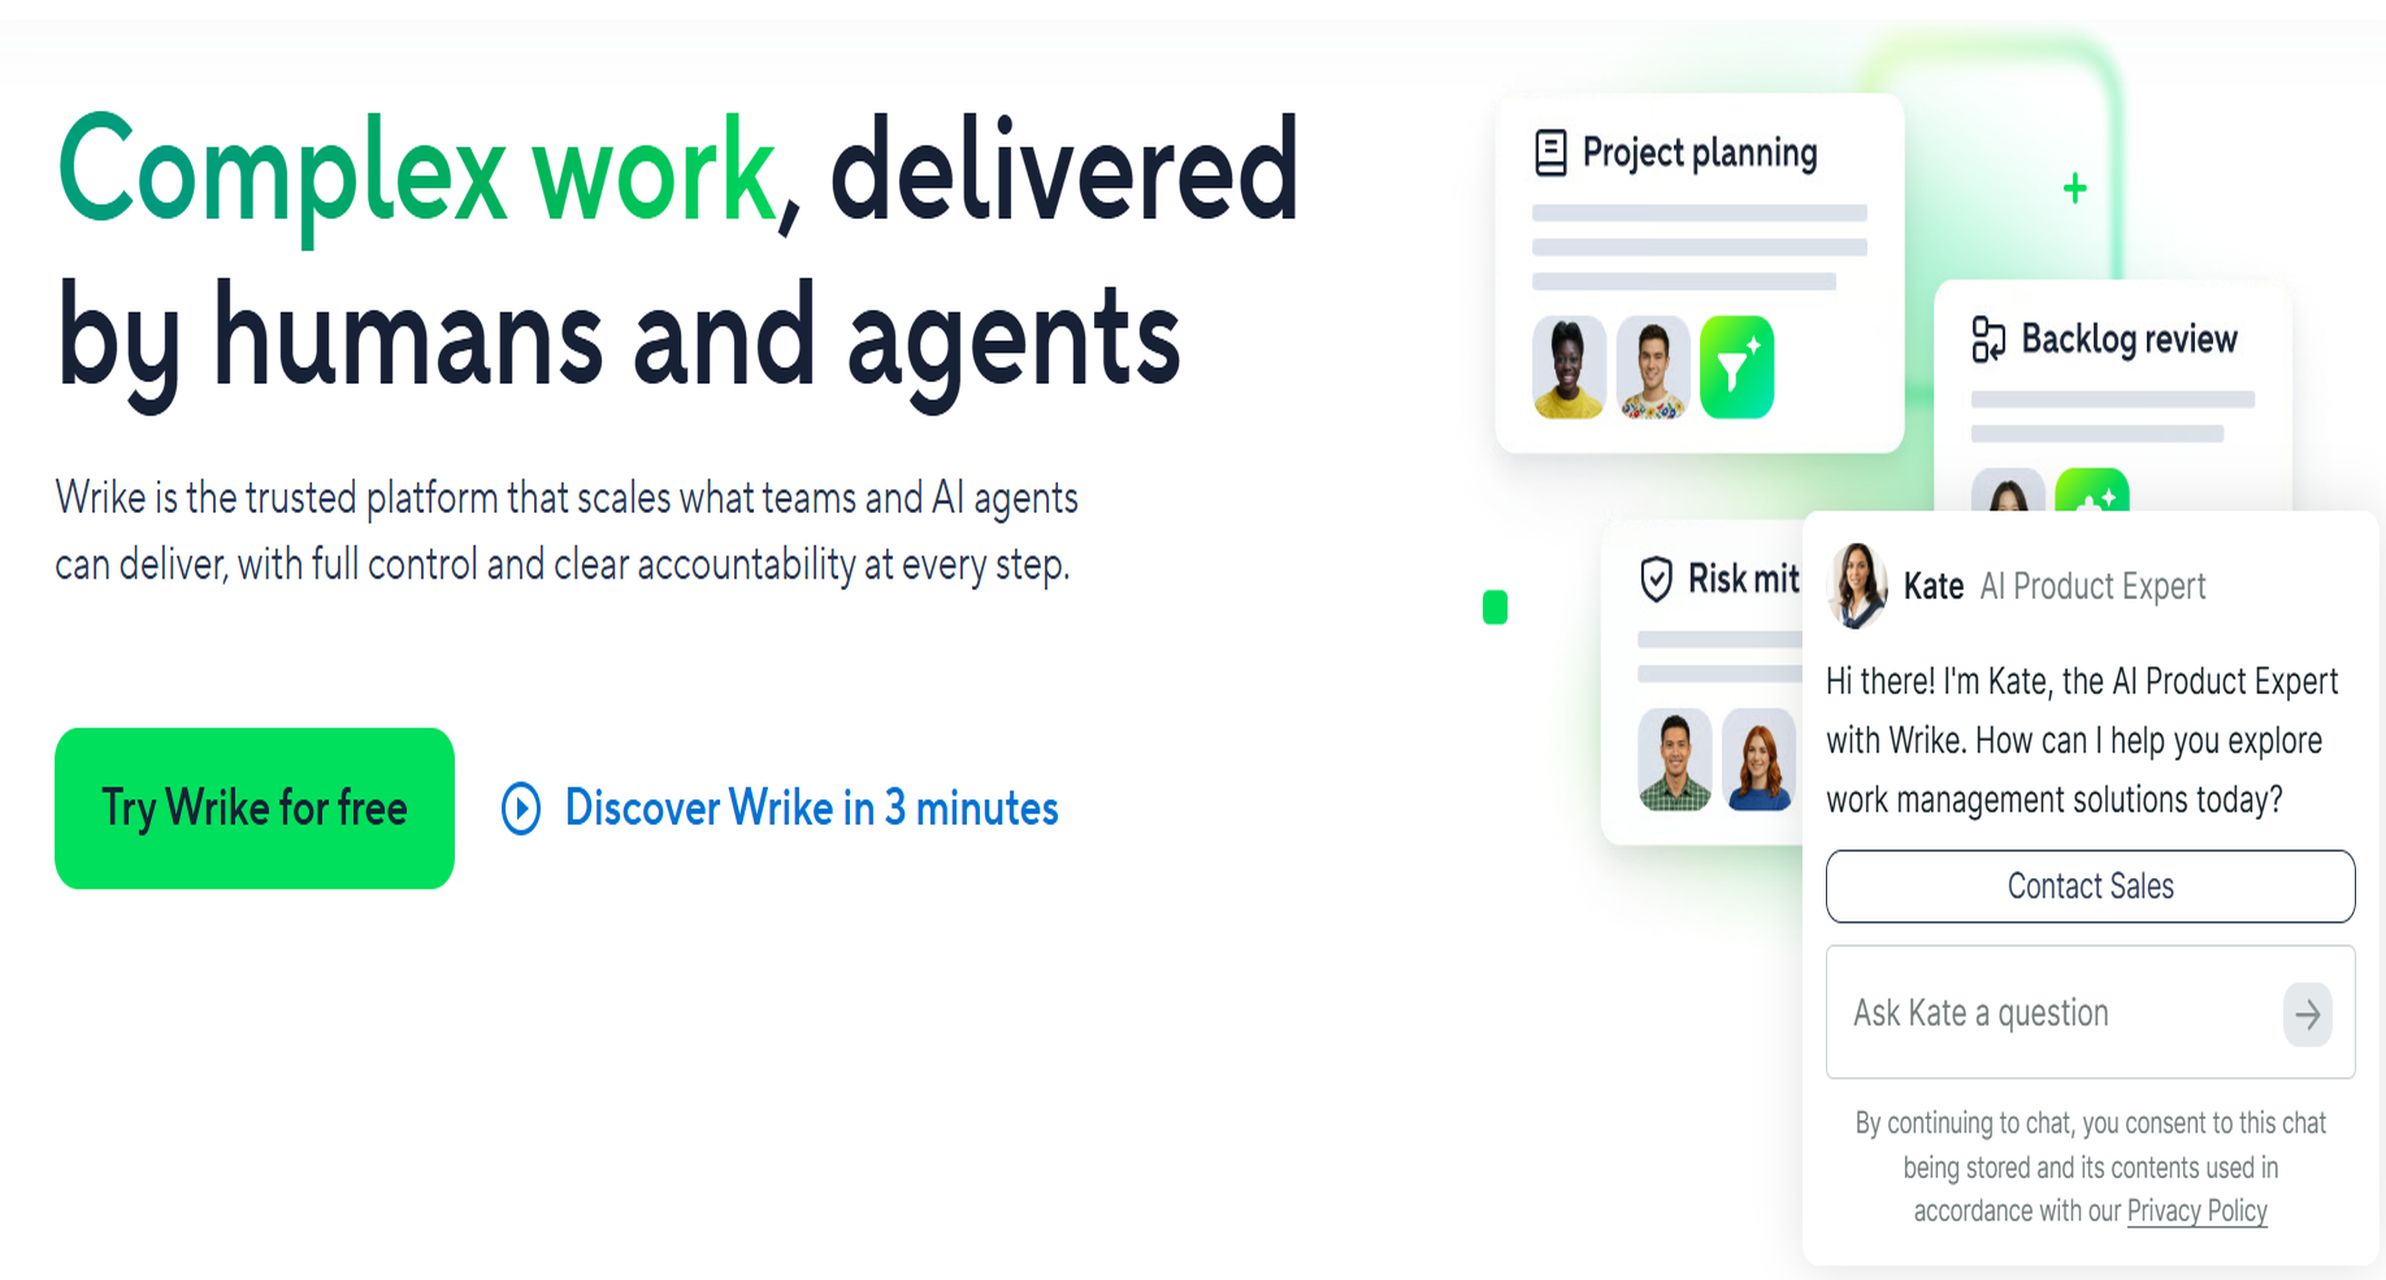
Wrike
Standout strengths:
Strong work management for larger teams
Good portfolio and workload visibility
Enterprise-friendly controls compared with lighter tools
Supports reporting across departments and service lines
Trade-offs:
Can take more time to configure
Reporting is good, but highly formatted executive reporting may still need an external layer
Best for:
Enterprise teams, PMOs, professional services, and marketing organizations that need structured work visibility.
Asana
Standout strengths:
Clean interface and easy adoption
Useful for status tracking and team-level reporting
Which platform wins on automation, governance, and reporting depth?
Different tools win in different categories. The right answer depends on whether your biggest problem is manual reporting effort, lack of control, or insufficient visibility.
Best for automation
When evaluating automation, the core question is simple: how much recurring reporting work can the tool remove?
Smartsheet: Strong workflow automation inside project and process environments. Useful for alerts, update requests, reminders, and status workflows.
FineReport: Strong for recurring report generation, scheduled delivery, parameter-based report output, and structured distribution to stakeholders.
monday.com: Helpful automation for task and workflow updates, though reporting distribution depth depends on the use case.
Power BI: Strong scheduled refresh and dashboard distribution in analytics-driven environments.
Best for automation: FineReport and Smartsheet
If you need automation inside the project workspace itself, Smartsheet is one of the most practical choices. If you need automation around report generation, scheduled distribution, and stakeholder-ready outputs, FineReport has a stronger reporting-specific advantage.
Best for governance
Governance is where many project reporting rollouts succeed or fail. If executives, finance teams, PMOs, and department heads all consume project reporting, access control and consistency become non-negotiable.
What matters most
Role-based access
Audit trails
Approval controls
Consistent metrics across teams
Controlled visibility by business unit or project type
Top performers
Wrike: Better enterprise control than many lightweight project tools
Smartsheet: Strong structure for operational governance and controlled reporting access
FineReport: Well suited for governed reporting environments where permissions, report standardization, and controlled data access matter
Power BI: Strong governance when implemented with a mature data model and Microsoft administration practices
Best for governance: FineReport, Wrike, and Power BI
For enterprise PMOs that need governed reporting outputs, FineReport stands out as a practical choice. For broader work management governance, Wrike is strong. For data-model-centric governance across multiple systems, Power BI is also a serious contender.
Best for reporting depth
Reporting depth is about whether the platform can serve both operational users and executives without forcing teams to rebuild the same story repeatedly.
Power BI: Strong for analysis, modeling, and interactive dashboards
FineReport: Strong for combining dashboards with paginated, printable, and highly formatted reports
Wrike: Good for portfolio and team visibility inside the platform
Best for reporting depth: FineReport and Power BI
If your priority is interactive analytics, Power BI is often the stronger fit. If your team needs both dashboards and presentation-ready, structured, repeatable reports, FineReport offers broader reporting depth for formal project reporting workflows.
What reporting tools can you use with project data?
Project data does not have to stay inside a single project management platform. In many organizations, the most effective reporting stack combines native project systems with BI or enterprise reporting layers.
Native project management platforms
Native platforms are the simplest place to start because planning, execution, and reporting live in one workspace.
Examples include:
Smartsheet
monday.com
Wrike
Asana
ClickUp
These tools are useful when:
Most work happens in one platform
Reporting audiences are primarily project managers and team leads
Dashboards and board-level status tracking are enough
The organization wants quick adoption over heavy customization
The main limitation is that native reporting can become stretched when leadership expects formal status packs, cross-system views, or standardized reporting across departments.
BI and analytics layers
A BI layer is useful when project data must be analyzed alongside finance, resource, operations, or customer data.
Examples include:
Power BI
Tableau
Looker
These tools are typically used when:
Data comes from multiple systems
Historical trend analysis matters
Teams need custom KPIs across functions
Analysts or BI teams can manage models and semantic layers
BI layers are powerful for visualization and analytical insight. But some organizations still need a separate reporting solution if they also require highly formatted, printable, scheduled, or workflow-driven reports.
Hybrid reporting stacks
Hybrid stacks are increasingly common because no single tool handles every reporting requirement equally well.
PMOs need recurring board packs or monthly review reports
Operations or finance teams require structured outputs and approvals
FineReport is especially relevant in hybrid stacks because it can bridge operational data and stakeholder-ready reporting, rather than replacing project execution tools.
The right project reporting tool depends on your reporting maturity, not just your software budget.
Match the tool to your reporting maturity
Startup teams
If your team is small and moving quickly, prioritize:
Ease of setup
Basic dashboards
Task-level visibility
Light automation
Good fits often include Asana, ClickUp, or monday.com.
Scaling operations
If your organization is growing and needs better reporting discipline, prioritize:
Portfolio views
Automated updates
Standardized status reporting
Better cross-team visibility
Good fits often include Smartsheet, monday.com, or Wrike.
Enterprise PMOs
If you manage multiple portfolios, stakeholders, and reporting rules, prioritize:
Governance
Permissions
Auditability
Executive-ready reporting
Scheduled distribution
Cross-system integration
Good fits often include Smartsheet, Power BI, and FineReport, depending on whether the need is work management, analytics, or formal reporting.
Questions to ask before you buy
Before choosing a platform, ask these questions:
What data sources need to connect?
Is all project data in one platform, or do you also need finance, HR, delivery, or ERP inputs?
Who needs access?
Do only project teams need reports, or do executives, finance, and regional managers need controlled access too?
What governance rules matter?
Do you need approvals, permission layers, metric standardization, or audit trails?
How automated should reporting be?
Is a dashboard enough, or do you need recurring report generation and distribution?
Do you need dashboards only, or also structured reports?
This is one of the biggest decision points. Many teams underestimate how often they still need printable or formal report outputs.
Key Elements of a Good Business Report
Clear Reporting Purpose: Define the business question the report answers.
Accurate Data Source: Use reliable and regularly updated business data.
Structured Layout: Organize data into readable tables, charts, and sections.
Parameterized Filtering: Let users query by date, department, region, or project.
Scheduled Delivery: Automate recurring reports for stakeholders.
Actionable Summary: Highlight exceptions, risks, and next steps.
Final recommendation by team type
Best for small teams
Choose Asana or ClickUp if simplicity and speed matter most.
Best for agencies and visual work management teams
Choose monday.com if you want flexible, visual reporting tied closely to execution.
Best for enterprise work management and portfolio visibility
Choose Smartsheet or Wrike if you need a stronger operational platform with broader reporting and governance support.
Best for analytics-led environments
Choose Power BI if your team already centralizes project data and wants deep interactive analysis.
Best for reporting-heavy environments
Choose FineReport if your challenge is not project tracking itself, but building automated, governed, executive-ready project reporting across systems.
Practical recommendations for evaluating project reporting tools
Here are five practical recommendations from a reporting strategy perspective:
Separate workflow visibility from stakeholder reporting.
A tool that is great for managing tasks is not always the best tool for board reports or PMO governance.
Test one recurring reporting scenario before buying.
Use a real monthly or weekly reporting process to evaluate whether the tool reduces manual work.
Check whether dashboards can become formal reports.
Many teams discover too late that a dashboard screenshot is not an acceptable executive deliverable.
Review permissions early.
Reporting problems often come from weak access control, inconsistent metrics, or uncontrolled edits.
Plan for cross-system reporting.
As organizations scale, project data usually needs to connect with resource, financial, and operational data.
When FineReport is a strong fit for project reporting
Tools like Smartsheet, monday.com, Wrike, Asana, and ClickUp are widely used for project execution and team visibility. Power BI is widely used for analytics and dashboarding. But teams with complex reporting workflows may also need a dedicated enterprise reporting platform like FineReport.
FineReport is especially relevant when your project reporting requirements include:
Pixel-perfect project reports for leadership or clients
Governed reporting across business units and stakeholder groups
This matters because many PMOs do not just need charts. They need a reliable reporting system that supports regular review cycles, executive visibility, and operational consistency.
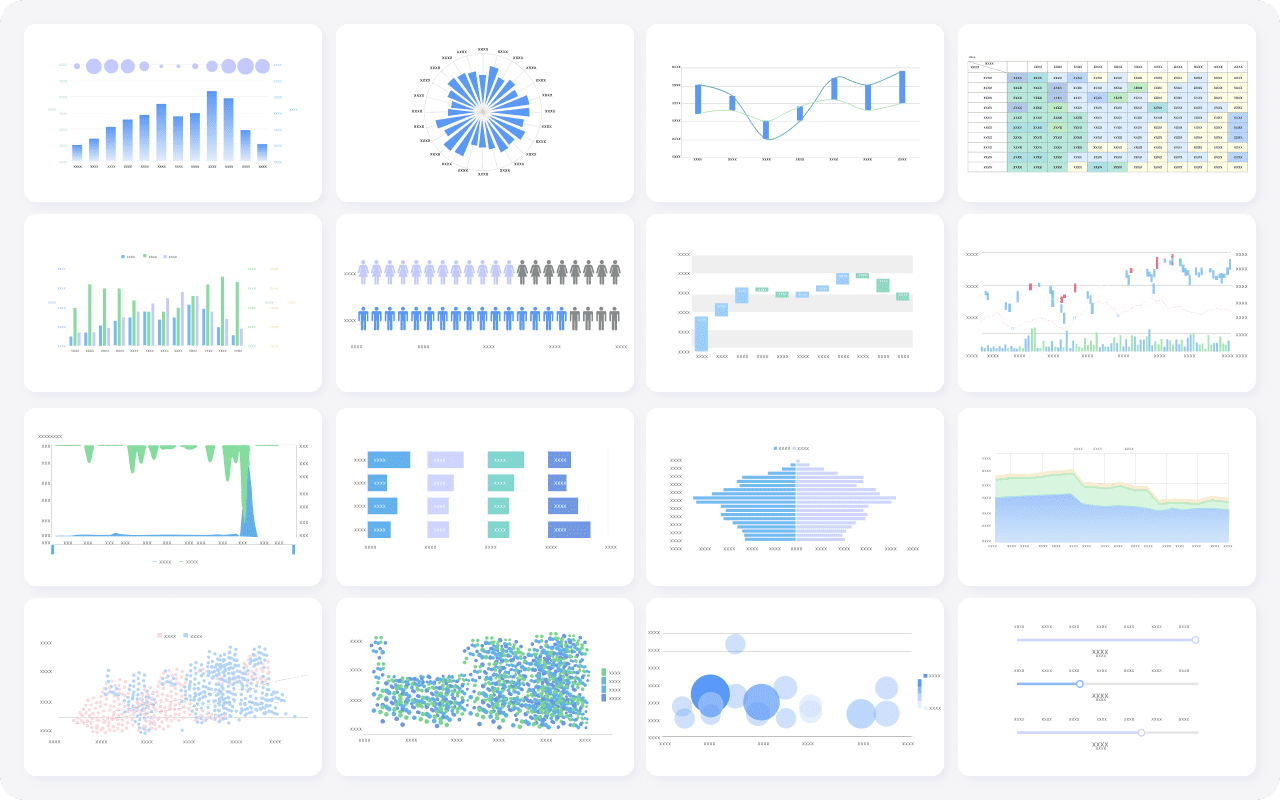
Get Ready-to-Use Dashboard and Report Templates in Fine Gallery
For organizations that already use project systems but struggle with executive reporting, recurring board packs, or multi-source project visibility, FineReport can serve as the reporting layer that makes project data more usable.
Final thoughts
The best project reporting tools for 2026 are not all solving the same problem.
Choose native project platforms if your main need is task and project visibility inside one workspace.
Choose a BI layer if your priority is analytical dashboards across multiple systems.
Choose an enterprise reporting platform if your team needs governed, automated, structured reporting for stakeholders who expect more than dashboards.
For many teams, the winning setup is not one tool alone, but the right combination of project execution and reporting depth. If your environment is reporting-heavy, executive-facing, or governance-sensitive, FineReport is worth evaluating alongside the more common project management platforms.
Focus on reporting depth, automation, governance, integrations, and ease of adoption. The best tool should match how your team delivers reports, not just how attractive its dashboards look.
Yes, although some platforms combine both. Project management software helps teams run work day to day, while project reporting tools are often stronger at executive dashboards, scheduled reports, portfolio visibility, and governed distribution.
It depends on your environment, but platforms with strong structured reporting, scheduling, and governance usually work best for executive and PMO use cases. In this comparison, FineReport, Smartsheet, Wrike, and Power BI are the strongest options for broader portfolio visibility.
Many can automate recurring report generation, alerts, and scheduled distribution. This helps reduce manual reporting work and keeps leaders and stakeholders updated with consistent information.
Not always. If your native platform already gives you the dashboards and reports you need, it may be enough, but Power BI becomes more useful when you need cross-system analysis, deeper modeling, or an analytics layer on top of project data.
Product Trial
FineReport
Pixel-perfect reports · Interactive dashboards · Easy data entry · Digital twins


 Best for companies needing tighter governance, approvals, and portfolio-level visibility.
 Standout strengths: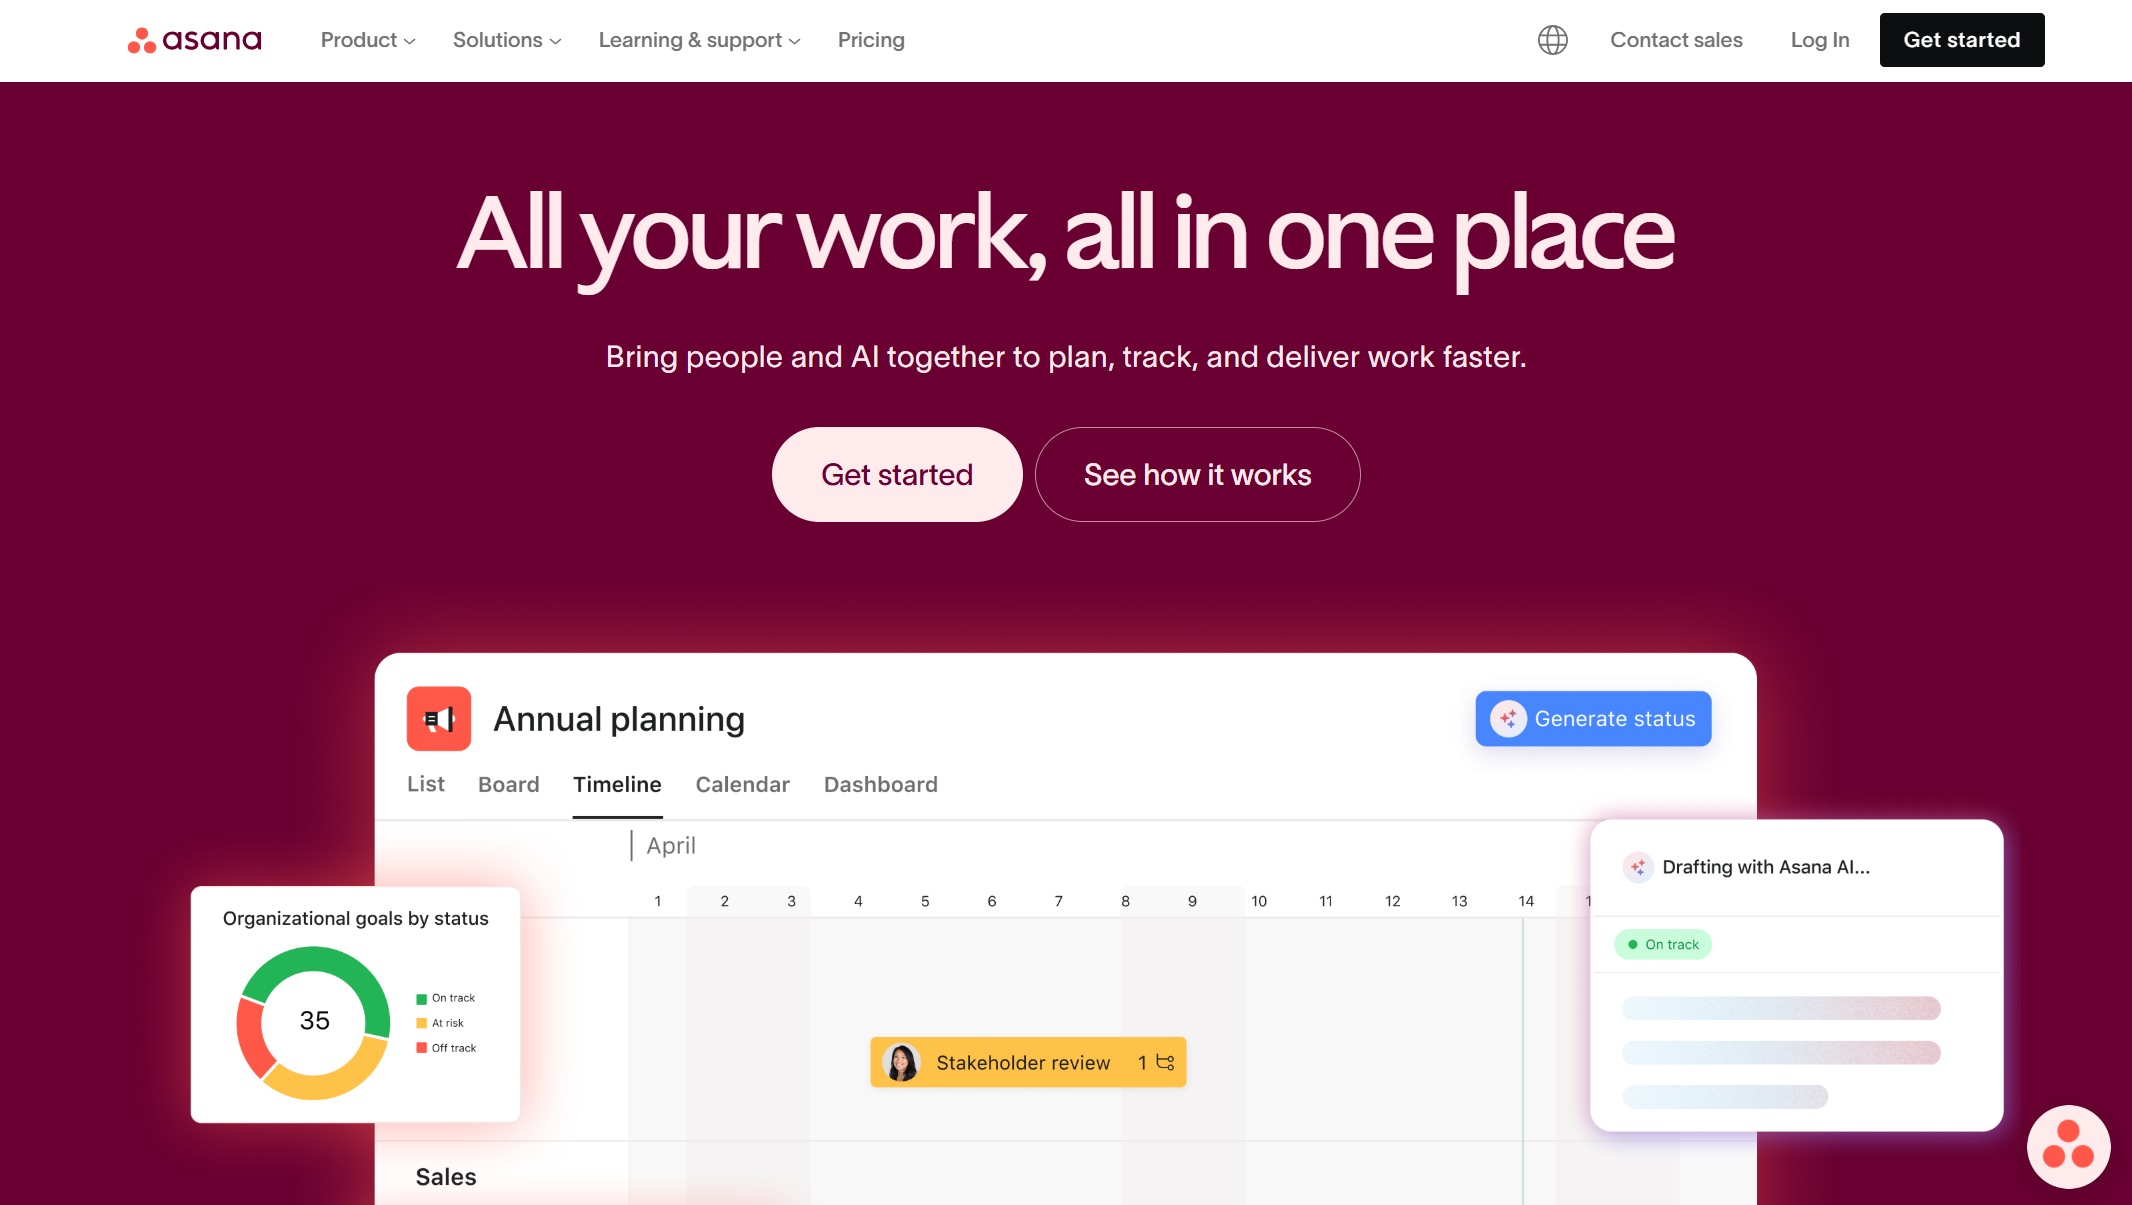
 Standout strengths:
 Standout strengths: